https://doi.org/10.5194/hess-21-4533-2017 © Author(s) 2017. This work is distributed under the Creative Commons Attribution 3.0 License.
Recent changes in terrestrial water storage in the Upper Nile Basin:
an evaluation of commonly used gridded GRACE products
Mohammad Shamsudduha1,2, Richard G. Taylor2, Darren Jones3, Laurent Longuevergne4, Michael Owor5, and Callist Tindimugaya6
1Institute for Risk and Disaster Reduction, University College London, London, UK 2Department of Geography, University College London, London, UK
3Centre for Geography, Environment and Society, University of Exeter, Exeter, UK 4CNRS – UMR 6118 Géosciences Rennes, Université de Rennes 1, Rennes, France 5Department of Geology & Petroleum Studies, Makerere University, Kampala, Uganda
6Directorate of Water Resources Management, Ministry of Water & Environment, Entebbe, Uganda Correspondence to:Mohammad Shamsudduha (m.shamsudduha@ucl.ac.uk)
Received: 14 March 2017 – Discussion started: 21 March 2017
Revised: 19 June 2017 – Accepted: 8 August 2017 – Published: 12 September 2017
Abstract. GRACE (Gravity Recovery and Climate Experi-ment) satellite data monitor large-scale changes in total ter-restrial water storage (1TWS), providing an invaluable tool where in situ observations are limited. Substantial uncer-tainty remains, however, in the amplitude of GRACE grav-ity signals and the disaggregation of TWS into individual terrestrial water stores (e.g. groundwater storage). Here, we test the phase and amplitude of three GRACE 1TWS sig-nals from five commonly used gridded products (i.e. NASA’s GRCTellus: CSR, JPL, GFZ; JPL-Mascons; GRGS GRACE) using in situ data and modelled soil moisture from the Global Land Data Assimilation System (GLDAS) in two sub-basins (LVB: Lake Victoria Basin; LKB: Lake Kyoga Basin) of the Upper Nile Basin. The analysis extends from January 2003 to December 2012, but focuses on a large and accurately ob-served reduction in1TWS of 83 km3from 2003 to 2006 in the Lake Victoria Basin. We reveal substantial variability in current GRACE products to quantify the reduction of1TWS in Lake Victoria that ranges from 80 km3(JPL-Mascons) to 69 and 31 km3for GRGS andGRCTellusrespectively. Rep-resentation of the phase in TWS in the Upper Nile Basin by GRACE products varies but is generally robust with GRGS, JPL-Mascons, andGRCTellus(ensemble mean of CSR, JPL, and GFZ time-series data), explaining 90, 84, and 75 % of the variance respectively in “in situ” or “bottom-up”1TWS in the LVB. Resolution of changes in groundwater storage (1GWS) from GRACE 1TWS is greatly constrained by
both uncertainty in changes in soil-moisture storage (1SMS) modelled by GLDAS LSMs (CLM, NOAH, VIC) and the low annual amplitudes in1GWS (e.g. 1.8–4.9 cm) observed in deeply weathered crystalline rocks underlying the Up-per Nile Basin. Our study highlights the substantial uncer-tainty in the amplitude of1TWS that can result from dif-ferent data-processing strategies in commonly used, gridded GRACE products; this uncertainty is disregarded in analyses of 1TWS and individual stores applying a single GRACE product.
1 Introduction
glacier and ice melting, sea-level rise) and anthropogenic (e.g. abstraction-driven groundwater depletion) influences on 1TWS. GRACE-derived TWS provides vertically integrated water storage changes in all water-bearing layers (Wahr et al., 2004; Strassberg et al., 2007; Ramillien et al., 2008) that include (Eq. 1) surface water storage in rivers, lakes, and wet-lands (1SWS), soil moisture storage (1SMS), ice and snow water storage (1ISS), and groundwater storage (1GWS). Over the last decade, GRACE measurements have become an important hydrological tool for quantifying basin-scale 1TWS (Güntner, 2008; Xie et al., 2012; Hu and Jiao, 2015) and are increasingly being used to assess spatio-temporal changes in specific water stores (Famiglietti et al., 2011; Shamsudduha et al., 2012; Jiang et al., 2014; Castellazzi et al., 2016; Long et al., 2016; Nanteza et al., 2016) where time-series records of other individual freshwater stores are avail-able (Eq. 1).
1TWSt=1GWSt+1ISSt+1SWSt+1SMSt (1)
GRACE-derived 1TWS derive from monthly gravitational fields which can be represented as spherical harmonic co-efficients that are noisy as depicted in north–south elon-gated linear features or “stripes” on monthly global grav-ity maps (Swenson and Wahr, 2006; Wang et al., 2016). Post-processing of GRACE SH data is therefore required. The most popular GRACE products are NASA’s GRCTel-lus land gravity solutions (i.e. spherical harmonics based CSR, JPL, and GFZ), which require scaling factors to re-cover spatially smoothed TWS signals (Swenson and Wahr, 2006; Landerer and Swenson, 2012). Additionally, NASA’s new monthly gridded GRACE product, Mass Concentra-tion blocks (i.e. Mascons), estimates terrestrial mass changes directly from inter-satellite acceleration measurements and can be used without further post-processing (Rowlands et al., 2010; Watkins et al., 2015). GRGS GRACE products are also spherical harmonic-based, available at a 10-day time step, and can also be used directly since gravity fields are stabilized during the processing of GRACE satellite data (Lemoine et al., 2007; Bruinsma et al., 2010).
Restoration of the amplitude of GRCTellus TWS data, dampened by spatial Gaussian filtering with a large smooth-ing radius (e.g. 300–500 km), is commonly achieved ussmooth-ing scaling factors that derive from a priori models of freshwa-ter stores, usually a global-scale land-surface model or LSM (Long et al., 2015). However, signal-restoration methods are emerging that do not require hydrological models or LSMs (Vishwakarma et al., 2016). Substantial uncertainty never-theless persists in the magnitude of applied scaling factors (e.g.GRCTellus) and corrections (Long et al., 2015). Recent global-scale analyses have evaluated variability in the am-plitude of 1TWS in various GRACE products (Scanlon et al., 2016) and compared these with evidence from global hydrological and land-surface models (Long et al., 2017); these studies highlight well uncertainties in the amplitude of
1TWS, but are not reconciled to observations. In situ ob-servations provide a valuable and necessary constraint to the scaling of TWS signals over a particular study area, as no consistent basis for ground-truthing these factors exists.
The disaggregation of GRACE-derived 1TWS anoma-lies into individual water stores (Eq. 1) is commonly con-strained by the limited availability of observations of ter-restrial freshwater stores (i.e.1SWS, 1SMS,1GWS, and 1ISS). Indeed, a major source of uncertainty in the attri-bution of GRACE 1TWS derives from the continued re-liance on modelled1SMS derived from LSMs (i.e. CLM, NOAH, VIC, and MOSAIC) under the Global Land Data Assimilation System or GLDAS (Rodell et al., 2004) and remote-sensing products (Shamsudduha et al., 2012; Khandu et al., 2016). Further, analyses of GRACE-derived1GWS often assume1SWS is limited (Kim et al., 2009), yet stud-ies in the humid tropics and engineered systems challenge this assumption, showing that it can overestimate 1GWS (Shamsudduha et al., 2012; Longuevergne et al., 2013). Ro-bust estimates of1GWS from GRACE gravity signals have, to date, been developed in locations where1SWS is well constrained by in situ observations and groundwater is used intensively for irrigation so that1GWS comprises a signif-icant (>10 %) proportion of 1TWS (Leblanc et al., 2009; Famiglietti et al., 2011; Shamsudduha et al., 2012; Scan-lon et al., 2015). In sub-Saharan Africa, intensive ground-water withdrawals are restricted to a limited number of lo-cations (e.g. irrigation schemes, cities) and constrained by low-storage, low-transmissivity aquifers in the deeply weath-ered crystalline rocks that underlie ∼40 % of this region (MacDonald et al., 2012), including the Upper Nile Basin (Fig. 1). Consequently, the ability of low-resolution GRACE gravity signals to trace1GWS in these hard-rock environ-ments is unclear. A recent study (Nanteza et al., 2016) ap-plies NASA’s GRCTellus (CSR GRACE) data over large basin areas (>300 000 km2) of eastern Africa and argues that 1GWS can be estimated with sufficient reliability to characterize regional groundwater systems after accounting for 1SWS by satellite altimetry and1SMS data from the GLDAS LSM ensemble (Rodell et al., 2004).
com-Figure 1.Map of the study area encompassing the Lake Victoria Basin (LVB) and Lake Kyoga Basin (LKB), and location of the in situ monitoring stations. The Upper Nile Basin is marked by a rectangle (red) within the entire Nile River Basin shown as a shaded relief index map. Piezometric monitoring (red circles) and lake-level gauging (dark blue squares) stations are shown on the map.
Figure 2. Observed daily total dam releases (blue line) and the agreed curve (red line) at the outlet of Lake Victoria in Jinja from November 2007 to July 2009 (Owor et al., 2011).
bined with simulated1SMS by the GLDAS LSMs, we as-sess (1) the ability of current gridded GRACE products (i.e. GRCTellus, JPL-Mascons, and GRGS GRACE) to measure a well-constrained1TWS in the Upper Nile Basin from 2003 to 2012, focusing on the unintended experiment within the LVB from 2003 to 2006; and (2) the sensitivity of disaggre-gated GRACE 1TWS signals to trace 1GWS in a deeply weathered crystalline rock aquifer system underlying the Up-per Nile Basin.
2 The Upper Nile Basin 2.1 Hydroclimatology
The Upper Nile Basin, the headwater area of the ∼3 400 000 km2Nile Basin (Awange et al., 2014), includes both the LVB and LKB. Mean annual rainfall over the entire
basin varies from 650 to 2900 mm (TRMM monthly rain-fall; 2003–2012), with an average of 1300 mm and a standard deviation of 354 mm (Fig. 3). Mean annual gauged rainfall at different stations, Jinja, Bugondo, and Entebbe, measured 1195, 1004, and 1541 mm respectively (Owor et al., 2011). Rainfall over Lake Victoria is typically 25–30 % greater than that measured in the surrounding catchment (Fig. 3), which is partially explained by the nocturnal “lake breeze” effect (Yin and Nicholson, 1998; Nicholson et al., 2000; Owor et al., 2011).
Estimates of mean annual evaporation from the surface of Lake Victoria vary from 1260 mm (UNEP, 2013) to 1566 mm (Hoogeveen et al., 2015), whereas mean annual evapora-tion from the surface of Lake Kyoga is estimated to vary from 1205 mm (Brown and Sutcliffe, 2013) to 1660 mm (Hoogeveen et al., 2015). Evapotranspirative fluxes from the surrounding swamps in Lake Kyoga are estimated to be much higher and approximately 2230 mm yr−1 (Brown and Sut-cliffe, 2013).
[image:3.612.49.288.358.447.2]Figure 3.Mean annual rainfall for the period of 2003–2012 derived from TRMM satellite observations. Greater annual rainfall is ob-served over much of Lake Victoria and the north-eastern corner of the Lake Victoria Basin.
2.2 Lakes Victoria and Kyoga
Located between the 31◦390 and 34◦530E longitudes, and the 0◦200N and 3◦000S latitudes, Lake Victoria (Fig. 1) is located in Tanzania, Uganda, and Kenya, where each ac-counts for 51, 43, and 6 % of the lake surface area respec-tively (Kizza et al., 2012). Lake Victoria is relarespec-tively shallow, with a mean depth of∼40 m and a maximum depth of 84 m (UNEP, 2013) akin to many shallow, open surface-water bod-ies as well as permanent and seasonal wetlands occupying low-relief plateaus across the Great Lakes Region of Africa (Owor et al., 2011). Moreover, the western and north-western lake bathymetry is characterized by even shallower depths of between 4 and 7 m (Owor, 2010). Hydrologically, lake input is dominated by direct rainfall (84 % of total input); the remainder derives primarily from river inflows as direct groundwater inflow (<1 %) is negligible (Owor et al., 2011). Approximately 25 major rivers flow into Lake Victoria, with a total catchment area of ∼194 000 km2; the largest tribu-tary, the Kagera River, contributes ∼30 % of total river in-flows (Sene and Plinston, 1994). Lake Victoria outflow to Lake Kyoga occurs at Jinja (Fig. 1).
Lake Kyoga (Fig. 1), located between the 32◦100 and 34◦200E longitudes and the 1◦000and 2◦000N latitudes, has a mean area of 1720 km2 with an estimated mean volume of 12 km3(Owor, 2010; UNEP, 2013). According to the re-cent globalHydroSHEDS(Hydrological data and maps based on shuttle elevation derivatives at multiple scales) database, Lake Kyoga has a total surface area of 2729 km2 (Lehner
Figure 4. Seasonal pattern (monthly mean from January 2003 to December 2012) of TRMM-derived monthly rainfall, various GRACE-derived 1TWS signals (GRCTellus: ensemble mean of CSR, JPL, and GFZ; GRGS and JPL-Mascons (MSCN) products), the bottom-up TWS, GLDAS LSM ensemble mean1SMS, in situ 1SWS, and a borehole-derived estimate of1GWS over the Lake Victoria Basin.
et al., 2008). Lake Kyoga comprises lake-zone and through-flow conduit areas. The lake zone in Lake Kyoga is very shallow, with a mean depth of 3.5–4.5 m (Owor, 2010). Lake Kyoga has a through-flow channel (mean depth 7–9 m) where the main Victoria Nile River flows (Owor, 2010) and acts as a linear reservoir with the annual water balance predominantly governed by the discharge of the Victoria Nile from Lake Victoria. Whilst numerous rivers flow into Lake Kyoga (e.g. rivers Mpologoma, Awoja, Omunyal, Abalang, Olweny, Sez-ibwa, and Enget), the majority contributes a fraction of their former volume upon reaching the lake (Krishnamurthy and Ibrahim, 1973) due, in part, to evapotranspirative losses from fringe swamp areas (4510 km2) surrounding the lake (UNEP, 2013).
2.3 Hydrogeological setting
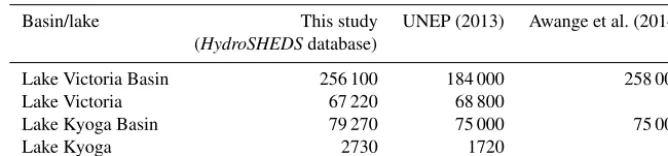
[image:4.612.309.545.68.255.2]Table 1.Estimated areal extent (km2) of the Lake Victoria Basin (LVB), the Lake Kyoga Basin (LKB), Lake Victoria, and Lake Kyoga.
Basin/lake This study UNEP (2013) Awange et al. (2014) (HydroSHEDSdatabase)
Lake Victoria Basin 256 100 184 000 258 000
Lake Victoria 67 220 68 800 –
Lake Kyoga Basin 79 270 75 000 75 000
Lake Kyoga 2730 1720 –
but generally low (0.5–20 m3h−1), yet are of critical impor-tance to the provision of safe drinking water.
2.4 An observed reduction in TWS in the LVB
In 1954, the construction of the Nalubaale Dam (formerly Owen Falls Dam) at the outlet of Lake Victoria at Jinja trans-formed the lake into a controlled reservoir (Sene and Plin-ston, 1994). Operated as a run-of-river hydroelectric project to mimic pre-dam outflows, the “agreed curve” between Uganda and Egypt dictated dam releases that were controlled on a 10-day basis and generally adhered to, with compen-satory discharge releases to minimize any departures, until the construction of the Kiira Dam at Jinja in 2002 (Sene and Plinston, 1994; Owor et al., 2011).
The combined discharge of the Nalubaale and Kiira dams enabled total dam releases (Fig. 2) to substantially exceed the agreed curve (Sutcliffe and Petersen, 2007), and between May 2004 and February 2006 the lake level dropped by 1.2 m (equivalent1SWS loss of 81 km3) (Owor et al., 2011). Mean annual releases were 1387 m3s−1 (+162 % of the agreed curve) in 2004 and 1114 m3s−1 (+148 % of the agreed curve) in 2005. Sharp reductions in dam releases in 2006 helped to arrest and reverse the lake-level decline, with lake levels stabilizing by early 2007.
3 Data and methods 3.1 Datasets
We use publicly available time-series records of (1) GRACE TWS solutions from a number of data-processing strate-gies and dissemination centres including NASA’sGRCTellus land solutions (RL05 for CSR, GFZ, version DSTvSCS1409, RL05.1 for JPL; version DSTvSCS1411, and JPL-Mascons solution, version RL05M_1.MSCNv01) as well as the French National Centre for Space Studies (CNES) GRGS so-lution (version GRGS RL03-v1); (2) NASA’s Global Land Data Assimilation System (GLDAS) simulated soil mois-ture data from three global land-surface models (LSMs) (CLM, NOAH, VIC); and (3) monthly precipitation data from NASA’s Tropical Rainfall Measuring Mission (TRMM) satellite mission. We also employ in situ observations of lake levels and groundwater levels from a network of river gauges
and monitoring boreholes operated by the Ministry of Water and Environment in Entebbe (Uganda). Datasets are briefly described below.
3.1.1 Delineation of basin study areas
Delineation of the LVB and LKB was conducted in a geographic information system (GIS) environment under an ArcGIS (v.10.3.1) environment using the Hydrological Basins in Africa datasets derived from the HydroSHEDS database (available at http://www.hydrosheds.org/) (Lehner et al., 2006, 2008). Regional water bodies, including lakes Victoria and Kyoga (Fig. 1), were spatially defined by the In-land Water dataset available globally at country scale from DIVA-GIS (http://www.diva-gis.org/). Computed areas of the basins and lake surface areas are summarized in Table 1 along with previously estimated figures from other studies. 3.1.2 GRACE-derived terrestrial water storage (TWS) Twin GRACE satellites provide monthly gravity variations interpretable as1TWS (Tapley et al., 2004) with an accu-racy of∼1.5 cm (equivalent water thickness or depth) when spatially averaged (Wahr et al., 2006). In this study, we ap-ply five different monthly GRACE solutions for the period of January 2003 to December 2012: post-processed, grid-ded (1◦×1◦) GRACE-TWS time-series records from three GRCTellus land solutions from CSR, JPL, and GFZ pro-cessing centres (available at http://grace.jpl.nasa.gov/data) (Swenson and Wahr, 2006; Landerer and Swenson, 2012), JPL-Mascons (Watkins et al., 2015; Wiese et al., 2015), and GRGS GRACE products (CNES/GRGS release RL03-v1) (Biancale et al., 2006).
the European Centre for Medium-Range Weather Forecasts (ECMWF) model; (ii) a glacial isostatic adjustment (GIA) correction based on a viscoelastic 3-D model of the Earth (A et al., 2013); and (iii) an application of a destriping filter plus a 300 km Gaussian to minimize the effect of correlated er-rors (i.e. destriping) manifested by N–S elongated stripes on GRACE monthly maps. However, the use of a large spatial filter and truncation of spherical harmonics leads to energy removal, so scaling coefficients or factors are applied to the GRCTellusGRACE-derived TWS data in order to restore at-tenuated signals (Landerer and Swenson, 2012). Dimension-less scaling factors are provided as 1◦×1◦bins (see Fig. S1 in the Supplement) that are derived from the Community Land Model (CLM4.0) (Landerer and Swenson, 2012).
JPL-Mascons (version RL05M_1.MSCNv01) data pro-cessing also involves a glacial isostatic adjustment (GIA) correction based on a viscoelastic 3-D model of the Earth (A et al., 2013). JPL-Mascons applies no spatial filtering as JPL-RL05M directly relates inter-satellite range-rate data to mass concentration blocks or Mascons to estimate global monthly gravity fields in terms of equal area 3◦×3◦ mass concentration functions to minimize measurement errors. The use of Mascons and the special processing result in bet-ter signal-to-noise ratios of the Mascon fields compared to the conventional spherical harmonic solutions (Watkins et al., 2015). For convenience, gridded Mascon fields are pro-vided at a spatial sampling of 0.5◦in both latitude and longi-tude (∼56 km at the Equator). As withGRCTellusGRACE datasets, the neighbouring grid cells are not “independent” of each other and cannot be interpreted individually at the 1◦ or 0.5◦grid scale (Watkins et al., 2015). Similar to GRCTel-lusGRACE (CSR, JPL, GFZ) products, dimensionless scal-ing factors are provided as 0.5◦×0.5◦bins (see Fig. S2) that are also derived from the Community Land Model (CLM4.0) (Wiese et al., 2016). The gain factors or scaling coefficients are multiplicative factors that minimize the difference be-tween the smoothed and unfiltered monthly 1TWS varia-tions from “actual” land hydrology at a given geographical location (Wiese et al., 2016).
GRGS/CNES GRACE monthly products (version RL03-v1) are processed and made publicly available (http://grgs. obs-mip.fr/grace) by the French Government space agency, National Centre for Space Studies or Centre National d’ Études Spatiales (CNES). The post-processing of GRGS data involves taking into account of gravitational variations such as Earth tides, ocean tides, and 3-D gravitational potential of the atmosphere and ocean masses (Bruinsma et al., 2010). The remaining signals for time-varying gravity fields there-fore represent changes in terrestrial hydrology including snow cover, baroclinic oceanic signals and effects of post-glacial rebound (Biancale et al., 2006; Lemoine et al., 2007). Further details on the Earth’s mean gravity-field models can be found on the official website of GRGS/LAGEOS (http: //grgs.obs-mip.fr/grace/).
GRACE satellites were launched in 2002 to map the varia-tions in Earth’s gravity field over its 5-year lifetime, but both satellites are still in operation even after more than 14 years. However, active battery management since 2011 has led the GRACE satellites to be switched off every 5–6 months for 4–5-week durations in order to extend its total lifespan (Ta-pley et al., 2015). As a result, GRACE 1TWS time-series data have some missing records that are linearly interpolated (Shamsudduha et al., 2012). In this study, we derive1TWS time-series data as equivalent water depth (cm of H2O) using the basin boundaries (GIS shapefiles) for masking the 1◦×1◦ grids.
3.1.3 Rainfall data
We apply the Tropical Rainfall Measuring Mission (TRMM) (Huffman et al., 2007) monthly product (3B43 version 7) for the period of January 2003 to December 2012 at 0.25◦× 0.25◦spatial resolution and aggregate to 1◦×1◦grids over the LVB and LKB. The general climatology of the Up-per Nile Basin is represented by a long-term (2003–2012) mean annual rainfall (Fig. 3) and seasonal rainfall pat-tern (Fig. 4). TRMM rainfall measurements show a good agreement with limited observational precipitation records (Awange et al., 2008, 2014).
3.1.4 Soil moisture storage (SMS)
NASA’s Global Land Data Assimilation System (GLDAS) is an uncoupled land-surface modelling system that drives multiple land surface models (GLDAS LSMs: CLM, NOAH, VIC and MOSAIC) globally at high spatial and temporal res-olutions (3-hourly to monthly at 0.25◦×0.25◦grid resolu-tion) and produces model results in near-real time (Rodell et al., 2004). These LSMs provide a number of output variables which include soil moisture storage (SMS). Similar to the approach applied in the analysis of GRACE-derived1TWS analysis in the Bengal Basin (Shamsudduha et al., 2012), we apply simulated monthly1SMS records at a spatial resolu-tion of 1◦×1◦ from three GLDAS LSMs: the Community Land Model (CLM, version 2) (Dai et al., 2003), NOAH (ver-sion 2.7.1) (Ek et al., 2003) and the Variable Infiltration Ca-pacity (VIC) model (version 2.7.1) (Liang et al., 2003). The respective depths of modelled soil profiles are 3.4, 2.0, and 1.9 m in CLM (10 vertical layers), NOAH (4 vertical lay-ers), and VIC (version 1.0) (3 vertical layers). Because of the absence of in situ soil moisture data in the study areas, we apply an ensemble mean of the aforementioned three LSMs-derived simulated 1SMS time-series records (see Figs. 5 and 6) in order to disaggregate GRACE1TWS signals in the LVB and LKB.
3.1.5 Surface water storage (SWS)
Figure 5.Monthly time-series datasets for the LVB from January 2003 to December 2012:(a)GRCTellusGRACE-derived1TWS (ensemble mean of CSR, GFZ, and JPL), GRGS and JPL-Mascons1TWS time-series data;(b)GLDAS-derived1SMS (individual signals as well as an ensemble mean of NOAH, CLM, and VIC);(c)lake-level-derived1SWS; and(d)borehole-derived1GWS time-series data. Note that monthly rainfall records derived from TRMM satellite are plotted on panel(d)where the dashed horizontal line represents the mean monthly rainfall for the period of January 2003 to December 2012.
and Bugondo for Lake Kyoga (Figs. 1 and 2) compiled by the Ugandan Ministry of Water and Environment (Directorate of Water Resources Management). Mean monthly anomalies for the period of January 2003–December 2012 were com-puted as an equivalent water depth using Eq. (2). Missing data in the time series (2003–2012) records are linearly inter-polated. For instance, in the case of monthly1SWS derived from Lake Kyoga water levels, there is one missing record (December 2005).
1SWS=1Lake level·
Lake area Total basin area
(2)
3.1.6 Groundwater storage (GWS) from borehole observations
Time series of1GWS are constructed from in situ piezomet-ric records from 6 monitoring wells located in the LVB and LKB where near-continuous, daily observations exist from January 2003 to December 2012 and have been compiled by the Ugandan Ministry of Water and Environment (Direc-torate of Water Resources Management) (Owor et al., 2009,
Figure 6.Monthly time-series datasets for the Lake Kyoga Basin (LKB) from January 2003 to December 2012:(a)GRCTellus GRACE-derived1TWS (ensemble mean of CSR, GFZ, and JPL), GRGS, and JPL-Mascons1TWS time-series data;(b)GLDAS-derived1SMS (individual signals as well as an ensemble mean of NOAH, CLM, and VIC);(c)lake-level-derived1SWS; and(d)borehole-derived1GWS time-series data. Note that monthly rainfall records derived from the TRMM satellite are plotted in panel(d)where the dashed horizontal line represents the mean monthly rainfall for the period of January 2003 to December 2012.
Table 2.Details of groundwater and lake-level monitoring stations located in the Lake Victoria Basin and Lake Kyoga Basin.
Monitoring station Basin Parameter Longitude Latitude Depth (m b.g.l.)
Apac LKB Groundwater level 32.50 1.99 15.0
Pallisa LKB Groundwater level 33.69 1.20 46.2
Soroti LKB Groundwater level 33.63 1.69 66.0
Bugondo LKB Lake level 33.20 0.45 –
Entebbe LVB Groundwater level 32.47 0.04 48.0
Rakai LVB Groundwater level 31.40 −0.69 53.0
Nkokonjeru LVB Groundwater level 32.91 0.24 30.0
Jinja LVB Lake level 33.23 1.59 –
and Nkokonjeru (as well as the three sites in the Lake Kyoga Basin), annual amplitudes are similar.
The groundwater-level time series data are a sub-set of the total number of available monitoring-well records in the LVB and LKB and selected on the basis of (i) the com-pleteness and quality of the records from 2003 to 2012, and (ii) rigorous review of groundwater-level records conducted at a dedicated workshop at the Ministry of Water & Envi-ronment in January 2013. These records represent shallow groundwater-level observations within the saprolite that is
dynamically connected to surface waters (Owor et al., 2011). Long time-series records of groundwater levels over the pe-riod from 2003 to 2012 from western Kenya, northern Tan-zania, Rwanda, and Burundi have not been identified despite intensive investigations carried out byThe Chronicles Con-sortium.1 The partial spatial coverage in quality-controlled piezometry, especially for the LVB, represents an important limitation in our analysis.
1The Chronicles Consortium: https://www.un-igrac.org/
[image:8.612.120.473.458.569.2]Mean monthly anomalies were translated into an equiv-alent water depth (Eq. 3) by applying a range of specific yield (Sy) values (1–6 % with an average of 3 %), although
estimates of Sy in hard-rock environments are observed to
vary from<2 to 8 % (Taylor et al., 2010, 2013; Vouillamoz et al., 2014) using Eq. (3). Missing data in the time series were linearly interpolated. In the case of monthly 1GWS that were derived from borehole (n=6) observations, miss-ing records range from 1 to 9 months (120 months in 2003– 2012), with three boreholes (Soroti, Rakai, and Nkonkon-jero) with time-series records ending in June–July 2010.
1GWS=1h·Sy·
Land area Total basin area
(3)
3.2 Methodologies
3.2.1 GRACE1TWS estimation
First, the 1◦×1◦ gridded monthly anomalies of GRACE-derived 1TWS and GLDAS LSM-derived 1SMS are masked over the area of the LVB and LKB. GRACE1TWS along with GLDAS 1SMS are extracted for the marked 1◦×1◦ grid cells for the LVB and LKB and the grid
val-ues are spatially aggregated to form time series of monthly anomalies1TWS and1SMS.
GRCTellus GRACE 1TWS gridded data are scaled us-ing dimensionless, gridded scalus-ing factors. Several GRACE studies (Rodell et al., 2009; Sun et al., 2010; Shamsudduha et al., 2012) have applied scaling factors in three different ways: (1) a single scaling factor based on regionally aver-aged time series, (2) spatially distributed or gridded scal-ing factors based on time series at each grid point, and (3) gridded-gain factors estimated as a function of time or of temporal frequency (Landerer and Swenson, 2012; Long et al., 2015). In this study, we apply a spatially distributed scal-ing approach (method 2 above) to generate basin-averaged 1TWS time-series records forGRCTellus(CSR, JPL, GFZ) products. Scaling factors provided at 1◦×1◦ grids are
ap-plied to each corresponding GRACE1TWS grid for NASA’s GRCTellus products in order to restore attenuated signals during the post-processing (Landerer and Swenson, 2012) using Eq. (4). Similarly, provided scaling factors are applied to JPL-Mascons 1TWS time-series data but at 0.5◦×0.5◦ grid resolution. No scaling factors were applied to GRGS GRACE 1TWS as the monthly gravity solutions have al-ready been stabilized during their generation process. g1(x, y, t )=g (x, y, t )·s (x, y) (4) Here,g1(x, y, t )represents each un-scaled grid wherex rep-resents longitude, y represents latitude, t represents time (month), ands(x, y)is the corresponding scaling factor.
For the threeGRCTellusgridded products (i.e. CSR, GFZ, and JPL solutions), we apply an ensemble mean of scaled GRACE 1TWS as our exploratory analyses reveal that
1TWS time-series records over the Lake Victoria Basin are highly correlated (r >0.95,pvalue<0.001) with each other. Additionally, a small (ranges from 1.3 to 1.9 cm) root mean square error (RMSE) among the GRACE1TWS datasets suggests substantial similarities in phase and ampli-tude.
3.2.2 Estimation of1GWS from GRACE
Estimation of groundwater storage changes (1GWS) from GRACE measurements is conducted using Eq. (5) in which 1TWSt is derived from gridded GRACE products (spatially
scaled1TWS forGRCTellusand JPL-Mascons but unscaled 1TWS for GRGS),1SMSt is an ensemble mean of three
GLDAS LSMs (CLM, NOAH, VIC), and1SWSt is
area-weighted, in situ surface water storage estimated from lake-level records using Eq. (2).
1GWSt=1TWSt−(1SWSt+1SMSt) (5)
3.2.3 Reconciliation of GRACE1TWS disaggregation Reconciling GRACE-derived TWS with ground-based ob-servations is limited by the paucity of in situ obob-servations of SMS, SWS, and GWS in many environments. In ad-dition, direct comparisons between in situ observations of 1SMS,1SWS, and 1GWS and gridded GRACE 1TWS anomalies are complicated by substantial differences in spa-tial scales, which need to be considered prior to analysis (Becker et al., 2010). For example, individual groundwater-level monitoring boreholes may represent, depending on borehole depth, a sensing area of several tens of square kilo-metres (Burgess et al., 2017), whereas the typical GRACE footprint is∼200 000 km2. The disaggregation of GRACE 1TWS into individual water stores can also propagate errors to disaggregated components. Here, we construct “in situ” or “bottom-up” 1TWS (i.e. combined signals of 1SMS, 1SWS, and1GWS) for the Lake Victoria Basin and attempt to reconcile with GRACE-derived1TWS. One feature of GRACE1TWS among the three solutions we apply in this study is the considerable variation in annual amplitudes that exist over the period of 2003–2012.
ob-served that, in the LVB,1SWS is the largest contributor, rep-resenting∼50 % variance in the in situ or bottom-up1TWS time-series signal. GRACE1TWS analyses commonly ap-ply the same scaling factor as1TWS to all other individual components (Landerer and Swenson, 2012). Therefore, un-der the scaling experiment, we apply to in situ1SWS spa-tially averaged scaling factors representative of (i) Lake Vic-toria and its surrounding grid cells (experiment 1:s=0.71; range 0.02–1.5), and (ii) the open-water surface of Lake Vic-toria without surrounding grid cells (experiment 2:s=0.11; range 0.02–0.30). Furthermore, we find that the amplitude of monthly anomalies of 1SWS+1SMS combined sub-stantially exceed 1TWS (see Fig. S4), particularly for the GRCTellus GRACE1TWS signal that is greatly smoothed due to filtering. This discrepancy is pronounced over the pe-riod of 2003–2006, and when applied to estimate GRACE-derived 1GWS, produces steep, rising trends in the esti-mated 1GWS (i.e. GRACE 1TWS−(1SWS+1SMS)), whereas borehole observations of groundwater levels show a declining trend and are of much a lower amplitude over the same period.
4 Results
Monthly time-series records (January 2003–December 2012) are presented in Figs. 5 and 6 respectively for the LVB and LKB of (a) GRACE 1TWS fromGRCTellus GRACE 1TWS (ensemble mean of CSR, GFZ, and JPL solutions), GRGS and JPL-Mascons, (b) GLDAS land-surface mod-els (LSMs) derived1SMS (ensemble mean of three LSMs: NOAH, CLM, VIC), (c) in situ 1SWS from lake lev-els records, and (d) in situ 1GWS borehole observations. Monthly rainfall derived from TRMM satellite observations over the same period are shown on the bottom panel (d). Time-series records of all 1TWS components and rainfall are aggregated for the LVB to represent the average seasonal (monthly) pattern of each signal (Fig. 4) that shows an ob-vious lag (∼1 month) between peak rainfall (March–April) and1TWS and its individual components.
Mean annual (2003–2012) amplitudes of various GRACE-derived 1TWS signals, bottom-up1TWS, ensemble mean of simulated1SMS, in situ1SWS, and1GWS time-series records (Figs. 5 and 6) are presented (see Table S1 in the Sup-plement) for both the LVB and LKB. The mean annual am-plitude of GRACE1TWS ranges from 11 to 21 cm among GRCTellus, GRGS, and JPL-Mascons GRACE products in the LVB, and from 8.4 to 16.4 respectively in the LKB. The mean annual amplitude of in situ 1SWS is much greater (14.8 cm) in the LVB than in the LKB (3.8 cm). The GLDAS LSM-derived ensemble mean1SMS amplitude in the LVB is 7.9 and 7.3 cm in the LKB. The standard deviation in1SMS varies substantially in the LVB (1.2, 4.2, and 2.9 cm) and LKB (1.3, 4.7, and 4.0 cm) for the CLM, NOAH, and VIC
models respectively. The mean annual amplitude of in situ 1GWS ranges from 4.4 cm (LVB) to 3.5 cm (LKB).
Time-series correlation (Pearson) analysis over various periods of interests (decadal: 2003–2012; well-constrained SWS reduction or the period of the unintended experiment: 2003–2006; controlled dam operation: 2007–2012) reveals that GRACE-derived1TWS signals are strongly correlated in both the LVB and LKB (see Figs. S5–S10). For exam-ple, in the LVB, in situ1SWS shows a statistically signif-icant (p value<0.001) strong correlation (r=0.77–0.92) with all GRACE-1TWS time-series (2003–2012) records. Similarly, simulated 1SMS shows statistically significant (p value<0.001) strong correlation (r=0.70–0.78) with 1TWS time-series records. In contrast, in situ 1GWS shows statistically significant (p value<0.001) but mod-erate correlation (r=0.63–0.69) with 1TWS time-series records. Correlation among the variables shows similar sta-tistically significant (p value<0.001) but wide-ranging as-sociations for the periods of the unintended experiment (2003–2006) and controlled dam operation (2007–2012). In the LKB, however, correlation among in situ 1SWS and GRACE1TWS time-series records is statistically sig-nificant (p value<0.05) but poor in correlation strength (r=0.22–0.34). In situ 1GWS shows statistically signif-icant (p value<0.001) strong correlation (r=0.64–0.69) with GRACE1TWS time-series records.
Time-series records of all three1TWS from five GRACE products and bottom-up1TWS time-series records in both the LVB and LKB are shown in Fig. 7; results of tempo-ral trends are summarized in Table 3. Statistically significant (pvalue<0.05) declining trends (−4.1 to−11.0 cm yr−1in the LVB;−2.1 to−4.6 cm yr−1in the LKB) are consistently observed during the period of 2003–2006. Trends are all pos-itive in GRACE1TWS and bottom-up 1TWS time-series records over the recent period of controlled dam operation (2007–2012) in both the LVB and LKB. The overall, decadal (2003–2012) trends are slightly rising (0.04–1.00 cm yr−1) in the LVB but nearly stable (−0.01 cm yr−1) inGRCTellus 1TWS and slightly declining (−0.56 cm yr−1) in bottom-up1TWS over the LKB. In addition, short-term volumet-ric trends (2003–2006) in GRACE and bottom-up1TWS as well as simulated1SMS and in situ 1SWS are declining whereas in situ1GWS and rainfall anomalies show slightly rising trends over the same period in the LVB (see Figs. S11– S12). Similar trends are reported in various signals over the LKB, but magnitudes are much smaller compared to that of the LVB, which is 3 times larger in size than the LKB. Volumetric declines in 1TWS in the LVB for the period 2003–2006 are: 83 km3(bottom-up), 80 km3(JPL-Mascons), 69 km3(GRGS) and 31 km3(GRCTellusensemble mean of CSR, JPL and GFZ products).
Table 3.Linear trends (cm yr−1) in GRACE1TWS and bottom-up1TWS in the Lake Victoria Basin and Lake Kyoga Basin over various time periods (statistically significant trends;pvalues<0.05 are marked by an asterisk).
Period GRACE ensemble GRGS JPL-Mascons Bottom-up TWS
Lake Victoria Basin (LVB)
2003–2006 −4.10∗ −9.00∗ −10.0∗ −11.00∗
2007–2012 −0.31 1.50∗ 2.70∗ 1.10∗
2003–2012 0.04 0.58 1.00∗ 0.54
Lake Kyoga Basin (LKB)
2003–2006 −2.10∗ −4.60∗ −3.50∗ −2.80∗
2007–2012 0.22 2.00∗ 1.50∗ 0.48
2003–2012 −0.01 0.54∗ 0.54∗ −0.56∗
Figure 7.Comparison among time-series records of1TWS fromGRCTellus(ensemble mean of CSR, GFZ, and JPL), GRGS and JPL-Mascons GRACE products and bottom-up1TWS for the LVB(a), and the LKB(b)for the period of January 2003 to December 2012. The vertical grey lines represent monthly rainfall anomalies in the LVB and LKB.
natural variability in bottom-up1TWS in the LKB, though this may be explained by the fact that SWS in Lake Kyoga is influenced by dam releases from the LVB. Multiple lin-ear regression and the analysis of variance (ANOVA) re-veal that the relative proportion of variability in the bottom-up 1TWS time-series record can be explained by1SWS (92.6 %),1SMS (6.5 %), and1GWS (0.66 %) in the LVB; and by 47.9, 48.5, and 3.6 % respectively in the LKB. These results are indicative only as these percentages can be biased by the presence of strong correlation among variables and the order of these variables listed as predictors in the multi-ple linear regression models.
Disaggregation of 1GWS from GRACE 1TWS time-series record from each product has been carefully con-sidered and estimated following Eq. (5). No further ad-ditional scaling factors, as described in the “scaling ex-periment” section (see results of scaling experiment in
Figure 8.Estimates of in situ1GWS and GRACE-derived1GWS time-series records (January 2003 to December 2012) in the LVB show substantial variations among themselves. An ensemble mean1SMS (three GLDAS LSMs: CLM, NOAH, and VIC) and an unscaled1SWS are applied in the disaggregation of 1GWS using theGRCTellusGRACE (ensemble mean of CSR, GFZ, and JPL) and JPL-Mascons products.
Figure 9. Taylor diagram shows strength of statistical associa-tion, variability in amplitudes of time-series records and agree-ment among the reference data, bottom-up1TWS andGRCTellus GRACE-derived1TWS (ensemble mean of CSR, GFZ, and JPL, GRGS and JPL-Mascons 1TWS time-series records), simulated 1SMS (ensemble mean of NOAH, CLM and VIC), in situ1SWS, and in situ1GWS over the LVB. The solid arcs around the refer-ence point (black square) indicate centred root mean square (RMS) differences among bottom-up1TWS and other variables, and the dashed arcs from the origin of the diagram indicate variability in time-series records. Data for the LVB are only shown in this dia-gram.
3.2 cm (GRACE ensemble), 5.3 cm (GRGS) to 5.4 cm (JPL-Mascons) in the LKB.
5 Discussion
We apply five different gridded GRACE products (GRCTel-lus– CSR, JPL, and GFZ; GRGS and JPL-Mascons) to test 1TWS signals for the Lake Victoria Basin (LVB) compris-ing a large and accurately observed reduction (83 km3) in 1TWS from 2003 to 2006. Our analysis reveals that all GRACE products capture this substantial reduction in ter-restrial water mass, but the magnitude of GRACE 1TWS among GRACE products varies substantially. For exam-ple,GRCTellusunderrepresents greatly (63 %) the reduction of 83 km3 in bottom-up1TWS, whereas GRGS and JPL-Mascons GRACE products underrepresent this by 17 and 4 % respectively. Previous studies in the Upper Nile Basin have relied upon a single GRACE product such as GRCTel-lus CSR (Nanteza et al., 2016) and GFZ (version (RL04) (Awange et al., 2014) without considering uncertainty in the seasonal amplitude of TWS associated with the processing of different GRACE products. Over a longer period (2003– 2012) in the Upper Nile Basin, all GRACE products correlate well with bottom-up1TWS but, similar to the unintended experiment, variability in amplitude is considerable (Fig. 9). The average (2003–2012) annual amplitude of1TWS is sub-stantially dampened (i.e. 45 % less than bottom-up1TWS) inGRCTellusGRACE products relative to GRGS (4 %) and JPL-Mascons (27 % more than bottom-up1TWS) products in the LVB.
[image:12.612.50.286.278.470.2]Scaling experiments conducted here reveal that GRCTellus 1TWS requires an additional multiplicative factor of 1.7 in order to match bottom-up 1TWS with a minimum RMSE (5.8 cm). On the other hand, NASA’s new gridded GRACE product, JPL-Mascons, which applies an a priori constraint in space and time to derive monthly gravity fields and under-goes some degree of spatial smoothing (Watkins et al., 2015), represents nearly 83 % variability in bottom-up 1TWS. In contrast, the GRGS GRACE product, which applies trunca-tion at degree 80 (∼250 km), does not suffer from any large-scale spatial smoothing, and is able to represent well (90 %) the variability in bottom-up1TWS in the LVB.
A priori corrections of GRCTellus ensemble mean GRACE signals using a set of LSM-derived scaling factors (i.e. amplitude gain) can lead to substantial uncertainty in 1TWS (Long et al., 2015). We show that the amplitude of simulated terrestrial water mass over the Upper Nile Basin varies substantially among various LSMs (see Fig. S15). Most of these LSMs (GLDAS models: CLM, NOAH, VIC) do not include surface water or groundwater storage (Scanlon et al., 2012). Although CLM (v.4.0 and 4.5) includes a simple representation (i.e. shallow unconfined aquifer) of ground-water (Niu et al., 2007; Oleson et al., 2008), it does not con-sider recharge from irrigation return flows. In addition, many of these LSMs do not consider lakes and reservoirs and, most critically, LSMs are not reconciled with in situ observations. The combined measurement and leakage errors,√(bias2+ leak2) (Swenson and Wahr, 2006) for GRCTellus 1TWS based on CLM4.0 model for the LVB and LKB are 7.2 and 6.6 cm respectively. These values, however, do not represent mass leakage from the lake to the surrounding area within the basin itself. A sensitivity analysis ofGRCTellusand GRGS signals reveal that signal leakage occurs from lake to its sur-rounding basin area as well as between basins. For instance, GRACE signal leakage into the LKB from the LVB, which is 3 times larger in area than the LKB, is 3.4 times bigger for both GRCTellus GRACE and GRGS products. Further-more, the analysis shows that leakage from Lake Victoria to the LVB forGRCTellusis substantially greater than GRGS product by a factor of∼2.6. In other words, 1 mm change in the level of Lake Victoria represents an equivalent change of 0.12 mm in 1TWS in the LVB forGRCTelluscompared to 0.32 mm for GRGS. Consequently, changes in the amplitude of GRGS 1TWS are much greater (∼38 %) than GRCTel-lus.During the observed reduction in1TWS (83 km3) from 2003 to 2006, the computed volumetric reduction for GRGS is found to be 69 km3whereas it is 31 km3forGRCTellus.
Another source of uncertainty that contributes toward 1TWS anomalies in GRACE analysis is the choice of sim-ulated1SMS from various global-scale LSMs (e.g. Sham-sudduha et al., 2012; Scanlon et al., 2015). For example, the mean annual (2003–2012) amplitudes in simulated 1SMS in GLDAS LSMs (CLM, NOAH, VIC) vary substantially in the LVB (3.5, 10.2, and 10.5 cm) and LKB (3.7, 10.6, and 7.7 cm) respectively. Due to an absence of a dedicated
moni-toring network for soil moisture in the Upper Nile Basin, this study, like many other GRACE studies, is resigned to apply-ing simulated1SMS from multiple LSMs, arguing that the use of an ensemble mean minimizes the error associated with 1SMS (Rodell et al., 2009).
Computed contributions of1GWS to1TWS in the Up-per Nile Basin are low (<10 %). GRACE-derived estimates of1GWS from all three products (GRCTellus, GRGS, and JPL-Mascons) correlate very weakly with in situ 1GWS in both the LVB and LKB. One curious observation in the LVB during the unintended experiment (2003–2006) is that in situ 1GWS rises, whereas in situ 1SWS and simu-lated1SMS decline. The available evidence in groundwater-level records (e.g. Entebbe, Uganda) suggests that rainfall-generated groundwater recharge led to an increase in1GWS, while dam releases exceeding the agreed curve continued to reduce1SWS (Owor et al., 2011).
Uncertainties in the estimation of GRACE-derived1GWS remain in (i) accurate representation of the largest individ-ual signal of in situ1SWS in the disaggregation of GRACE 1TWS signals as it can limit the propagation of uncertainty in simulated1SMS, (ii) simulated1SMS by GLDAS land-surface models, (iii) the very limited spatial coverage in piezometry to represent in situ1GWS, and (iv) appliedSy
6 Conclusions
The analysis of a large, accurately recorded reduction of 1.2 m in the water level of Lake Victoria, equivalent to a 1SWS decline of 81 km3 from 2004 to 2006, exposes substantial variability among five commonly used gridded GRACE products (GRCTellusCSR, JPL, GFZ; GRGS; JPL-Mascons) to quantify the amplitude of changes in terrestrial water storage (1TWS). Around this event, we estimate an overall decline in “in situ” or “bottom-up” 1TWS (i.e. in situ1SWS and1GWS; simulated1SMS) over the LVB of 83 km3from 2003 to 2006. This value compares favourably with JPL-Mascons GRACE1TWS (80 km3), is underrepre-sented by GRGS GRACE1TWS (69 km3), and is substan-tially underrepresented by the ensemble mean of GRCTel-lus GRACE 1TWS (31 km3). Attempts to better reconcile GRCTellus GRACE 1TWS to bottom-up 1TWS through scaling techniques are unable to represent adequately the ob-served amplitude in1TWS but highlight the uncertainty in the amplitude of gridded GRACE1TWS datasets generated by various processing strategies.
From 2003 to 2012, GRGS, JPL-Mascons, andGRCTellus GRACE products trace well the phase in bottom-up1TWS in the Upper Nile Basin that comprises both the LVB and the LKB. In the LVB, for example, each explains 90 % (GRGS), 83 % (JPL-Mascons), and 75 % (GRCTellus ensem-ble mean of CSR, JPL, and GFZ) of the variance respec-tively in bottom-up1TWS. The relative proportion of vari-ability in bottom-up1TWS (variance 120 cm2LVB, 24 cm2 LKB) is explained by in situ1SWS (93 % LVB; 49 % LKB), GLDAS ensemble mean1SMS (6 % LVB; 48 % LKB), and in situ 1GWS (∼1 % LVB; 4 % LKB); these percentages are indicative and can vary as individual TWS components are strongly correlated and the order of explanatory vari-ables in the regression equation can affect the analysis of variance (ANOVA). In situ 1GWS contributes minimally to1TWS and is only moderately associated with GRACE 1TWS (strongest correlation ofr=0.39,pvalue<0.001). The resolution of 1GWS from GRACE1TWS in the Up-per Nile Basin relies upon robust measures of 1SWS and 1SMS; the former is observed in situ, whereas the latter is limited by uncertainty in simulated 1SMS, represented here and in many GRACE studies by an ensemble mean of GLDAS LSMs. Mean annual amplitudes in observed1GWS (2003–2012) from limited piezometry for the low-storage and low-transmissivity aquifers in deeply weathered crys-talline rocks that underlie the Upper Nile Basin are small (1.8–4.9 cm forSy=0.03) and, given the current uncertainty
in simulated1SMS, are beyond the limit of what can be re-liably quantified using current GRACE satellite products.
Our examination of a large, mass-storage change (2003– 2006) observed in the Lake Victoria Basin highlights sub-stantial variability in the measurement of1TWS using dif-ferent gridded GRACE products. Although the phase in 1TWS is generally well recorded by all tested GRACE
products, substantial differences exist in the amplitude of 1TWS that influence the disaggregation of individual ter-restrial stores (e.g. groundwater storage) and the estimation of temporal trends in TWS. Analyses that solely rely upon a single solution disregard the uncertainty in1TWS associ-ated with GRACE signal processing. We note, for example, that the stronger filtering of the large-scale (∼300 km) grav-ity signal associated withGRCTellus results in greater sig-nal leakage relative to GRGS and JPL-Mascons. As a result, greater rescaling is required to resurrect signal amplitudes inGRCTellusrelative to GRGS and JPL-Mascons and these scaling factors depend upon uncertain and incomplete a pri-ori knowledge of terrestrial water stores derived from large-scale land-surface or hydrological models, which generally do not consider the existence of Lake Victoria, the second largest lake by area in the world.
Data availability. Descriptive statistics of various GRACE TWS signals and statistical associations with soil moisture derived from GLDAS land-surface models, observed surface water, and ground-water storage changes estimated over the Lake Victoria and Lake Kyoga basins are provided in the Supplement.
The Supplement related to this article is available online at https://doi.org/10.5194/hess-21-4533-2017-supplement.
Author contributions. RT conceived this study for which prelimi-nary analyses were carried out by DJ and MS. MS and DJ have pro-cessed GRACE and all observational datasets and conducted statis-tical analyses and GIS mapping. LL conducted the analysis of spa-tial leakage and bias in GRACE signals. CT, RT and MO helped to establish, collate and analyse groundwater-level data; CT provided dam release data. MS and RT wrote the manuscript and LL, DJ, MO and CT commented on draft manuscripts.
Competing interests. The authors declare that they have no conflict of interest.
Acknowledgements. We kindly acknowledge NASA’s MEaSUREs
Program (http://grace.jpl.nasa.gov) for the freely available gridded
GRCTellusand JPL-MASCON GRACE data and French National
Development (DFID) through the GroFutures: Groundwater Futures in Sub-Saharan Africacatalyst (NE/L002043/1) and con-sortium (NE/M008932/1) grant awards, is gratefully acknowledged.
Edited by: Ying Fan
Reviewed by: two anonymous referees
References
A, G., Wahr, J., and Zhong, S.: Computations of the vis-coelastic response of a 3-D compressible Earth to sur-face loading: an application to Glacial Isostatic Adjustment in Antarctica and Canada, Geophys. J. Int., 192, 557–572, https://doi.org/10.1093/gji/ggs030, 2013.
Arendt, A. A., Luthcke, S. B., Gardner, A. S., O’Neel, S., Hill, D., Moholdt, G., and Abdalati, W.: Analysis of a GRACE global mascon solution for Gulf of Alaska glaciers, J. Glaciol., 59, 913– 924, 2013.
Awange, J. L., Sharifi, M. A., Ogonda, G., Wickert, J., Grafarend, E., and Omulo, M.: The falling Lake Victoria water levels: GRACE, TRIMM and CHAMP satellite analysis of the lake basin, Water Resour. Manag., 22, 775–796, 2008.
Awange, J. L., Anyah, R., Agola, N., Forootan, E., and Omondi, P.: Potential impacts of climate and environmental change on the stored water of Lake Victoria Basin and economic implications, Water Resour. Res., 49, 8160–8173, 2013.
Awange, J. L., Forootan, E., Kuhn, M., Kusche, J., and Heck, B.: Water storage changes and climate variability within the Nile Basin between 2002 and 2011, Adv. Water Resour., 73, 1–15, 2014.
Basalirwa, C. P. K.: Delineation of Uganda into climatological rain-fall zones using the method of Principle Component Analysis, Int. J. Climatol., 15, 1161–1177, 1995.
Becker, M., Llovel, W., Cazenave, A., Güntner, A., and Crétaux, J.-F.: Recent hydrological behaviour of the East African great lakes region inferred from GRACE, satellite altimetry and rainfall ob-servations, C. R. Geosci., 342, 223–233, 2010.
Biancale, R., Lemoine, J.-M., Balmino, G., Loyer, S., Bruisma, S., Perosanz, F., Marty, J.-C., and Gégout, P.: 3 Years of Geoid Vari-ations from GRACE and LAGEOS Data at 10-day Intervals from July 2002 to March 2005, CNES/GRGS, 2006.
Brown, E. and Sutcliffe, J. V.: The water balance of Lake Kyoga, Uganda, Hydrolog. Sci. J., 58, 342–353, https://doi.org/10.1080/02626667.2012.753148, 2013.
Bruinsma, S., Lemoine, J.-M., and Biancale, R.: CNES/GRGS 10-day gravity field models (release 2) and their evaluation Adv. Space Res., 45, 587–601, https://doi.org/10.1016/j.asr.2009.10.012, 2010.
Burgess, W. G., Shamsudduha, M., Taylor, R. G., Zahid, A., Ahmed, K. M., Mukherjee, A., Lapworth, D. J., and Bense, V. F.: Terres-trial water load and groundwater fluctuation in the Bengal Basin, Scientific Reports, 7, 3872, https://doi.org/10.1038/s41598-017-04159-w, 2017.
Castellazzi, P., Martel, R., Galloway, D. L., Longuevergne, L., and Rivera, A.: Assessing Groundwater Depletion and Dynamics Us-ing GRACE and InSAR: Potential and Limitations, Ground Wa-ter, 54, 768–780, https://doi.org/10.1111/gwat.12453, 2016.
Chen, J. L., Wilson, C. R., and Tapley, B. D.: The 2009 excep-tional Amazon flood and interannual terrestrial water storage change observed by GRACE, Water Resour. Res., 46, W12526, https://doi.org/10.1029/2010WR009383, 2010.
Dai, Y., Zeng, X., Dickinson, R. E., Baker, I., Bonan, G. B., Bosilovich, M. G., Denning, A. S., Dirmeyer, P. A., Houser, P. R., Niu, G., Oleson, K. W., Schlosser, C. A., and Yang, Z.-L.: The common land model (CLM), B. Am. Meteorol. Soc., 84, 1013–1023, 2003.
Ek, M. B., Mitchell, K. E., Lin, Y., Rogers, E., Grunmann, P., Ko-ren, V., Gayno, G., and Tarpley, J. D.: Implementation of Noah land surface model advances in the National Centers for Environ-mental Prediction operational mesoscale Eta model, J. Geophys. Res., 108, 8851, https://doi.org/10.1029/2002JD003296, 2003. Famiglietti, J. S., Lo, M., Ho, S. L., Bethune, J., Anderson, K.
J., Syed, T. H., Swenson, S. C., de Linage, C. R., and Rodell, M.: Satellites measure recent rates of groundwater depletion in California’s Central Valley, Geophys. Res. Lett., 38, L03403, https://doi.org/10.1029/2010GL046442, 2011.
Frappart, F., Ramillien, G., and Famiglietti, J. S.: Water balance of the Arctic drainage system using GRACE gravimetry products, Int. J. Remote Sens., 32, 431–453, https://doi.org/10.1080/01431160903474954, 2011.
Güntner, A.: Improvement of Global Hydrological Models Using GRACE Data, Surv. Geophys., 29, 375–397, 2008.
Hoogeveen, J., Faurès, J.-M., Peiser, L., Burke, J., and van de Giesen, N.: GlobWat – a global water balance model to assess water use in irrigated agriculture, Hydrol. Earth Syst. Sci., 19, 3829–3844, https://doi.org/10.5194/hess-19-3829-2015, 2015. Hu, L. and Jiao, J. J.: Calibration of a large-scale groundwater flow
model using GRACE data: a case study in the Qaidam Basin, China, Hydrogeol. J., 23, 1305–1317, 2015.
Huffman, G. J., Adler, R. F., Bolvin, D. T., Gu, G., Nelkin, E. J., Bowman, K. P., Hong, Y., Stocker, E. F., and Wolff, D. B.: The TRMM satellite precipitation analysis: quasi-global, multi-year, combined-sensor precipitation estimates at fine scale, J. Hy-drometeorol., 8, 38–55, 2007.
Humphrey, V., Gudmundsson, L., and Seneviratne, S. I.: Assess-ing Global Water Storage Variability from GRACE: Trends, Sea-sonal Cycle, SubseaSea-sonal Anomalies and Extremes, Surv. Geo-phys., 37, 357–395, https://doi.org/10.1007/s10712-016-9367-1, 2016.
Indeje, M., Semazzi, F. H. M., and Ogallo, L. J.: ENSO signals in East African rainfall seasons, Int. J. Climatol., 20, 19–46, 2000. Jacob, T., Wahr, J., Pfeffer, W. T., and Swenson, S.: Recent
con-tributions of glaciers and ice caps to sea level rise, Nature, 482, 514–518, 2012.
Jiang, D., Wang, J., Huang, Y., Zhou, K., Ding, X., and Fu, J.: The Review of GRACE Data Applications in Terrestrial Hy-drology Monitoring, Advances in Meteorology, 2014, 725131, https://doi.org/10.1155/2014/725131, 2014.
Khandu, Forootan, E., Schumacher, M., Awange, J. L., and Schmied, H. M.: Exploring the influence of pre-cipitation extremes and humanwater use on total wa-ter storage (TWS)changes in the Ganges-Brahmaputra-Meghna River Basin, Water Resour. Res., 52, 2240–2258, https://doi.org/10.1002/2015WR018113, 2016.
stor-age over global basins, Geophys. Res. Lett., 36, L17402, https://doi.org/10.1029/2009GL039006, 2009.
Kizza, M., Westerberg, I., Rodhe, A., and Ntale, H.: Estimating areal rainfall over Lake Victoria and its basin using ground-based and satellite data, J. Hydrol., 464–465, 401–411, 2012.
Krishnamurthy, K. V. and Ibrahim, A. M.: Hydrometeorological Studies of Lakes Victoria, Kyoga, and Albert, in: Man-made Lakes: Their Problems and Environmental Effects, edited by: Ackermann, W. C., White, G. F., Worthington, E. B., and Ivens, J. L., American Geophysical Union, Washington D.C., 272–277, 1973.
Kusche, J., Eicker, A., Forootan, E., Springer, A., and Longuev-ergne, L.: Mapping probabilities of extreme continental water storage changes from space gravimetry, Geophys. Res. Lett., 43, 8026–8034, https://doi.org/10.1002/2016GL069538, 2016. Landerer, F. W. and Swenson, S. C.: Accuracy of scaled GRACE
terrestrial water storage estimates, Water Resour. Res., 48, W04531, https://doi.org/10.1029/2011WR011453, 2012. Leblanc, M. J., Tregoning, P., Ramillien, G., Tweed, S. O., and
Fakes, A.: Basin-scale, integrated observations of the early 21st century multiyear drought in southeast Australia, Water Resour. Res., 45, W04408, https://doi.org/10.1029/2008WR007333, 2009.
Lehner, B., Verdin, K., and Jarvis, A.: HydroSHEDS technical doc-umentation, World Wildlife Fund, Washington D.C., 2006. Lehner, B., Verdin, K., and Jarvis, A.: New global hydrography
de-rived from spaceborne elevation data, Eos T. Am. Geophys. Un., 89, 93–94, 2008.
Lemoine, J.-M., Bruisma, S., Loyer, S., Biancale, R., Marty, J.-C., Perosanz, F., and Balmino, G.: Temporal gravity field models inferred from GRACE data, Adv. Space Res., 39, 1620–1629, https://doi.org/10.1016/j.asr.2007.03.062, 2007.
Liang, X., Xie, Z., and Huang, M.: A new parameteriza-tion for surface and groundwater interacparameteriza-tions and its im-pact on water budgets with the variable infiltration capac-ity (VIC) land surface model, J. Geophys. Res., 108, 8613, https://doi.org/10.1029/2002JD003090, 2003.
Long, D., Longuevergne, L., and Scanlon, B. R.: Global anal-ysis of approaches for deriving total waterstorage changes from GRACE satellites, Water Resour. Res., 51, 2574–2594, https://doi.org/10.1002/2014WR016853, 2015.
Long, D., Chen, X., Scanlon, B. R., Wada, Y., Hong, Y., Singh, V. P., Chen, Y., Wang, C., Han, Z., and Yang, W.: Have GRACE satellites overestimated groundwater depletion in the Northwest India Aquifer?, Nature Scientific Reports, 6, 24398, https://doi.org/10.1038/srep24398, 2016.
Long, D., Pan, Y., Zhou, J., Chen, Y., Hou, X., Hong, Y., Scanlon, B. R., and Longuevergne, L.: Global analysis of spatiotemporal variability in merged total water storage changes using multiple GRACE products and global hydrological models, Remote Sens. Environ., 192, 198–216, 2017.
Longuevergne, L., Scanlon, B. R., and Wilson, C. R.: GRACE hy-drological estimates for small basins: evaluating processing ap-proaches on the High Plains Aquifer, USA, Water Resour. Res., 46, W11517, https://doi.org/10.1029/2009WR008564, 2010. Longuevergne, L., Wilson, C. R., Scanlon, B. R., and Crétaux, J. F.:
GRACE water storage estimates for the Middle East and other regions with significant reservoir and lake storage, Hydrol. Earth
Syst. Sci., 17, 4817–4830, https://doi.org/10.5194/hess-17-4817-2013, 2013.
MacDonald, A. M., Bonsor, H. C., Dochartaigh, B. E. O., and Tay-lor, R. G.: Quantitative maps of groundwater resources in Africa, Environ. Res. Lett., 7, 024009, https://doi.org/10.1088/1748-9326/7/2/024009, 2012.
Nanteza, J., de Linage, C. R., Thomas, B. F., and Famigli-etti, J. S.: Monitoring groundwater storage changes in com-plex basement aquifers: An evaluation of the GRACE satel-lites over East Africa, Water Resour. Res., 52, 9542–9564, https://doi.org/10.1002/2016WR018846, 2016.
Nicholson, S. E., Yin, X., and Ba, M. B.: On the feasibility of using a lake water balance model to infer rainfall: an example from Lake Victoria, Hydrolog. Sci. J., 45, 75–95, 2000.
Niu, G.-Y., Yang, Z.-L., Dickinson, R. E., Gulden, L. E., and Su, H.: Development of a simple groundwater model for use in climate models and evaluation with Gravity Recovery and Climate Experiment data, J. Geophys. Res., 112, D07103, https://doi.org/10.1029/2006JD007522, 2007.
Oleson, K. W., Niu, G.-Y., Yang, Z.-L., Lawrence, D. M., Thornton, P. E., Lawrence, P. J., Stockli, R., Dickinson, R. E., Bonan, G. B., Levis, S., Dai, A., and Qian, T.: Im-provements to the Community Land Model and their impact on the hydrological cycle, J. Geophys. Res., 113, G01021, https://doi.org/10.1029/2007JG000563, 2008.
Owor, M.: Groundwater – surface water interactions on deeply weathered surfaces of low relief in the Upper Nile Basin of Uganda, PhD thesis, Geography, University College London, London, 271 pp., 2010.
Owor, M., Taylor, R. G., Tindimugaya, C., and Mwesigwa, D.: Rainfall intensity and groundwater recharge: empirical evidence from the Upper Nile Basin, Environ. Res. Lett., 4, 035009, https://doi.org/10.1088/1748-9326/4/3/035009, 2009.
Owor, M., Taylor, R. G., Mukwaya, C., and Tindimugaya, C.: Groundwater/surface-water interactions on deeply weathered surfaces of low relief: evidence from Lakes Victoria and Kyoga, Uganda, Hydrogeol. J., 19, 1403–1420, 2011.
Ramillien, G., Famiglietti, J. S., and Wahr, J.: Detection of Conti-nental Hydrology and Glaciology Signals from GRACE: A Re-view, Surv. Geophys., 29, 361–374, 2008.
Rodell, M. and Famiglietti, J. S.: Terrestrial Water Storage Varia-tions over Illinois: Analysis of ObservaVaria-tions and ImplicaVaria-tions for GRACE, Water Resour. Res., 37, 1327–1340, 2001.
Rodell, M., Houser, P. R., Jambor, U., Gottschalck, J., Mitchell, K., Meng, C.-J., Arsenault, K., Cosgrove, B., Radakovich, J., Bosilovich, M., Entin, J. K., Walker, J. P., Lohmann, D., and Toll, D.: The Global Land Data Assimilation System, B. Am. Meteo-rol. Soc., 85, 381–394, 2004.
Rodell, M., Velicogna, I., and Famiglietti, J. S.: Satellite-based esti-mates of groundwater depletion in India, Nature, 460, 999–1003, https://doi.org/10.1038/nature08238, 2009.
Rowlands, D. D., Luthcke, S. B., McCarthy, J. J., Klosko, S. M., Chinn, D. S., Lemoine, F. G., Boy, J.-P., and Sabaka, T. J.: Global mass fluxsolutions from GRACE: A compar-ison of parameter estimation strategies-Mass concentrations versus stokes coe?cients, J. Geophys. Res., 115, B01403, https://doi.org/10.1029/2009JB006546, 2010.
in the California Central Valley, USA, Water Resour. Res., 48, W04520, https://doi.org/10.1029/2011WR011312, 2012. Scanlon, B. R., Zhang, Z., Reedy, R. C., Pool, D. R., Save,
H., Long, D., Chen, J., Wolock, D. M., Conway, B. D., and Winester, D.: Hydrologic implications of GRACE satellite data in the Colorado River Basin, Water Resour. Res., 51, 9891–9903, https://doi.org/10.1002/2015WR018090, 2015.
Scanlon, B. R., Zhang, Z., Save, H., Wiese, D. N., Lan-derer, F. W., Long, D., Longuevergne, L., and Chen, J.: Global evaluation of new GRACE mascon products for hy-drologic applications, Water Resour. Res., 52, 9412–9429, https://doi.org/10.1002/2016WR019494, 2016.
Sene, K. J. and Plinston, D. T.: A review and update of the hydrol-ogy of Lake Victoria in East Africa, Hydrolog. Sci. J., 39, 47–63, 1994.
Shamsudduha, M., Taylor, R. G., and Longuevergne, L.: Mon-itoring groundwater storage changes in the highly sea-sonal humid tropics: validation of GRACE measurements in the Bengal Basin, Water Resour. Res., 48, W02508, https://doi.org/10.1029/2011WR010993, 2012.
Strassberg, G., Scanlon, B. R., and Rodell, M.: Compari-son of seaCompari-sonal terrestrial water storage variations from GRACE with groundwater-level measurements from the High Plains Aquifer (USA), Geophys. Res. Lett., 34, L14402, https://doi.org/10.1029/2007GL030139, 2007.
Sun, A. Y., Green, R., Rodell, M., and Swenson, S.: Inferring aquifer storage parameters using satellite and in situ measure-ments: Estimation under uncertainty, Geophys. Res. Lett., 37, L10401, https://doi.org/10.1029/2010GL043231, 2010. Sutcliffe, J. V. and Petersen, G.: Lake Victoria: derivation of a
cor-rected natural water level series, Hydrolog. Sci. J., 52, 1316– 1321, 2007.
Swenson, S. and Wahr, J.: Post-processing removal of corre-lated errors in GRACE data, Geophys. Res. Lett., 33, L08402, https://doi.org/10.1029/2005GL025285, 2006.
Tapley, B., Flechtner, F., Watkins, M., and Bettadpur, S.: GRACE mission: status and prospects, 2015 GRACE Science Team Meet-ing, Austin, Texas, 20–22 September, 2015.
Tapley, B. D., Bettadpur, S., Ries, J. C., Thompson, P. F., and Watkins, M. M.: GRACE measurements of mass variability in the Earth system, Science, 305, 503–505, 2004.
Taylor, R. G. and Howard, K. W. F.: A tectonic geomorphic model of the hydrogeology of deeply weathered crystalline rock: evi-dence from Uganda, Hydrogeol. J., 8, 279–294, 2000.
Taylor, R. G., Tindimugaya, C., Barker, J., MacDonald, D., and Ku-labako, R.: Convergent radial tracing of viral and solute transport in gneiss saprolite, Ground Water, 48, 284–294, 2010.
Taylor, R. G., Todd, M. C., Kongola, L., Maurice, L., Na-hozya, E., Sanga, H., and MacDonald, A. M.: Evidence of the dependence of groundwater resources on extreme rain-fall in East Africa, Nature Climate Change, 3, 374–378, https://doi.org/10.1038/nclimate1731, 2013.
UNEP: Adaptation to Climate-change Induced Water Stress in the Nile Basin: A Vulnerability Assessment Report, Division of Early Warning and Assessment (DEWA), United Nations Envi-ronment Programme (UNEP), Nairobi, Kenya, 2013.
Vishwakarma, B. D., Devaraju, B., and Sneeuw, N.: Min-imizing the effects of filtering on catchment scale GRACE solutions, Water Resour. Res., 52, 5868–5890, https://doi.org/10.1002/2016WR018960, 2016.
Vouillamoz, J. M., Lawson, F. M. A., Yalo, N., and Descloitres, M.: The use of magnetic resonance sounding for quantifying specific yield and transmissivity in hard rock aquifers: The example of Benin, J. Appl. Geophys., 107, 16–24, 2014.
Wahr, J., Swenson, S., Zlotnicki, V., and Velicogna, I.: Time-variable gravity from GRACE: First results, Geophys. Res. Lett., 31, L11501, https://doi.org/10.1029/2004GL019779, 2004. Wahr, J., Swenson, S., and Velicogna, I.: Accuracy of
GRACE mass estimates, Geophys. Res. Lett., 33, L06401, https://doi.org/10.1029/2005GL025305, 2006.
Wang, L., Davis, J. L., Hill, E. M., and Tamisiea, M. E.: Stochastic filtering for determining gravityvariations for decade-long time-series of GRACE gravity, J. Geophys. Res.-Sol. Ea., 121, 2915– 2931, https://doi.org/10.1002/2015JB012650, 2016.
Watkins, M. M., Wiese, D. N., Yuan, D.-N., Boening, C., and Landerer, F. W.: Improved methods for observing Earth’s time variable mass distribution with GRACE using spheri-cal cap mascons, J. Geophys. Res.-Sol. Ea., 120, 2648–2671, https://doi.org/10.1002/2014JB011547, 2015.
Wiese, D. N., Yuan, D.-N., Boening, C., Landerer, F. W., and Watkins, M. M.: JPL GRACE Mascon Ocean, Ice, and Hydrol-ogy Equivalent Water Height JPL RL05M.1. Ver. 1, PO.DAAC, CA, USA, 2015.
Wiese, D. N., Landerer, F. W., and Watkins, M. M.: Quan-tifying and reducing leakage errors in the JPL RL05M GRACE mascon solution, Water Resour. Res., 52, 7490–7502, https://doi.org/10.1002/2016WR019344, 2016.
Xie, H., Longuevergne, L., Ringler, C., and Scanlon, B. R.: Cal-ibration and evaluation of a semi-distributed watershed model of Sub-Saharan Africa using GRACE data, Hydrol. Earth Syst. Sci., 16, 3083–3099, https://doi.org/10.5194/hess-16-3083-2012, 2012.