2017 2nd International Conference on Computational Modeling, Simulation and Applied Mathematics (CMSAM 2017) ISBN: 978-1-60595-499-8
Queueing Model of Public Toilet and its Performance Analysis
Xian-chao WANG
1,*, Jie ZHANG
2, Mian ZHANG
2, and Shan GAO
21School of Computer and Information Engineering, Fuyang Normal University, Fuyang Anhui
236037, China
2School of Mathematics and Statistics, Fuyang Normal University, Fuyang Anhui 236037, China
*Corresponding author
Keywords: M/M/s queueing system, Unisex public toilet, Queue length, Average waiting time.
Abstract. This paper builds some public toilet analytical models based on the M/M/s queuing system.
And it analyses the performance metrics of traditional public toilet (Tradition1) with n cubicles in
both women’s and men’s, traditional public toilet (Tradition2) with 2n cubicles in women’s and n
cubicles in men’s, and unisex public toilet by numerically simulating the queueing models. The results illustrate that the performances of unisex public toilet and Tradition2 are obviously better than the one of Tradition1. Therefore, unisex public toilet and Tradition2 can provide an idea and theoretical basis for solving the problem of the lady's queue.
Introduction
It is generally known that public toilets are of key importance for everybody, regardless of their gender, age, career, ethnic origin, physical ability or mental ability. However, with the development of economy and the improvement of life, we see a perennial phenomenon that there is a long queue in front of woman's lavatory in densely populated places, such as scenic area, supermarket, theaters, waiting lounge. Quite a few scholars investigated the reasons which caused the problem[1].
To solve the problem, people have proposed different kinds of methods. For example, the first solution involves building more and more modern toilets. The second solution is that the proportion of men’s and women’s can be adjusted from 1 to 1 to 1 to 2 or even 1 to 3. The third solution is to change women’s toilet behavior. And, the last solution involves installing permanent unisex toilets in public areas[2]. In facts, unisex toilets played a great role in Shanghai World Expo; they are widely implemented in Sweden. However, no scholars explored the performance of these solutions, especially the comparison between unisex toilet and improvement of the proportion. This paper will build some public toilet service models based on queue theory, and analyze the performance. The performance simulation illustrates that there are some interesting results.
The remainder of the paper is organized as follows. Section 2 builds the analytical models of different public toilets based on M/M/s queueing system after briefly introducing relevant theory and its applications. Section 3 presents primary performance metrics and the details of the analysis. Section 4 illustrates the numerical results obtained from the analytical model. Finally, Section 5 summarizes the findings, concludes the paper, and gives the future work.
Analytical Model Based on M/M/s Queueing System
Queuing theory, an important branch of stochastic operations research, was constructed by Erlang in 1909[3]. Now it has been widely used in communication[4-5], transportation[6], inventory[7], task scheduling[8-9], resource allocation[10], cloud computing[11-12] and many other areas, highlighting its powerful vitality. This paper will establish the models of women’s, men’s, Tradition1, Tradition2 and unisex public toilet based on M/M/s queuing system.
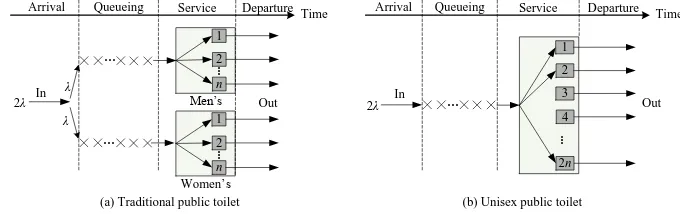
Fig. 1 shows the models of these two different types of public toilets, traditional and unisex public toilets. It can be seen easily that the models are four stages, arrival, queueing, service and departure. To analyze their performances, we present the following hypotheses.
shown in Fig. 1(a). And a urinal is regarded as a cubicle. Meanwhile, their services are independent of each other.
2) The arrivals of male and female customers both follow a poisson distribution with the parameter
, which is the arrival intensity. As a result, the total arrival intensity is equal to 2. In other
words, the arrival intensity is 2for unisex toilet, shown in Fig. 1(b).
3) The average service ratio of each facility in the women's follows a negative exponential
distribution. Obviously, the average service ratio of the women’s queueing model is equal to n.
…
…
(a) Traditional public toilet
…
(b) Unisex public toilet Men’s
1
…
In
Out In Out
2λ 2λ
λ
λ
Women’s 2
n
1
…
2
n
1
…
2
2n
3 4 Time
[image:2.595.122.462.181.288.2]Arrival Queueing Service Departure Arrival Queueing Service Departure Time
Figure 1. Queueing model of public toilet.
4) The proportion of service time is 1 to 2 when men and women go to toilet. Therefore, the
average service ratio of each facility in the men's is equal to2, and the average service ratio of
the men’s is equal to 2n.
5) Obviously, under the situation of equivalent service facilities, there are 2n cubicles in unisex
toilet, the average service ratio of each facility follows a negative exponential distribution with
parameter 1.5, and the average service ratio of the unisex public toilet is equal to
2n1.5=3n.
6) Alternatively, each arrival customer will wait for an empty facility or be serviced directly.
Obviously, there is no restriction imposed on the customer resource and capacity for any kind of toilet. In other words, we shall employ M/M/s queueing system to analyze their performance.
Consequently, the potential state set is 0, 1, 2, .... And the state flows of these queueing systems
are shown in Fig. 2 on First Come First Service(FCFS) strategy.
0 1 … k … 2n 2n+1 …
3n
3n
3n
1.5k
3 1.5
2λ 2λ 2λ 2λ 2λ 2λ 2λ
(b) Men’s public toilet (c) Unisex public toilet (a) Women’s public toilet
0 1
λ λ
n
λ
n+1 …
λ λ
n n n
k …
λ λ
k
2
… 0 1 …
λ λ
2 4
n λ
n+1 …
λ λ
2n
k …
λ λ
2k 2n 2n
Figure 2. State flow of public toilet queueing system.
Primary Performance Metrics
The primary performance indicators include average queue length, idle probability, average waiting time, average sojourn time and so on, similarly to other queueing systems. We firstly discuss the
performance metrics of the simplest public toilet queueing system, women’s queueing system with n
cubicles.
Let service intensity of each cubicle in women’s and women’s queueing system be and 0,
respectively. That is to say, 𝜌 = 𝜌𝑓1 =
𝜇, 𝜌0 = 𝜌𝑓10 =
𝑛𝜇. The queueing system will reach
equilibrium state if 𝜌𝑓10< 1. Let the probability of k ladies in the system be Pk. According to Fig.
2(a) and the law of K's algebraic equation[13], the following stationary distribution can be obtained.
{
𝜇𝑃1 =𝑃0,
𝑘𝜇𝑃𝑘 = 𝑃𝑘−1 (1 ≤ 𝑘 ≤ 𝑛) 𝑛𝜇𝑃𝑘 =𝑃𝑘−1 (𝑘 ≥ 𝑛 + 1).
, (1)
Incorporating the regularity condition ∑∞𝑘=0𝑃𝑘 = 1, the system reaches equilibrium state with
𝑃𝑓10 = 𝑃0 = (∑ 𝜌𝑘
𝑘!+ 𝜌𝑛
𝑛! 𝑛−1
𝑘=0
1 1−𝜌0)
−1
. (2)
The other performance metrics, such as Pf1n, Pf1w, Cf1, Ff1, Lf1, Tf1w, Tf1s, can be calculated and presented with ,0 and Pf10.
Pf1n is the probability that there are just n ladies who are using all of the cubicles, and it can be
calculated by the following formula
𝑃𝑓1𝑛 =(𝑛𝜌)
𝑛𝑃 𝑓10
𝑛! . (3)
Pf1w is the probability when ladies just arrive and have to wait, and it can be calculated by the
following formula
𝑃𝑓1𝑤 = 𝑃𝑓1𝑛
1−𝜌0 = 𝑛𝑃𝑓1𝑛
𝑛−𝜌 . (4)
Cf1wis the average of ladies who are in queue, and it can be calculated by the following formula
𝐶𝑓1𝑤= 𝜌0𝜌𝑛𝑃𝑓10
𝑛!(1−𝜌0)2 =
𝜌𝑛+1𝑃 𝑓10
(𝑛−1)!(𝑛−𝜌)2. (5)
Ff1 is the average of facilities which are in service. Obviously, it is equal to the service intensity of
every cubicle. That is,
𝐹𝑓1 = . (6)
Lf1 is the average queue length which includes the ladies in queue and ones being serviced. In other
words, it is equal to the sum of Cf1w and Ff1. That is,
𝐿𝑓1 = 𝐶𝑓1𝑤+ 𝐹𝑓1= 𝜌𝑛+1𝑃𝑓10
(𝑛−1)!(𝑛−𝜌)2+. (7)
Tf1w is the average waiting time before ladies being serviced. And Tf1s is the average sojourn time
which includes the average waiting time Tf1w and the service time. According to Little formula[13],
𝑇𝑓1𝑤= 𝐶𝑓= 𝜌𝑛𝑃𝑓10
𝑛!𝑛𝜇(1−𝜌0)2, (8)
𝑇𝑓1𝑠 = 𝐿𝑓1
= 𝑇𝑓1𝑤+
1
𝜇. (9)
Now we discuss the performance metrics of men’s with n cubicles and unisex queueing system
with 2n cubicles. We can easily obtain the service intensity 𝜌𝑚and 𝜌𝑢 of each facility in men’s and
unisex public toilet, service intensity 𝜌𝑚0 and 𝜌𝑢0 of men’s and unisex queueing system. Meanwhile,
𝜌𝑓2 and 𝜌𝑓20 of the women’s with 2n cubicles also can be obtained. That is,
𝜌𝑚 =
2𝜇= 1
2𝜌, 𝜌𝑚0 =
2𝑛𝜇 = 1 2𝜌0,
𝜌𝑢 = 2
1.5𝜇= 4
3𝜌, 𝜌𝑢0 = 2 2𝑛1.5𝜇=
2 3𝜌0,
𝜌𝑓2 =
𝜇 = 𝜌, 𝜌𝑓20=
2𝑛𝜇= 1 2𝜌0.
Similarly, the primary performance metrics of men’s, unisex public toilet and women’s with 2n
cubicles can be obtained. We can easily obtain the following performance metrics of Tradition1 shown in Fig. 1(a).
𝑃𝑡10 is the idle probability when neither of men’s and women’s is in use. Obviously, it is the
product of 𝑃𝑓10 and 𝑃𝑚0. That is,
𝑃𝑡10 = 𝑃𝑓10∙ 𝑃𝑚0=(∑ 𝜌𝑘
𝑘! + 𝜌𝑛
𝑛! 𝑛−1
𝑘=0
1 1−𝜌0)
−1
(∑ (
1 2𝜌)
𝑘
𝑘! + (12𝜌)𝑛
𝑛! 𝑛−1
𝑘=0
2 2−𝜌0)
−1
𝑃𝑡1𝑛 is the probability when men’s and women’s are both just n customers being serviced.
Obviously, it is the product of 𝑃𝑡1𝑛 and 𝑃𝑚𝑛. That is,
𝑃𝑡1𝑛 = 𝑃𝑓1𝑛 ∙ 𝑃𝑚𝑛 =
(𝑛𝜌0)𝑛𝑃𝑓10
𝑛! ∙
(1 2𝑛𝜌0)
𝑛𝑃 𝑚0
𝑛! . (11)
𝑃𝑡1𝑤 is the probability when customers arrive and have to wait in the Tradition1 queueing system,
which is equal to the sum of 𝑃𝑓1𝑤 and 𝑃𝑚𝑤. Namely,
𝑃𝑡1𝑤 = 𝑃𝑓1𝑤+ 𝑃𝑚𝑤 =
𝜌𝑛+1𝑃𝑓10 (𝑛−1)!(𝑛−𝜌)2+
2(12𝑛𝜌0)𝑛𝑃𝑚0
(𝑛−1)!(2𝑛−𝜌). (12)
𝐶𝑡1𝑤 is the average customers who are waiting for service in Tradition1. Obviously, it is equal to
the sum but not the mean of Cf1w and Cmw because the facilities are not used each other. That is,
𝐶𝑡1𝑤 = 𝐶𝑓1𝑤+ 𝐶𝑚𝑤 = 𝜌𝑛+1𝑃𝑓10
(𝑛−1)!(𝑛−𝜌)2+
(12𝜌)𝑛+1𝑃𝑚0
(𝑛−1)!(𝑛−12𝜌)2. (13)
𝐹𝑡1 is the average facilities which are in use in Tradition1. Obviously, it is equal to the sum of 𝐹𝑓1
and 𝐹𝑚. That is,
𝐹𝑡1 = 𝐹𝑓1+ 𝐹𝑚 = 𝜌 + 0.5𝜌 = 1.5𝜌. (14)
𝐿𝑡1 is the average queue length of Tradition1 queueing system. Obviously, it is the sum of 𝐶𝑡1𝑤
and 𝐹𝑡1. In other words, it is the sum of Lf1 and Lm. That is,
𝐿𝑡1 = 𝐿𝑓1+ 𝐿𝑚 = 𝜌𝑛+1𝑃𝑓10
(𝑛−1)!(𝑛−𝜌)2+
(12𝜌)𝑛+1𝑃𝑚0
(𝑛−1)!(𝑛−12𝜌)2+ 3
2𝜌. (15)
𝑇𝑡1𝑤 is the average waiting time while the customers are in the Tradition1 queue, and 𝑇𝑡1𝑠 is the
average sojourn time, which includes the average waiting time and the service time, of Tradition1 queueing system.
𝑇𝑡1𝑤 = 1
2(𝑇𝑓1𝑤+ 𝑇𝑚𝑤) =
𝜌𝑛𝑃𝑓10 2𝑛!𝑛𝜇(1−𝜌0)2+
(1 2𝜌)
𝑛𝑃 𝑚0
𝑛!𝑛𝜇(2−𝜌0)2, (16)
𝑇𝑡1𝑠 = 1
2(𝑇𝑓1𝑠+ 𝑇𝑚𝑠) = 1
2(𝑇𝑓1𝑤+ 𝑇𝑚𝑤+ 3
2𝜇) = 𝑇𝑡1𝑤+
3
4𝜇. (17)
To compare unisex public toilet, we can similarly obtain the performance metrics of the Tradition2.
Numerical Validation
To compare the performance of different public toilet queueing systems, we simulate them numerically. To conveniently calculate, we take the average time women spend going to toilet for
90s. In other words, the average service ratio of each cubicle in women’s 𝜇 is equal to 40 persons per
hour. 𝜌0 is equal to 0.9, less than 1, and all of the mentioned above queueing systems can reach
equilibrium state when n=5, and = 180 persons per hour. We can obtain their performance metrics,
shown in Table 1 by simulating numerically the relevant formulas above.
Table 1. Performance metrics of the queueing system when n=5 and = 180.
Metrics Women’s1 Women’s2 Men’s Traditoin1 Tradition2 Unisex
𝑃0 0.0050 0.0111 0.1039 0.0005 0.0012 0.0024
𝑃𝑛 0.0762 0.0104 0.0499 0.0038 0.0005 0.0405
𝑃𝑤 0.7625 0.1040 0.0908 0.8533 0.1949 0.1013
𝐶𝑤 6.8624 0.0155 0.0743 6.9367 0.0898 0.1519
𝐹 4.5 4.5 2.25 6.75 6.75 6
L 11.3624 4.5155 2.3243 13.6867 6.8398 6.1519
𝑇𝑤 2.2875 0.0026 0.0248 1.1561 0.0137 0.0253
𝑇𝑠 3.7875 1.5026 0.7748 2.2811 1.1387 1.0253
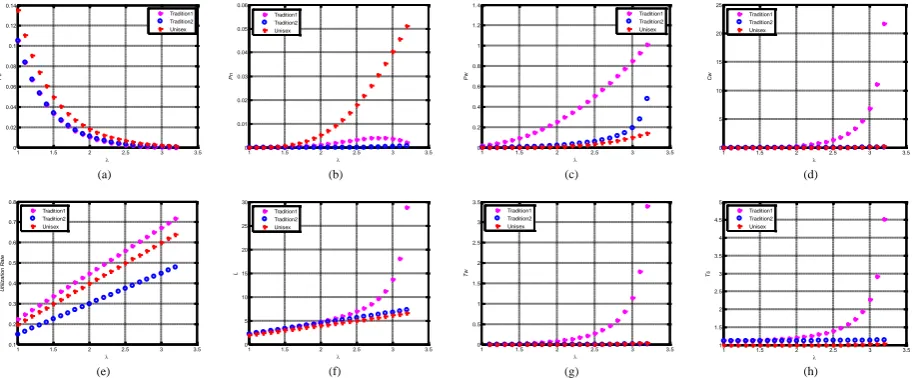
To better analyze their performances, we focus on the influence on the performance of Tradition1,
Tradition2 and unisex queueing systems above when 𝜇 and n are fixed and is changed. The results
are shown in Fig. 3.
We can obtain some interesting findings from Fig. 3. For example, Fig. 3(a) shows that the idle probability of unisex public toilet is larger than those of tradition1 and tradition2 and the latters are
almost equal on the same value of . In addition, the idle probabilities of all the facilities in these
different queuing systems take on the tendency of decrease with the increase of . Fig. 3(b) illustrates
that Pn of Tradition2 hardly change, the one of Tradition1 first increases slowly and then decreases
with the increase of because of the first increase and then decrease tendency of Women’s1.
However, the one of unisex queueing system increase dramatically. From Fig. 3(c), we can easily see
that the average waiting probabilities of the three queueing systems increase with the increase of ,
and the one of Tradition1 increases vigorously while the others increase slowly. In other word, unisex
queueing system and Tradition2 can decrease effectively the waiting probability Pw of Tradition1.
From Fig. 3(d), we can easily see that Cw of Tradition1 increases first slowly and then vigorously and
the others hardly change with the increase of . In other words, unisex queueing system and Tradition2
1 1.5 2 2.5 3 3.5 0 0.02 0.04 0.06 0.08 0.1 0.12 0.14 P0 Tradition1 Tradition2 Unisex
1 1.5 2 2.5 3 3.5 0 0.01 0.02 0.03 0.04 0.05 0.06 Pn Tradition1 Tradition2 Unisex
1 1.5 2 2.5 3 3.5 0 0.2 0.4 0.6 0.8 1 1.2 1.4 Pw Tradition1 Tradition2 Unisex
1 1.5 2 2.5 3 3.5 1 1.5 2 2.5 3 3.5 4 4.5 5 Ts Tradition1 Tradition2 Unisex
1 1.5 2 2.5 3 3.5 0 0.5 1 1.5 2 2.5 3 3.5 Tw Tradition1 Tradition2 Unisex
1 1.5 2 2.5 3 3.5 0 5 10 15 20 25 30 L Tradition1 Tradition2 Unisex
1 1.5 2 2.5 3 3.5 0.1 0.2 0.3 0.4 0.5 0.6 0.7 0.8 U ti liz a ti o n R a te Tradition1 Tradition2 Unisex
1 1.5 2 2.5 3 3.5 0 5 10 15 20 25 Cw Tradition1 Tradition2 Unisex
(a) (b) (c) (d)
(e) (f) (g) (h)
Figure 3. Effect on performance metrics by .
can decrease effectively the average waiting customers. It can be seen that the average facilities in service of Tradition1 and Tradition2 are equal according to the discussion above and Table 3. As a
consequence, we think about facility utilization rate, the ratio of F and facilities. Fig. 3(e) manifests
that the average utilization rates of the three queueing systems all increase linearly, and those of
Tradition1 and Tradition2 are max and min on the same value of , respectively. Fig. 3(f) shows that
the average queue length L of Tradition1 first increases slowly if is less than 2, and then increases
vigorously. This is why there is a long queue in front of women’s. However, the average queue lengths of Tradition2 and unisex public toilet present basically linear growth and they become
increasingly less than the one of Tradition1 with the increase of . Finally, Fig. 3(g) and (h)
demonstrate that the average waiting time Tw and the average sojourn time Ts of Tradition1 increase
[image:5.595.68.526.413.602.2]unisex queueing systems are basically unchangeable, and become increasingly less than those of
Tradition1 with the increase of .
As a result, the performance metrics, such as Pn, Pw, Cw, L, Tw and Ts, of Tradition2 and unisex
public toilet are better than those of Tradition1. In other words, unisex public toilet and Tradition2 can improve effectively the performance of Tradition1. Compared with Tradition2, unisex public toilet need less resource, and can improve the facility utilization rate.
Summary
In order to improve the gender equity over the use of public facilities, promote the construction of public toilet rationalization and use, we established the queueing models of Women’s1 and men’s
with n cubicles, Women’s2 with 2n cubicles, Tradition1, Tradition2 and unisex public toilet with 2n
cubicles based on M/M/s queueing system. Meanwhile, we investigated the performance metrics, such as average queue length, average waiting customers, average waiting probability, average waiting time and average sojourn time, of the queueing systems of Women’s1, men’s and unisex public toilet by their state flow graph. On the basis, we focused on exploring the performance metrics of Tradition1 and Tradition2.
Finally, we analyzed the performance of Tradition1, unisex public toilet, and Tradition2 by simulating them numerically. The results illustrated that the primary performance metrics, such as average queue length, average waiting customers, average waiting probability, average waiting time and average sojourn time, of unisex public toilet and Tradition2 are obviously superior to those of Tradition1. At the same time, unisex public toilet needs less resource and occupies less space than Tradition2. Although unisex toilet is the norm at home, many people prefer not to use a unisex public toilet on both safety and hygiene grounds. Consequently, this paper presents theoretical foundation to solve the problem that ladies queue to go to public toilet.
Acknowledgement
This research was financially supported by the NSFC (No. 61672006), Key Project of Science Research in Colleges and Universities of Anhui Province (KJ2015A191, KJ2015A182), Quality Engineering Project of Fuyang Normal University (2014JXTD01) and Scientific Research Project of Fuyang Normal University (2017FSKJ12).
References
[1] K.R. Sandra, S.D. Savannah, Queuing theory in the analysis of public restroom use and behavior:
Implications for research, design, EDRA 20 (1989) 286-292.
[2] P. Barbara, Researching Female Public Toilets: Gendered Spaces, Disciplinary Limits, Journal
of International Women’s Studies 6(2005) 81-98.
[3] A.K. Erlang, The theory of probabilities and telephone conversations, Nyt Tidsskrift for
Matematik B 20 (1909) 33-39.
[4] Z. Panlop, B. Anthony, B. James, D. Peter, T. Zahir, Queuing Theory Applications to
Communication Systems: Control of Traffic Flows and Load Balancing, Springer Handbook of Engineering Statistics, Springer, 2006:991-1022.
[5] N.M. Van Dijk, On the arrival theorem for communication networks, Computer Networks and
ISDN Systems 25 (1993) 1135-2013.
[6] M. Anokye, A.R. Abdul-Aziz, K. Annin, F.T. Oduro, Application of queuing theory to vehicular
[7] L.M. Liu, X.M. Liu, D.D. Yao, Analysis and optimization of a multistage inventory-queue system, Management Science 50 (2004) 365-380.
[8] H.-B. Mor, Scheduling: SRPT and Fairness, Performance Modeling and Design of Computer
Systems, Cambridge University Press, 2013 518-530.
[9] H. Khazaei, J. Misic, V.B. Misic, A Fine-Grained performance model of cloud computing
centers, IEEE Transactions on Parallel and Distributed Systems 24 (2013) 2138-2147.
[10]R. Murugesan, C. Elango, S. Kannan. Resource allocation in cloud computing with
M/G/s-queueing system, International Journal of Advanced Research in Computer Science and Software Engineering 4 (2014) 443-447.
[11]J. Vilaplana, F. Solsona, I. Teixidó, J. Mateo, F. Abella, J. Rius, A queuing theory model for
cloud computing, The Journal of Supercomputing 69 (2014) 492-507.
[12]N.A.B. Mary, K. Saravanan, Performance factors of cloud computing data centers using
[(M/G/1): (/GDmodel)] queuing systems, International Journal of Grid Computing & Applications
4 (2013) 1-9.