Non-Destructive Evaluation of Material System
Using Highly Nonlinear Acoustic Waves
Thesis by
Devvrath Khatri
In Partial Fulfillment of the Requirements
for the Degree of
Doctor of Philosophy
California Institute of Technology
Pasadena, California
2011
c
2011
Devvrath Khatri
Dedication
Acknowledgements
First and foremost, I would like to thank Almighty God, for giving me the faith to believe
and strength to pursue and courage to carry on this work.
I would like to thank California Institute of Technology (CALTECH) and Graduate
Aerospace Laboratory at Caltech (GALCIT) for providing me the opportunity to join
this great institute as a graduate student and to provide all the resources, which helped
me, directly or indirectly, in finishing my studies and research, while making my stay
memorable and comfortable.
I take immense pleasure in expressing utmost gratitude to my supervising guide and
mentor Professor Chiara Daraio for giving me the opportunity, guidance, and freedom
to pursue my research project. I appreciate the amount of motivation, kindness, and
patience demonstrated by her throughout my research period. Under her guidance, I
have the opportunity to work on cutting edge technology and to learn many things from
her, which I am sure will be helpful in different stages of my life. She was always available
for guidance and encouragement at short notice, with an open-door policy which helped
in moving things faster. It was a wonderful experience and an honor to work with her.
I also want to express my sincere gratitude towards my thesis committee members for their
time and helpful suggestions that provided me with extra encouragement, motivation, and
guidance to finish my research: Professor Guruswami Ravichandran, Professor Jinkyu
Yang, Professor Kaushik Bhattacharya, and Professor Sergio Pellegrino. I also thank the
members of my candidacy committee for providing the direction and plan for my research
project: Professor Guruswami Ravichandran, Professor Kaushik Bhattacharya, Professor
I owe many thanks to Abha Misra, Alessandro Spadoni, Duc Ngo, Georgios Theocharis,
Jinkyu Yang, Malena Espanol, Stephane Job, and Stephane Griffiths for their useful advice
and support in numerics and experiments to carry out the research work. In particular, I
want to thank Abha, Duc, Jinkyu, and Malena for providing me exemplary guidance and
motivation for my doctoral research and also valuable teachings towards becoming better
in my future career. I will also like to thank my cousin, Himanshu Khatri, for giving
me advice and encouragement regarding finishing my thesis and valuable suggestions for
selection of my future career.
I would like to thank some of my other collaborators, with whom I had an excellent chance
to work, for their support, which helped me in achieving one step closer to completion:
Professor Piervincenzo Rizzo, Professor Fernando Fraternali, Professor Mason Alexander
Porter, Professor Ricardo Carretero, Professor Panos Kevrekidis, Xianglei Ni, Claudio
Silvestro, Damien Eggenspieler, Stephanie Samson, and Maxime Verriere.
I am also thankful to Joe Haggerty, Petros Arakelian, and Ricardo Paniagua for their
valuable suggestions and help in building my experimental setup. I wish to express my
thanks to Chinthaka Mallikarachchi and Xiaowei Deng for their useful suggestions on
finite element simulations.
I am thankful to Caltech, the National Science Foundation (NSF), and the W.M. Keck
Institute for Space Studies (KISS) for their support during my graduate studies. My
KISS Graduate Student Fellowship was crucial in allowing me to have the support and
freedom to explore the research topics that I am interested in; their financial support is
greatly appreciated and it is their generosity that made this research possible.
I am grateful to my parents, Mr. Rajkumar and Mrs. Jyotsna Khatri, and family for
their love, understanding, and support, which provided me with strength and happiness
during my ups and down. I am also thankful to my mother for teaching me how to cook,
which has been of great assistance to me during these past few years. I am also in debt
to my uncle, Dr. Vijay Chachada, for teaching me math and science all along during my
high school years, which helped me create a strong basic foundation.
stay at Caltech and made it memorable. Thanks to (to name few of them) Celia Reina
Romo, Christopher Kovalchick, Francisco L´opez Jim´enez, Philipp Boettcher, Leslie
Lam-berson, Lydia Dennis, Wendy Li, Tomasz Tyranowski, Vikas Pandit Trivedi, Kishore Mac
Jaganathan, Tejaswi Panji Venumadhav, Paraj Titum, Utkarsh Mital, Thevamaran
Ra-jinikanth Ramathasan, Greg Kimball, Pia Ghosh, Leslie Wenning, Rory Perkins, Paula
Popescu, Agustin Bompadre, Andrea Leonard, Ivan Szelengowicz, Paul Anzel, Annie Liu,
Bao Ha, Jack Ziegler, Olive Stohlman, Kwok, Kawai, Michio Inoue, Artemis Ailianou,
Wendy Mercer, Ajay Harish, Jeff Lehew, Harish Ravishankar, Harsha Bhat, Mike Mello,
Angie Capece, Charles Kuan, Hemanth Siriki, Yacine Ali-Ha¨ımoud, Nilanjan Roy, Puja
Saluja, Sanjay Kumar, Manuj Swaroop, Neha Mathur, Himanshu Mishra, Prakhar
Mehro-tra, Nicholas Boechler, Eleftherios Terry Gdoutos, Jordan R. Raney, Wei-Hsun Lin, and
Abstract
A chain of granular particles is one of the most studied examples of highly nonlinear
systems deriving its response from the nonlinear Hertzian contact interaction between
particles. Interest in these systems derives from their tunable dynamic response,
encom-passing linear, weakly nonlinear, and strongly nonlinear regimes, controlled by varying
the static and dynamic load applied. In chains with a very weak (or zero) static
precom-pression, the system supports the formation and propagation of highly nonlinear solitary
waves (HNSWs). The dual-nonlinear interaction between particles (i.e., a power-law type
contact potential in compression, and zero strength in tension) combined with discreteness
of the system, makes the granular system highly tunable. The propagation properties of
these waves, such as traveling pulse width, wave speed, number of separated pulses (single
or train of pulses), etc., can be controlled by modifying one or many of the parameters,
like the particle’s dimension, material properties, static and dynamic force amplitude, the
type and duration of the initial excitation applied to the system, and/or the periodicity
of the chain. The ability to control the wave properties in such chains has been proposed
for several different practical engineering applications.
The dynamic properties of these granular chains have been conventionally studied using
discrete particle models (DPMs) which consider the particles in the chains as point masses
connected by nonlinear Hertzian springs with the neighboring particles. Although, this
is a good approximation under proper circumstances, it does not capture many features
of the three dimensional elastic particles such as the elastic wave propagation within the
particles, the local deformation of the particles in the vicinity of the contact point, the
corresponding changes in the contact area, and the collective vibrations of the particles
using the commercially available software Abaqus, which takes into account many of these
characteristic features. The finite element model discretizes particles by considering them
as three-dimensional deformable bodies of revolution and describes the nonlinear dynamic
response of one-dimensional granular chains composed of particles with various geometries
and orientations. We showed that particles’ geometries and orientations provide additional
design parameters for controlling the dynamic response of the system, compared to chains
composed of spherical particles. We also showed that the tunable and compact nature of
these waves can be used to tailor the properties of HNSWs for specific application, such
as information carriers for actuation and sensing of mechanical properties and boundary
effects of adjoining media in Non-Destructive Evaluation (NDE) and Structural Health
Monitoring (SHM). Using experiments and numerics, we characterized interface dynamics
between granular media and adjoining linear elastic media, and found that the coupling
produced temporary localization of the incident waves at the boundaries between the two
media and their decomposition into reflected waves. We monitored the formation of
re-flected solitary waves propagating back from the interface and found that their properties
are sensitive to the geometric and material properties of the adjoining media. The work
done in this research enhances our understanding of the basic physics and tunability of
nonlinear granular media, and further establishes a theoretical and numerical foundation
Contents
Dedication iii
Acknowledgements iv
Abstract vii
Contents ix
List of Figures xii
List of Tables xxvii
1 Introduction 1
1.1 Motivations and Goals . . . 1
1.2 Outline of Thesis . . . 5
1.3 Granular Particles. . . 6
1.3.1 Hertz’s Law . . . 7
1.4 Linear Waves in Discrete Media . . . 9
1.5 Nonlinear Waves in a One-Dimensional Chain of Granular Particles . . . . 11
2 Experimental Setup 15 2.1 Granular Particles Used in Experiments . . . 16
2.2 Instrumented Sensor Particles . . . 16
2.3 Chain of Granular Particles . . . 19
3 Numerical Modeling of a One-Dimensional Chain of Spherical Particles 28
3.1 Discrete Particle Model (DPM) . . . 28
3.2 Finite Element Model (FEM) . . . 30
3.2.1 Integration Schemes . . . 31
3.2.2 Contact Model in Abaqus . . . 32
3.2.3 Particles’ Modeling . . . 33
3.3 Numerical Validation . . . 34
3.3.1 Quasi-Static Validation . . . 34
3.3.2 Dynamic Validation . . . 37
3.4 Mesh Convergence . . . 41
3.5 Symmetric Boundary Condition on Beads . . . 44
4 Dissipation in a One-Dimensional Chain of Spherical Particles 47 4.1 Introduction . . . 47
4.2 Simulation . . . 49
4.2.1 Discrete Empirical Model . . . 49
4.2.2 Finite Element Model . . . 52
4.3 Results and Discussion . . . 53
5 Effect of Particle Geometry on the Dynamics of Granular Media 57 5.1 Particle Size . . . 58
5.2 Particle Shape . . . 58
5.2.1 Contact Interaction between Non-Spherical Particles . . . 58
5.2.2 Wave Propagation in a Chain of Non-Spherical Particles with El-liptical Contact Interaction. . . 62
5.3 Results and Discussions . . . 64
5.3.1 Chain of Ellipsoidal Particles . . . 64
5.3.2 Chain of Cylindrical Particles . . . 69
5.3.3 Chain of Hollow Spherical Particles . . . 77
6.1.1 Effects of the Linear Media’s Stiffness . . . 88
6.1.2 Effects of the Linear Media’s Geometry . . . 99
6.1.3 Effects of Double-Layer Media: Upper-Layer Thickness . . . 102
6.1.4 Effects of Double-Layer Media: Lower-Layer Thickness . . . 110
6.2 Interaction of Highly Nonlinear Waves with an Adjacent Two-Dimensional Thin Plate . . . 113
6.2.1 Effect of Aspect Ratio . . . 114
6.2.2 Effect of Plate Boundary . . . 120
6.2.3 Discussion . . . 124
6.3 Nonlinear Actuator Design . . . 126
7 Conclusion and Future Work 128
List of Figures
1.1 Schematic diagram of nonlinear granular chain as an automated impact actuator inside of a satellite. The reflected waves from the interface will be used to monitor the structure and to detect buried defects/impurities and other boundaries’ conditions. . . 4
1.2 The figure shows two examples of granular particles. (a) Naturally occurring pebble particles. (b) Industrial-prepared calcium nitrate particles . . . 6
1.3 Contact force between two particles. . . 7
1.4 Schematic representation of discrete particle point mass system . . . 10
1.5 Chain of spherical particles, with point contact between neighboring particles 11
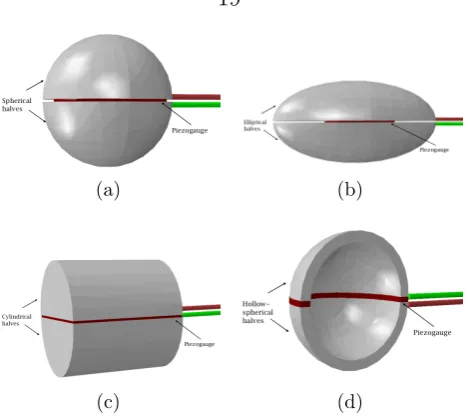
2.1 The four different types of granular particles used in the course of this
re-search to study wave propagation properties in granular media and their
applications: (a) spherical particles, (b) ellipsoidal particles, (c) cylindrical
particles, and (d) hollow sphere . . . 17
2.2 Schematic diagram representing the assembly of the piezogauges embedded
inside selected (a) spherical particles, (b) ellipsoidal particles, (c) cylindrical
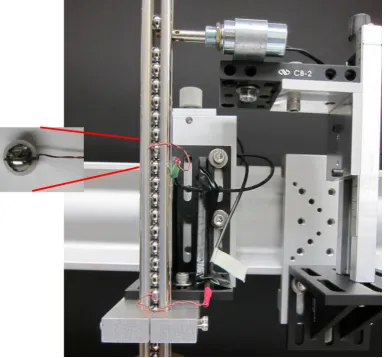
2.3 Experimental setup for the vertically aligned, one-dimensional chain of
spher-ical beads. Four supporting rods were used to constrain the motion of
par-ticles in one direction, along the axis of the chain. Instrumented parpar-ticles,
shown in the inset, were used at the selected location in the chain to
ex-tract the experimental data. These instrumented particles were fabricated
using a piezoelectric sheet between the two cut halves of the beads. The
instrumented particles were connected with Tektronix oscilloscopes, which
recorded the signal information. An identical particle, similar to particles
composing the chain, was used as striker for exciting a single pulse in the
chain. The striker was released from a known height using a
controlled-release mechanism . . . 21
2.4 Experimental results showing the solitary wave propagation in the chain of 70
stainless steel 316 type particles, when the wave is excited using an identical
striker particle with impact velocity = 1.77m/s. The sensor particles in this
case were placed at location numbers 9, 16, 24, 31, 40, 50, 56, and 63 in the
chain. . . 22
2.5 Experimental setup showing the one-dimensional, vertically aligned chain composed of 20 stainless steel spherical particles placed on top of a cylindrical sample. The bottom of the sample was under fixed boundary conditions using a V-block mount. The striker particle was control released from a known height using the solenoid . . . 23
2.6 Various specimens used in the experimental study for interaction of granular media with adjacent linear elastic media. Single-layered uniform cylindrical specimen for variation of: (a) elastic modulus; and (b) geometrical length. Double-layered composite cylindrical specimen with stainless steel layer in the top and PTFE layer in the bottom for the variation: (c) inertia of upper layerHupper and (d) stiffness of lower layerHlower . . . . 24
2.7 A granular media composed of stainless steel spherical particles aligned vertically along the dotted central line of an aluminum plate . . . 27
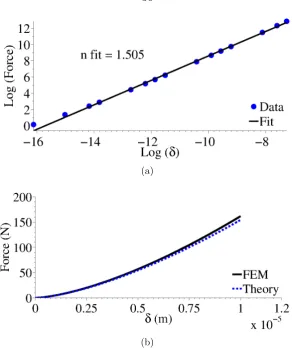
3.2 Quasi-static validation of our model. (a) Logarithmic fitting of the calculated contact force as a function of the applied displacement δ. The solid dots correspond to numerically obtained contact forces at given displacements, and the solid line is the linear fit. (b) Comparison of the force-displacement relation obtained from simulations (solid (black) curve), and the Hertz contact law (Eq. (1.1), dashed (blue) curve) . . . 36
3.3 Dynamic validation of our model. Force profile of the solitary wave at particle number 10. The dash (blue) curve corresponds to the force obtained with our FEM averaging the forces measured at the contacts. The solid (red) curve corresponds to the force obtained with our FEM at the central section of particle 10. The solid (black) curve with star markers was obtained from the HNSW theory (Eq. (1.8)) . . . 37
3.4 Wave propagation detected at particles 10 (blue) and 15 (green) from the impacted end of the chain. (a) Experiments, (b) DPM, and (c) FEM results obtained with the contact force averaging method (first approach described above). The wave was generated with a striker having an impact velocity of 0.63 m/s. . . 39
3.5 Comparison of the variation of HNSW’s velocity as a function of wave amplitude, obtained from FEM, DPM, and theory. The solid (black) curve represents the values obtained from theory (Eq. (1.10)). The solid (red) curve with square markers represent the results obtained from DPM, and the dashed (blue) curve with circular markers represent the results obtained from FEM. . . 40
3.6 FEM meshes for an individual particle in the two extreme cases tested: (a) a particle with the least refined mesh density, and (b) a particle with the most refined mesh density. The particles were discretized in space using tetrahedral elements of second order for all the FEM sets. . . 40
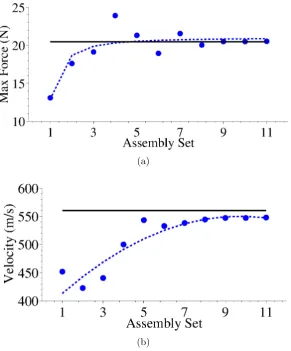
3.8 (a) HNSW’s force amplitude obtained from FEM in increasing order of mesh refinement. The y-axis represents the maximum contact force (N) between particles at location num-ber 15 and 16. (b) HNSW’s velocity obtained from FEM in increasing order of mesh refinement. The x-axis for both the figures represents the assembly sets used in increas-ing mesh density. The solid (black) curve is the force amplitude calculated from the DPM. The dotted (blue) markers and the dashed (blue) curve are the HNSW’s force amplitude and fitting calculated from the FEM. In both panels we observe that as the mesh was refined the force amplitudes and the wave speeds converge to the value calculated from the DPM. . . 43
3.9 Symmetric study of particle in the chain. For this study, we generated the three different types of particles, each having a symmetric property, and compared the solitary wave propagation results with the chain of full spherical particle. (a) Full three-dimensional spherical particle, (b) hemi-spherical particle having symmetric property along one plane, (c) quarter-spherical particle for model having symmetricity in two different planes along transverse direction, (d) axis-symmetric two-dimensional spherical particle . . . 44
3.10 Wave velocity study for four different models for the homogeneous chain of 20 particles. Each model has different symmetric condition in transverse direction. The y-axis and x-axis is force (N) and time (µs), respectively. (a) For the chain composed of full three-dimensional spherical particles. (b) For the model having symmetry loading and boundary property in one transverse plane, each particle was constructed using hemispherical and symmetric property in the respective plane. (c) For the model having two transverse plane symmetry, we used quarter spherical particles. (d) For the model having axis symmetric properties, we used two-dimensional axis symmetric particles for the chain. In the wave plots, the first solid curve (blue) and second curve (red) represent the force observed at the center of the 7th and 16th particle, respectively, in the chain. The third curve (red)
4.1 Optimization of the dissipation coefficients (α, γ) for a chain of 70 steel
particles. (a) Difference D(α, γ), as defined in Eq. (4.2), between the force
maxima observed in the experiment and our model. (b) Difference ∆n(α, γ),
as defined in Eq. (4.3), in wave forms between the experiment and our model
for a sensor placed at locationn = 56. The solid and dashed curves in panel
(a) correspond to the minima obtained from panels (a) and (b), respectively. 51
4.2 (a) Maximum force Fm(n) for experiments with impact velocities v3 (top
curves) and v8 (bottom curves, displaced by 5 units for clarity). The (red)
circles with error bars correspond to the experiment, and the (green) thick
curves give the numerical best fit (see the main text) with (α, γ) = (1.81±
0.25,−5.58 ±1.30). The dashed curves correspond to the extreme cases
using the standard deviation found in the optimal parameters. (b) Velocity
of traveling front versus the maximum force (in a log-log plot). The solid
curves represent the best linear fit, which gives v ∝ F0.17
m ; we also show a
dashed line with slope 1/6≈.167. . . . 54
4.3 (a) Decay of solitary wave in the chain of 70 stainless steel particles for striker velocity = 1.77 m/s. The sensor-particles were placed at location numbers 9, 16, 24, 31, 40, 50, 56, and 63 in the chain. The solid (blue) curves correspond to force values measured in experiments. The solid (blue) curve with circular markers, the solid (red) curve with triangular markers, and the dashed (black) curve with squared markers represent the maximum values obtained from the experimental data, the DPM (Carretero et al., 2009) and the FEM for the best dissipation parameter, respectively. (b) and (c) Force versus time profile in the chain at the sensors positioned in particles number (b) n = 16 and (c) n = 56. The solid (blue) curve shows the experimental data, the dashed (red) curve represents results obtained with the DPM (Carretero et al., 2009), and the dashed-dot (black) curve corresponds to the results obtained with the FEM for the best dissipation parameters. . . 56
5.2 Schematic diagram showing the front and side views for the contact between two ellipsoidal particles, and the dimensions and the radii of the maximum and minimum principal of curvatures at the contact points between ellipsoidal particles . . . 59
5.3 (a) Finite element mesh of: (i) two adjacent ellipsoidal particles arranged
in the minor axis direction; (ii) two adjacent ellipsoidal particles arranged
in the major axis direction; and (iii) two adjacent equivalent spherical
par-ticles. (b) Comparison of the contact force-displacement relations between
two ellipsoidal particles arranged in minor (curve group (i)) and major (curve
group(ii)) axis direction, and also between two equivalent spherical particles
(curve group (iii)) obtained from both finite element simulations (dotted
(blue) curves) and Hertzian elliptical contact law (solid (black) curves) . . . 65
5.4 Finite element model showing the zoom-in view of a uniform chain of
ellip-soidal particles, with the particles aligned along their (b) major axis and (c)
minor axis, respectively . . . 67
5.5 (a) Comparison of experiments and numerical results on the formation and
propagation of a solitary wave in a chain of 20 stainless steel ellipsoidal
particles excited by impacting a stainless steel spherical striker of massm=
0.925g with an initial velocity of 0.626 m/s. Curve group 1 shows the results
for particle 7 in the chain from the top, and similarly, curve group 2 shows the
results for particle 12 from the top. Experimental results are shown by solid
(green) curves. (b) Dependence of the wave speed on the maximum contact
dynamic force in the chains of ellipsoidal particles arranged in both minor
(curve group (i)) and major (curve group (ii)) axis directions and in the
chain of equivalent spherical particles (curve group (iii)) under gravitational
loading. Experimental data for a chain of ellipsoidal particles arranged in
minor axis direction are shown by solid (green) diamonds in curve group
(iii). The solid (black) curves represent the theoretical predictions. In both
panels the dashed (red) curves represent the discrete particle results and the
5.6 Results obtained in a chain composed of 50 ellipsoidal particles, excited by
a spherical striker with an impact velocity v = 0.37 m/s. The (green) solid
curves represent experimental force-time signals obtained from instrumented
particles positioned in locations 8, 16, 28, and 41. The (red) dashed curves
represent numerical results obtained from a modified discrete particle model
with linear damping. γ was the relaxation coefficient and has a value of
−11.67. . . 69
5.7 (a) Schematic diagram showing isometric view and (b) top view of two
cylin-drical particles in contact. (c) Comparison of the contact force-displacement
relations obtained with the Hertzian contact model (solid curves), and with
our finite element model (dashed curves). Results obtained for a contact
between two cylindrical particles oriented at a relative angle α = 0◦ (curve
group (i)), α = 5◦ (curve group (ii)), α = 10◦ (curve group (iii)), α = 30◦
(curve group (iv)), and α= 90◦ (curve group (v)). (d) Detailed view of (c)
for α = 5◦,10◦,30◦,and90◦. (e) Dependence of the exponent n in a generic
power-law type contact interaction between two cylindrical particles on the
orientation angle α, obtained through finite element analysis . . . 71
5.8 Schematic diagram of the cylindrical particles’ chain. The chain was
com-posed of 20 elements, stacked vertically. Piezoelectric sensors were embedded
in particles at location numbers 7 and 13. The orientation angle α between
5.9 (a) Comparison of experimental and numerical results, obtained from the
finite element and discrete particle models, for the wave propagation in a
chain of cylindrical particles with orientation angle α = 90◦. The results
obtained from the instrumented particles placed at location numbers 7 and
13 from the top of the chain are represented by curve groups (1) and (2),
respectively. The solid (green) curves represent experimental data. The
dashed (red) curves are obtained from our discrete particle model, and the
dotted (blue) curves from FEM. (b) Dependence of solitary wave speed on
the maximum dynamic contact force in the chain of cylindrical particles
whenα = 30◦ (curve group (i)), when α= 45◦ (curve group (ii)), and when
α= 90◦(curve group (iii)). Experimental data are reported only forα= 90◦,
and are shown by solid (green) squares. The theoretical results for all of the
angles in each group are shown by solid (black) curves. The results obtained
with our discrete particle model are represented by the dashed (red) curve,
and the finite element results are represented by the dotted (blue) curves in
each group. . . 75
5.10 Numerical results showing the dynamic response of a chain composed of
parallel cylinders (α = 0◦). (a) Force profiles in time obtained for a wave
traveling in a chain of parallel particles using our finite element model (dotted
(blue) curves) and our discrete particle model (dashed (red) curves). Curve
groups (1) and (2) represent results obtained for the waves traveling through
the 7th and 13th particles from the top of the chain. (b) Dependence of wave
speed on the maximum dynamic contact force. The solid lines represent
results obtained with our FEM for different values of the relative orientation
angle α = [0◦, 1◦, 3◦, 5◦, 30◦, 45◦, 90◦]. The dotted line, shown for α = 0◦,
5.11 FEM results showing the dependence of the wave speed (normalized with
respect to the wave speed in the caseα= 90◦) as a function of the orientation
angleα. The three curves correspond to three different dynamic force values:
the solid (blue) curve with circular markers is for Fm = 80 N; the dashed
(red) curve with diamond markers corresponds toFm = 40 N; and the dotted
(black) curve with triangular markers is for Fm = 10 N. . . 77
5.12 a) Schematic diagram showing the axial symmetric FEM of two hollow spheres in contact with symmetry and boundary conditions. (b) Contact interactions obtained from FE simulations for selected values of Ri/Ro = 0 (curve (i) in black), = 0.5 (curve (ii) in
green), = 0.75 (curve (iii) in red), = 0.91 (curve (iv) in blue). The makers represent the FE results, the dashed curves are the power law fittings of the FE results. The solid black curve is obtained from the Hertzian contact interaction between two solid spheres of the same radiusRo. . . 78
5.13 Schematic diagram of the chain composed of 20 hollow spherical particles,
with piezoelectric sensors embedded in particles at location numbers 7 and
13. The radius ratiosRi/Ro for the chain considered were (a) 0, (b) 0.5, (c)
5.14 (a) Comparison of experimental and numerical results, obtained from discrete particle and FE simulations, for the wave propagation in a chain of hollow spheres withRi/Ro=
0.91. The curve group (1) in blue represents the results obtained at particle 12, the curve group (2) in red represents the results obtained at particle 19. The solid curves represent experimental data. The dashed curves are obtained from FE simulations, and the dotted curves from DP simulations. (b) Dependence of solitary wave speed on the dynamic force amplitude in the chain of hollow spheres whenRi/Ro= 0 (curve group (i) in black), when
Ri/Ro = 0.5 (curve group (ii) in green), when Ri/Ro = 0.75 (curve group (iii) in red),
whenRi/Ro = 0.91 (curve group (iv) in blue). Experimental data are reported only for
Ri/Ro = 0.91, and they are shown by solid diamonds. The theoretical results in each
group are represented by solid curves. The results obtained with our discrete particle model are represented by dashed curves and the finite elements results are represented by circles. (c) Comparison of logarithmic scaling of wave velocity-force relation for the chain of hollow spherical particles,Ri/Ro = 0.908, with the chain of solid spherical particles,
Ri/Ro= 0.0. . . 81
6.1 Finite element model for coupling of one-dimensional chain composed of 20 spherical particles with adjacent linear elastic media: (a) a uniform single-layer linear elastic media; and (b) a composite double-layer linear elastic media. The bottom of the linear media was under fixed boundary conditions . . . 85
6.2 Solitary wave propagation measured from the 7th bead in the chain against (a) stainless
6.3 Numerical results showing the displacement profiles in the granular chain including the striker bead (first curve on the left) and 20 particles composing the chain. The displace-ment of the beads is increased under the incidence of the solitary wave. After interacting with the interface, the beads tend to return to their original positions with additional small oscillations, which are particularly evident in the case of wave interaction with the PTFE cylinder. The displacement profile of the 7th particle (thicker solid blue line
in-dicated by y7) shows distinct portions of solitary wave travelling time (Tt) and contact
time (Tc) between stainless steel and PTFE media. (a) The stainless steel wall induces
small displacement (4.39µm) and short contact time (85µs) of the last bead against the bounding wall (bold red line). (b) The PTFE wall allows for a larger displacement of the last bead (16.66µm) and as a result, a longer contact time (241 µs) spent on rebound-ing. We observe multiple impacts between the last and its neighboring beads. The first and second collisions occur at 450µs and 561µs points, as marked by circle and square, respectively . . . 96
6.4 Comparison of experimental, theoretical, and numerical data for the time of flight (TOF) of the primary and secondary reflected solitary waves in the chain of spheres as a func-tion of Young’s modulus of the neighboring media. (a) Arrival time of the PSW in the instrumented particle (7th from top) as obtained by theoretical models (solid red line),
discrete numerical calculations (dashed blue line), and experiments. (b) Arrival time of the SSW, in similar trend to the one of the PSW with an approximately 0.1 ms delay. . 98
6.5 Surface plot obtained from numerical simulations showing the formation of primary and secondary solitary waves in the time domain. The y-axis reports a set of different values of elastic moduli of the linear media adjacent to the chain of spheres. As the stiffness of the contact is decreased, the TOF of the reflected wave increases. Here, the first vertical line evident at∼120 ms from the impact (Time = 0) represents the arrival of the incoming solitary wave. The generation of a reflected SSW is noticeable after a critical value of elastic modulus of the contact. These simulation results were based on the force profile measured from the 7th bead in the chain, and the color bar on the right denotes the
6.6 Comparison of experimental, theoretical, and numerical data for the amplitude ratio of the primary and secondary reflected solitary waves in the chain of spheres as a function of Young’s modulus of the neighboring media. (a) Arrival time of the PSW (b) Reflection ratio of the amplitude of the PSW over that of the incident solitary wave in the instru-mented particle (7th from top) as obtained by theoretical models (solid red line), discrete numerical calculations (dashed blue line), and experiments.. (c) Arrival time of the SSW, in similar trend to the one of the PSW with an approximately 0.1 ms delay. (d) Reflection ratio of the amplitude of the SSW over the amplitude of the incident solitary wave. The reflection ratio becomes smaller as the elastic modulus increases. . . 100
6.7 Surface plots showing the incident and the reflected solitary waves propagating in the time domain. The y-axis shows the different heights of the stainless steel cylinders. The first band visible on the left represents the incoming solitary waves, while the band on the right shows the reflected solitary waves (PSWs) arriving in the instrumented sensor after 0.53 ms. No secondary solitary wave is observed. Numerical results were obtained by testing 14 slender cylinder samples with different heights. The formation of the PSWs shows no sensitivity to the cylinder heights. . . 101
6.8 Time of flight and reflection ratio of the PSW reflected from the stainless steel slender cylinders as a function of the cylinders’ heights. Numerical and experimental data are compared in the magnified Y-axis scale. (a) Arrival time of the PSW, with an extremely regular distribution of the experimental data in the range of 0.44 ∼0.45 ms (less than 1% error). (b) Amplitude ratio of the PSWs. Numerical results show a minute drop from 0.764 to 0.734 around the characteristic length of the linear medium (L= 101 mm), which is within the range of the error bars from the experimental results. . . 103
6.9 Surface plots of incident and backscattered solitary waves as a function of upper layer’s height (Lu) in the composite linear media. The primary solitary wave was observed at
∼ 0.6 ms, whereas the secondary solitary waves exhibit scattered arrival time in the time domain. Experimental results show the dominance of the PSW at largeLuand the
emergence of the SSWs at small Lu. The surface plots are based on the force profile
measured from the 7th bead in the chain, and the color bar on the right denotes the
6.10 Comparison of experimental, theoretical, and numerical data for the time of arrival on the instrumented particle (TOF) of the primary and secondary reflected solitary waves in the chain of spheres, as a function of the upper-layer thickness (Lu) in the composite
media. (a) Time of flight for the PSWs. The arrival time is within the 0.43 to 0.47 ms range. (b) Time of flight for the SSWs. Compared to that of the PSWs, the progression is in the opposite direction with improved responsiveness. . . 108
6.11 Comparison of experimental, theoretical, and numerical data for the amplitude ratio of the primary and secondary reflected solitary waves in the chain of spheres, as a function of the upper-layer thickness (Lu) in the composite media. (a) Amplitude ratio for the
PSWs. The amplitude reflection ratio increases asLu grows. (b) Amplitude ratio of the
SSWs. In contrast to PSW reflection in (a), largerLu yields the smaller SSW reflection
in compensation for the increased PSW reflection. For the upper layer taller than ∼22 mm, the magnitude of the reflection ratio drops below 10% . . . 109
6.12 Numerical results showing the surface plots of incident and reflected solitary waves in granular chain as a function of lower-layer dimension of the composite linear media. The formation of the primary reflected solitary wave is insensitive to the lower-layer thickness, showing the constant amplitude and arrival time for all lower-layer thicknesses tested. However, the secondary solitary waves reveal significant delay in their formation as the dimension of the lower layer increases . . . 110
6.13 Comparison of experimental, theoretical, and numerical data for the time of arrival on the instrumented particle (TOF) of the primary and secondary reflected solitary waves in the chain of spheres, as a function of the lower layer thickness (Ll) in the composite
media. (a) Time of flight for the PSWs. (b) Time of flight for the SSWs. . . 111
6.14 Comparison of experimental, theoretical, and numerical data for the amplitude ratio of the primary and secondary reflected solitary waves in the chain of spheres, as a function of the lower layer thickness (Ll) in the composite media. (a) Amplitude ratio for the
PSWs. The amplitude reflection ratio increases asLl grows. (b) Amplitude ratio of the
6.15 FEM showing a uniform one-dimensional vertically aligned chain of 21 spherical particles (D= 9.52 mm) placed on top of a horizontal thin plate (t= 2.28 mm). Two of the plate edges in one direction were applied with fixed boundary condition, and the other two edges in other direction were free. The wave in the chain is excited using the first particle as striker. . . 114
6.16 Force profiles obtained from experiments for solitary wave propagation in the granular media (D= 9.52 mm) under the interaction with two different plates. (a) Force profiles for a thin plate (t = 2.28 mm). (b) Force profiles for a thick plate (t= 9.52 mm). The reflected solitary waves against the thick plate exhibit stronger (larger Fref) and faster
(smaller TOF) compared to the thin plate case. . . 115
6.17 Plot showing theoretical value of dimensionless contact time (τc) as a function of
inelastic-ity parameter (λ). The dimensionless contact time approachesτc,0= 3.218 for the value
corresponding toλ= 0, which is the case of elastic impact of spherical particle against a semi-infinite elastic media. . . 118
6.18 Amplitude ratio of reflected solitary waves (AR) as a function of the ratio of the sphere diameter to the plate thickness (D/t). The solid black line represents the analytical results, while the filled and hollow marks denote the finite element model and experimental results, respectively. . . 119
6.19 (a) Time of flight (TOF) as a function ofD/t. (b) Normalized TOF with respect toD as a function ofD/t. After normalization, three different curves in (a) overlap into a single curve in (b). The solid black line represents the analytical results, while the filled and hollow marks denote the finite element model and experimental results, respectively. . . 119
6.20 Amplitude ratio of reflected solitary waves (ARR) as a function of distance from the support. (a) Granular crystal with small spheres (D = 9.53 mm). (b) Granular media with large spheres (D= 19.1 mm). The filled and hollow marks denote the finite element model and experimental results, respectively. . . 122
6.21 Critical distances (Lc) in various thicknesses (t) of plates and the diameters (D) of granular
medias. Solid and dashed black lines denote the analytical predictions based on the propagation of guided waves with velocity parameter k = 0.5 and 0.2 (i.e., c = 2,900 and 1,000 m/s), during the contact time Tc,0. The experimental and FEM results are
List of Tables
2.1 Material properties of different types of particles and specimens used in the
experiments. The reported values are standard specifications (Efunda Inc.,
2011) except Young’s moduli of polymers, which were extrapolated from
Hugoniot relationship (Carter and Marsh, 1995). . . 18
4.1 Material properties (mass m, elastic modulus E, and Poisson ratio ν) for
stainless steel, PTFE, and brass. The last two columns present our best
estimates, together with their standard deviation, of the dissipation
coeffi-cients (α, γ). . . 54
5.1 The values of the contact stiffness k and the exponent n obtained from FE
Chapter 1
Introduction
1.1
Motivations and Goals
In recent years, chains of granular particles have received a considerable amount of
at-tention because of their nonlinear dynamic responses derived from the nonlinear contact
interaction between adjacent particles (Brunhuber et al., 2006; Chatterjee, 1999; Coste et al.,1997;Daraio et al.,2006b;Doney and Sen,2006;Harbola et al., 2009;Herbold and Nesterenko, 2007; Herbold et al., 2006; Hong, 2005; Job et al., 2009; Nesterenko, 1983 2001;Remoissenet, 1999;Rosas et al.,2007; Sen and Manciu, 1999;Sen et al.,2008; Ver-gara, 2006). It has been demonstrated that HNSWs are sensitive to granular materials’ properties (Coste et al.,1997; Nesterenko,2001), such as the elastic modulus, the density and the Poisson ratio of the particles. Coste et al. (1997),Daraio et al.(2005 2006b), and
Daraio and Nesterenko(2006) studied numerically and experimentally the propagation of HNSWs in various uniform one-dimensional chains composed of particles of different
ma-terials: for example, stainless-steel, glass, brass, nylon, polytetrafluoroethylene (PTFE),
and even in Parylene-coated steel particles. As predicted by theoretical formulations and
verified through numerics and experiments, the wave properties in these chains depend
significantly on the material parameters of granular particles composing the chain. It has
also been shown numerically and experimentally that the properties of HNSW can be
further varied and tuned easily: for example the wave speed can be altered over a wide
Daraio et al.,2006b;Nesterenko,2001) or by controlling the wave amplitude (Daraio and Nesterenko, 2006; Daraio et al., 2005 2006b). The addition of periodic heterogeneities in the chain can also be used to tailor wave properties in the chain, such as, wave speed,
wave amplitude, and wave width, can be changed accordingly (Porter et al., 2008 2009).
By tuning the various system parameters, the properties of the HNSWs can be controlled
and designed for specific applications. Sen et al. (1998) andHong and Xu (2002) showed the possibility of using the nonlinear solitary waves for the detection of defects and
im-purities in granular media. Hong and Xu (2002) showed that the backscattered signal’s velocity and shape depend on the presence of light and heavy impurities in granular
chains. Nesterenko et al. (2005) and Vergara (2005 2006) studied wave reflection and scattering from the interface of two granular media and found that the energy can be
trapped and back-scattered from the interface depending on the interface properties. Job et al. (2005) studied experimentally and numerically the interaction of nonlinear media with a wall of different mechanical properties and found that the reflected waves from the
interface depend on the wall’s mechanical properties. Daraio et al. (2006a) and Vergara
(2006) showed the potential usefulness of these systems in energy trapping and shock disintegration works. Besides these, some of the other areas of potential application in
which highly nonlinear solitary waves can be useful are sound focusing devices (tunable
acoustic lenses and delay lines), sound absorption layers, and sound scramblers (Daraio et al.,2005; Herbold et al., 2006; Nesterenko et al., 2005; Spadoni and Daraio, 2010).
The ability of the HNSWs to carry the information and their self-stabilization motivated
us to study the dynamic response of chains composed of nonspherical particles, where
the particles’ geometries and orientations can provide us with additional design
param-eters and, along with particles’ material properties, the facility to tune them for specific
wave properties – which makes them a very attractive tool for several applications. The
scalable and controllable nature of nonlinear granular media, an understanding of the
wave reflection and transmission problems from various interfaces, their ability to carry
information, and their minimal dependence on power requirements (as compared to
func-tion generators in ultrasonic actuafunc-tion systems) combine to provide an alternative to
in nondestructive evaluation/structural health monitoring (NDE/SHM) applications for
determining material properties and geometry effects of structures. Figure 1.1 shows a
schematic of a futuristic nonlinear granular actuator system which can be used in a shuttle
with wireless technology as pitch-echo to test linear/non-linear structures.
To use the granular system for NDE/SHM application and many future possible
applica-tions, we need to understand the interface dynamics between nonlinear granular media and
adjacent linear elastic media. It is also imperative to understand the wave propagation
and energy losses in the granular chains for defining specific expected wave
characteris-tics in physical practical applications. We also need numerical technique, which should
be able to couple nonlinear granular chains with specimens of any nature (linear elastic
media or nonlinear inelastic/granular media).
The dynamic properties of granular chains have been conventionally studied using
dis-crete particle models (DPMs), which consider the particles in the chains as point masses
connected by nonlinear Hertzian springs with the neighboring particles. Although this is
a good approximation under proper circumstances, it doesn’t capture many features of
the three-dimensional elastic particles, such as the elastic wave propagation within the
particles, the local deformation of the particles in the vicinity of the contact point, the
corresponding changes of the contact area, and the collective vibrations of the particles,
among others. Therefore, the goal of this research is to develop a finite element model,
using commercially available software Abaqus, which is capable of taking into account
many of these characteristic features. The finite element model developed in this work
will be able to discretize particles by considering them as three-dimensional deformable
bodies of revolution. The model will also be helpful in understanding the interaction
behavior between nonspherical particles, and its dependence on particles’ geometry and
orientation. It will also be useful in studying the interface dynamics of granular chains
and adjacent linear elastic media, which can be a viable and useful tool in the future to
numerically study the NDE/SHM of complicated structures using granular chains as an
actuator/sensing device.
For practical applications, we will also study dissipative losses in uniform granular chains
Figure 1.1: Schematic diagram of nonlinear granular chain as an automated impact actuator inside of a satellite. The reflected waves from the interface will be used to monitor the structure and to detect buried defects/impurities and other boundaries’ conditions.
in our finite element model using linear Rayleigh damping parameters. For cases
un-der certain circumstances where we can use DPM, which can be helpful in quick results,
especially under one-dimensional assumptions, the goal will be to develop an analytical
model with dissipative terms included, such that it should be capable of predicting,
quan-titatively and qualitatively, the dissipative HNSW’s propagation in granular chains. As
mentioned above, to understand and extend the tuning nature of HNSWs, the work will
be to study the uniform chain of nonspherical particles. We used nonspherical particles,
namely ellipsoidal and cylindrical particles, to study the effect of particles’ geometry and
orientation on the contact interaction, and also on wave dynamics in the system, as
com-pared to the chain of spherical particles. We verified the change in the wave characteristic
for non-spherical particles through experiments.
We systematically investigated the wave localization at the interface of nonlinear granular
media with the linear elastic media by using cylindrical specimens of different materials
and geometry as adjacent wall medium to granular chain. From a practical-application
point of view, we also studied the layered cylinder as a simplistic assumption to composite
media, as well as large thin plates of different thickness and boundary conditions. The
results obtained from this interaction study show that the information carried by the
reflected waves from the interface is sensitive to the bounding media. We found that
the magnitude of the reflected waves decreases with the decrease in the aspect ratio.
We also found that there exists a critical distance from the plate boundary, after which
distance between impact point and plate boundary. In many physical applications, such
as airplanes’ wings, cars, ships, etc., the body is made of plate/composite-like structures,
which was the motivation to study thin plate-like structures.
1.2
Outline of Thesis
In this chapter, we provide a basic review of granular particles’ contact theory, wave
propagation in discrete particle system, and highly nonlinear wave dynamics in discrete
Hertzian chains.
Chapter2describes the experimental setup used during the course of this research.
Chap-ter 3describes the finite element model developed to simulate the dynamics of a chain of
granular particles as three-dimensional deformable bodies. We also compared our FEM
results with experiments and the traditional discrete particle simulations and found a good
agreement between them. Chapter 4 discusses the effects of dissipation in the HNSW’s
propagation in the chain of granular particles, the analytical model and the finite element
model, all developed to incorporate the energy losses during wave propagation. The study
of dissipation in granular chains is helpful for using a nonlinear actuator in practical
ap-plications. In Chapter 5, using FEM, we study contact interaction between particles of
various geometries. We use this interaction law to analytically and numerically test the
dynamics of chains composed of nonspherical particles. We also verify these effects using
experiments and find very good agreement.
In Chapter 6, we experimentally and numerically study the coupling of nonlinear media
with linear elastic media, such as cylindrical rods and thin plates. From this study, we
learn that the interface dynamics are sensitive to the adjacent media, which leads to the
formation of multiple reflected HNSWs in granular chains. The nature and number of
1.3
Granular Particles
By granular material, we refer to an aggregate of discrete macroscopic particles, the sizes
of which are comparable to the size of the total system, and usually large enough that the
thermal motion fluctuations can be neglected. Many researches, including de Coulomb
(1776),Faraday(1831), and Reynolds(1885) studied various properties of granular parti-cles and provided helpful information in the early development of this field. Richard et al.
(2005), a material scientist, mentioned in his paper that granular materials are ubiqui-tous in nature and are the second most manipulated material in industry (the first being
water). These particles can be found easily in nature and in many industrial applications.
For example, sand and raw materials (grain, ore, and sugar) represent the basic form of
granular particles found in nature. Powders, such as calcium propionate (calcium salt),
a white particle-line solid, are widely used as preservatives for a wide range of baked
goods in industry. Soda ash powder is another form of granular particle used widely in
chemical industries, such as glass and paper manufacturing, among several others.
Bear-ings, another form of simple yet important granular particle, can also be found in many
mechanical machines, cars, bicycles, motors, aircraft, etc. Figure 1.2 shows an example
of natural and industrial granular particles.
The importance and uniqueness of these granular particles stem from the understanding
that they behave differently than the standard states of matter, i.e., solid, liquid, and
gas (Duran, 2000). Conventional liquid and gas follow Brownian motion during mixing
process, whereas the granular particles behave differently and the process typically results
in segregation. When the granular particles are non-cohesive, the repulsive component
is the dominant interaction force between them, because of which the effective particle
shape also depends on external boundaries, gravity, and other parameters. On the other
hand, when the granular particle surface is non-adhesive, for several static and dynamic
conditions the interstitial fluid present can be neglected.
1.3.1
Hertz’s Law
In our study, we used granular particles of non-conforming geometrical shapes and
pri-marily influenced by Hertz contact law interaction (Hertz, 1882). When two of these particles approach each other under no external loading, the initial contact made between
their surfaces is the point of contact (or possibly a line contact). Hertz (1882) published the first paper “Contact between solid elastic bodies,” describing the local elastic
defor-mation relation between two spherical particles. Since then, Hertz’s law has been used
extensively in various fields of contact mechanics, such as for wheel-rail contact, metal
forming, gasket seals, etc.
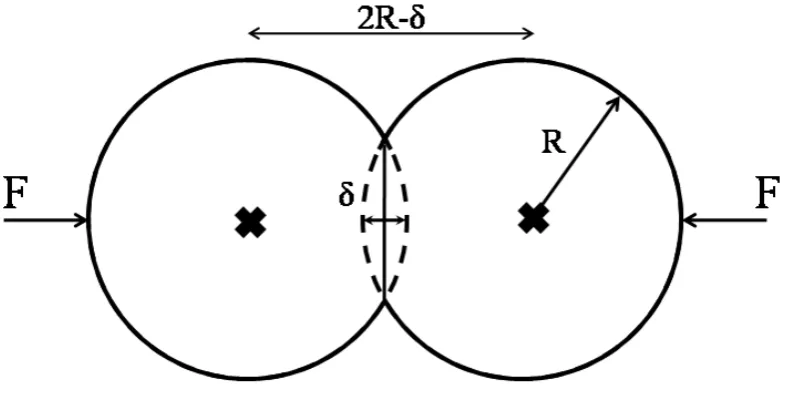
Hertz considered two identical spherical particles of radius R with the assumption that
[image:34.595.115.508.528.730.2]both of the particles are topographically smooth on macro and micro scales, so that the
elastic wave’s motion in the particle can be neglected, and that the tangential surface
interaction between the particles is frictionless. Figure 1.3 shows the schematic of two
particles in contact under compressive forceF. When these particles are pressed against
each other towards the contact point O, with the relative approach between the distant
points of two particles asδ =δ1+δ2, whereδ1, δ2 represents the displacement of distant
point for particles 1 and 2, respectively, such that δ > 0 for compression and δ < 0 for
tension, the particles deform locally at the point of contactO and form a circular contact
area. Due to the material’s nature to return to its original shape, a repelling force is
developed between the two particles. It is assumed that the radii of curvatures of the
contacting particles are large as compared to the radius of contact circle, which results in
small deformation and, combined with stiff materials, the problem is considered as linear
elastic. The problem is also considered as elasto-static, i.e., the material interaction is
linear elastic and the two particles are in static equilibrium such that the displacementδ
is independent of time. With these assumptions, the interaction force derived by Hertz
for two spherical particles is (Hertz, 1882; Johnson, 1987)
F(δ) =
kδ3/2 if δ >0
0 if δ <0
(1.1)
wherek= 3(12E−ν2)
q
R1R2
R1+R2 is the spring constant between the particles during compression.
R1 andR2 are the radii of the particles, and E and ν are Young’s modulus and Poisson’s
ratio, respectively, for the particle’s material. F, the compressive force between the
particles, is considered positive in compression (δ >0) and zero in tension (δ <0). During
the compression process, the force is initially weak as compared to linear or harmonic
spring force for small values of δ, and it rises sharply when the δ value is increased as
compared to linear spring force. This is because the interaction force in the Hertz model
is proportional to theδ3/2, a complete nonlinear contact interaction behavior between two
spherical particles which results from the geometrical effects only, and the proportionality
relation depends on the contact geometry of the two particles. A detailed generalization
of the Hertz contact law was developed bySpence(1968), which describes the interaction of two particles of arbitrary axisymmetric contact surface. Spence calculated the stress
interaction force between the particles. For a more specific case, when the interacting
particles are cube or conical shaped, the interaction force is proportional to δ and δ2,
respectively (Fu,2007). Thus, using particles of different geometry, the contact interaction relation can be modified for a specific response.
1.4
Linear Waves in Discrete Media
Wave propagation in discrete particle media has been a topic of study for a long time.
The classical book titled Wave Propagation in Periodic Structures by Brillouin (1946) covers the detailed review of waves in periodic structures. Newton (1729) first worked on one-dimensional lattice while he was trying to derive a formula for the velocity of sound
in air. In his work, he considered the simple case of a one-dimensional lattice system
as an equally spaced point mass (m) system connected to the neighboring points, with
elastic spring constant C placed uniformly at d distance apart (Figure 1.4). The particle
at the location s is affected by the displacement of the particle at location s +p, such
that the force on the particle at location s is proportional to the relative displacements
of the two particles us+p −us. For simplicity, only the first-order approximation up to
the interaction of nearest-neighbor point is considered, i.e., s±1. Using this approach, Newton derived the force experienced by the particle at locations as
F =U0(us+1−us)−U0(us−us−1) (1.2)
whereU is the interaction potential andF is the force experienced by the particle at
loca-tion s. Using this relationship, the theoretical elastic wave velocity obtained by Newton
was V = dpC/m in the air. Although, the theoretical wave speed calculated from this
formula was lower than the experimental values, because sound waves in the air propagate
under the adiabatic process, which was pointed out by Laplace in 1822, the wave velocity
from Newton’s formula under adiabatic assumptions is in excellent agreement with the
experiments.
with N point masses has exactly N independent modes of vibration. Due to the
dis-creteness of the system, the infinitesimal waves of arbitrary spatial frequencies cannot
propagate, and therefore there is a corresponding upper bound on the temporal
frequen-cies that the chain can support. This property allows nonlinear oscillations to avoid
resonances with small-amplitude waves, and localized oscillations can persist without
ra-diating energy. Later in 1753, Daniel Bernoulli proved the principle of superposition of
normal modes in a discrete point mass system, which is a special case of Fourier series.
In the nineteenth century, several researchers including Cauchy, Baden-Powell, Kelvin,
Einstein, and von Karman adopted Newton’s model to study various optical wave
phe-nomenon, such as dispersion, cutoff frequency, mechanical filter, etc. In their model, they
assumed that the coordinate of the particle at the location s can be written as
us =sd+ψs (1.3)
whereψs is the displacement of the particle ats from its equilibrium position. Assuming
harmonic traveling waves in the discrete system, ψs =Aei(ωt−ks), where ω, k, and A are
the wave frequency, wave number, and wave amplitude, respectively. The wave equation
has the solution given by
ω2 ∼= 4C
m sin
2
1 2ka
. (1.4)
Thus, a periodic discrete particle system supports only the unique solutions, which are
periodic in k, with the limitation that the shortest wave length is twice the distance d
between particles, and therefore the system has a natural critical, or cutoff, characteristic
frequency.
1.5
Nonlinear Waves in a One-Dimensional Chain of
Granular Particles
Nesterenko (1983) considered a one-dimensional chain composed of spherical granular particles, governed by Hertz’s contact interaction Equation (1.1) between neighboring
particles (Figure 1.5) and discovered the formation and propagation of highly nonlinear
solitary waves in the chain. A system of equation describing the motion of each particle
in a one-dimensional chain of identical particles, where the spring constant is given by
Eq. (1.1), is
¨
us =A(δ0−us+us−1)3/2−A(δ0−us+1+us)3/2 (1.5)
whereu is the displacement of the particle at location s from its static displacement
be-cause of the imposed force, and A = k/m = 3m(1E√−2Rν2) is a factor based on the particle’s
properties. Equation (1.5) is an example of a Fermi-Pasta-Ulam (FPU) (Fermi et al.,
1965) system, which is an important class of system of coupled oscillators. These systems have been extensively studied in nonlinear science for their intriguing wave propagation
behavior and connections to solitons. Nesterenko considered the chain under an initial
static compressive force F0, which leads to an initial overlap of δ0 between any two
par-ticles. This equation supports two different dynamic wave propagation regimes based on
initial strain of the system (Nesterenko, 2001). In the first regime, when the chain is under a large static compressive load (large with respect to the amplitude of the dynamic
excitationsFstaticFdynamic), which results in |us+1−us|
δ0 1), the system acts as a linear
or weakly nonlinear wave medium. In the long wavelength anharmonic approximations,
Eq. (1.5) can be simplified into the nonlinear Korteweg-de Vries equation (Korteweg and Vries,1895).
In the second regime, when the chain is uncompressed or very weakly precompressed
(Fstatic . Fdynamic, resulting in |us+1δ0−us| & 1), the system presents a highly nonlinear
wave dynamic behavior. In this regime, the initial compression δ0 can be neglected as
compared to the displacement of neighboring particles under the dynamic excitations.
Using the long-wavelength approximations, the displacement at the neighboring particles
can be written in power series about the center points
us−1 = u−ux(2R) + 1/2uxx(2R)2−1/6uxxx(2R)3+ 1/24uxxxx(2R)4+... us+1 = u+ux(2R) + 1/2uxx(2R)2−1/6uxxx(2R)3 + 1/24uxxxx(2R)4+...
(1.6)
Substituting these values into Eq. (1.5), after simplification an analytical approximation
is obtained, which is given by
utt =−c2
(−ux)3/2+ a2
10
(−ux)1/4 (−ux)5/4
xx
x
, (1.7)
whereuis the displacement,a = 2R is the particle’s diameter, the subscripts indicate the
derivatives, and the strain is ξ =−ux, such that ξ ≡ −ux >0,c is a material’s constant
given by c2 = 2E
πρ0(1−ν2), and ρ0 is the density of the particles. By looking for stationary
solution of the formu(x−V t), Eq. (1.7) has an exact solution, a highly nonlinear solitary wave (HNSW) solution, given by (Nesterenko, 1983 2001):
ξ=
5V2 s
4c2
2 cos4
√
10
5a (x−Vst)
!
, (1.8)
where Vs is the HNSW’s velocity in the chain, which is expressed as a function of the
ratio of static and dynamic force fr =Fd/F0 (Daraio et al.,2006b)
Vs = 0.9314
4E2F0 a2ρ3(1−ν2)2
1/6
1
(fr2/3−1)
4 15
3 + 2fr5/3−5fr2/3 1/2
. (1.9)
When the chain is uncompressed, Eq. (1.9) reduces to (Daraio et al., 2006b; Nesterenko,
2001):
Vs= 0.6802
2E aρ3/2(1−ν2)
1/3
From this analysis, we see that in highly nonlinear regimes the combination of
discrete-ness and nonlinearity in the chain of particles supports the formation and propagation of
HNSWs. These nonlinear waves are supersonic in nature, since the characteristic sound
speed in the system is zero (Nesterenko, 2001). The waves also have finite spatial width of approximately five particle diameters, which is independent of any system parameter
or wave amplitude. From Eq. (1.10), we see that the solitary wave speedVs is a nonlinear
function of the maximum dynamic contact forceFd. The propagation properties of these
waves can therefore be tuned by modifying the particle’s dimension and material
prop-erties (Coste et al., 1997; Daraio et al., 2006b; Nesterenko, 2001). These solitary waves can also be considered as solitons in a physically reasonable approximation (Nesterenko,
1983 2001), though small amplitude secondary solitary waves were observed in numerical calculations after collision of two identical solitary waves (Manciu et al., 2000;Sen et al.,
2008). The ratio of the largest amplitude of the secondary wave to the amplitude of the original wave is about 0.02 (Manciu et al.,2000).
After the initial work of Nesterenko on the nonlinear waves in the chain of spherical
particles in 1983, he and Lazaridi (Lazaridi and Nesterenko, 1985) showed the first ex-perimental evidence of solitary waves in the chain of spherical particles. Nesterenko’s
original work on the solitary wave propagation is based on the continuum limit of a
dis-crete particle chain under the Hertzian contact with neighboring particles, which assumes
the characteristic time of the problem is much longer than the oscillation period of the
basic shape of the elastic spherical particle. Friesecke and Wattis (1994) derived a theo-rem showing the existence of the solitary wave solution of the formun(t) =f(n−ct) for a
discrete chain having a general type of contact force between neighboring particles, where
the contact potential energy has to satisfy their theorem. Using the theorem, MacKay
(1999) proved the solitary wave solution for the chain of spherical particles interacting via Eq. (1.1). This work was extended byJi and Hong(1999) for the general case of arbitrary power-law-type contact force F ∝ δn and gave the criteria of n > 1 for the existence of
the solitary waves in this system.
In the highly nonlinear regime, the traditional linear and weakly nonlinear continuum
pursued the work numerically and experimentally and verified various wave phenomena
in these systems (Chatterjee,1999;Coste and Gilles,1999;Coste et al.,1997;Daraio et al.,
2005 2006ab; Job et al., 2005 2009; Manciu et al., 2000; Porter et al., 2008 2009; Rosas and Lindenberg, 2003;Rosas et al.,2007 2008;Sen and Manciu, 1999;Sinkovits and Sen,
1995). The unique character of asymmetric potential, tunability, and nonlinearity in the HNSW’s propagation presented many interesting new phenomena of wave formation and
propagation. When the granular particles are assembled in a linear or network-shaped
arrangement, the dual nonlinearity of the system and the heterogeneity of the scales place
Chapter 2
Experimental Setup
The first experimental study describing the observation and excellent agreement with
numerics for the formation and propagation of HNSWs in the uniform one-dimensional
chain composed of spherical beads is reported by Lazaridi and Nesterenko (1985). Zhu et al.(1996) used the optical dynamics of photoelasticity to study the entire field image of wave propagation in several different assemblies. They used particles made of
Homalite-100, a photoelastic material, and a high speed camera in their experimental study, which
was good in getting the whole field image of the wave propagation, but imposed limitation
on the material properties of the particle that could be used in the experiments. Also,
direct force information for this setup is not available. Coste et al. (1997), and Coste and Gilles(1999) used force sensors on the chain, perpendicular to the axis of the chain. These sensors were able to measure transverse deformation of the particles and were thus able
to calculate the flight time of the wave, but they were not able to determine wave shape.
The experimental setup used to study nonlinear waves in granular particles has improved
since the first successful experiment reported for nonlinear waves in granular particles.
Daraio et al. and other researchers (Daraio and Nesterenko, 2006; Daraio et al., 2005 2006b;Job et al.,2005) in recent times have reported successful experimental observation of HNSWs’ propagation in the chain of spherical particles and used their setup to study
various properties of wave propagation in these chains.
This chapter describes the experimental setups designed during the course of my PhD to
coupling of granular media with the linear elastic media.
2.1
Granular Particles Used in Experiments
We used uniform spherical particles (Figure 2.1a) of R = [2.38,4.76,9.53] ±0.01 mm obtained from McMaster Carr for different sets of experiments. Table 2.1 shows the