Grinding surface roughness measurement based on the
co-occurrence matrix of speckle pattern texture
Rong-Sheng Lu, Gui-Yun Tian, Duke Gledhill, and Steve Ward
Surface speckle pattern intensity distribution resulting from laser light scattering from a rough surface contains various information about the surface geometrical and physical properties. A surface roughness measurement technique based on the texture analysis of surface speckle pattern texture images is put forward. In the surface roughness measurement technique, the speckle pattern texture images are taken by a simple setup configuration consisting of a laser and a CCD camera. Our experimental results show that the surface roughness contained in the surface speckle pattern texture images has a good monotonic relationship with their energy feature of the gray-level co-occurrence matrices. After the measurement system is calibrated by a standard surface roughness specimen, the surface roughness of the object surface composed of the same material and machined by the same method as the standard specimen surface can be evaluated from a single speckle pattern texture image. The robustness of the character-ization of speckle pattern texture for surface roughness is also discussed. Thus the surface roughness measurement technique can be used for an in-process surface measurement. © 2006 Optical Society of America
OCIS codes: 120.6660, 110.6150, 120.0120.
1. Introduction
Surface roughness measurement is very important for production quality control, for surface roughness of parts can significantly affect their friction, wear, fatigue, corrosion, tightness of contact joints, and positioning accuracy, etc. It has been investigated ex-tensively to develop suitable techniques. The compre-hensive reviews are contained in Refs. 1 and 2. Among them, the most common measurement techniques would be contact stylus, optical interferometry, micros-copy, light scattering, laser speckle, etc., with the ma-jority of them capable only of being used for off-line measurement. Stylus instruments, for example, are inherently slow in operation, though they yield accu-rate results, and may yield scratches on a surface, and optical interferometry and microscopy are often used for very fine surface off-line measurements. Fortu-nately, the measurement technique using light speckle techniques may be a good solution for on-line surface
roughness measurements. An instrument based on such a technique would offer an alternative to conven-tional mechanical stylus instruments to overcome their drawback and provide the means for automated in-process measurements.3Over the decades, since the
invention of lasers, researchers have discussed the re-lationships between surface roughness and speckle pattern statistical properties as a new method for off-line as well as on-line surface measurements. Using the different properties of speckle fields and the different setup of optical systems, researchers have also developed a variety of speckle methods for surface roughness measurements. For instance, sur-face roughness measurements may be implemented by the speckle pattern illumination methods,4,5 the
speckle contrast methods,6and the speckle correlation
methods.7Surface roughness measurement by means
of speckle pattern illumination is convenient to deter-mine rms roughness in the submicrometer range but requires a complicated optical illumination system consisting of a diffuser and a lens.5The speckle
con-trast methods, which are based on the first-order sta-tistics of surface speckle patterns, can usually evaluate surface roughness values less than Ra ⬍ 0.3m.
Speckle correlation methods, which are based on the second-order statistics of surface speckle patterns, may work on surface roughness Ra between 1 and
30m. However, they often need two speckle pattern images, which may be obtained by one of the follow-R.-S. Lu ([email protected]) is with the School of Instrument Science
and Opto-electronic Engineering, Hefei University of Technology, China. G.-Y. Tian, D. Gledhill, and S. Ward are with the School of Computing and Engineering, University of Huddersfield, UK.
Received 22 March 2006; accepted 7 July 2006; posted 26 July 2006 (Doc. ID 69115).
ing methods: changing the incident light angle from the surface,8 rotating the surface to be measured,9
using two laser light beams.10Such correlation
meth-ods are difficult to use for the in-process surface roughness measurement of moving objects, except for using two-laser light illumination.
A surface speckle pattern, which is a grainy structure in the space produced by scattered light from a rough surface when illuminated by coherent light, contains rich information about the surface fine geometrical properties, such as the surface roughness. The speckle pattern images taken by an image sensor present texture form. The surface roughness information immersed in the speckle pattern images may be extracted by texture analy-sis. Surface roughness extraction by means of texture analysis has been explored by some research-ers. Gadelmawla,11for example, has investigated the
surface roughness characterization method using the gray level co-occurrence matrix of surface texture im-ages, which are captured by a vision system. Chang and Ravathur12 characterized surface roughness
from the texture images of very roughened surfaces using multiresolution wavelet decomposition. The surface roughnessRarange in their experimental
in-vestigation covers ⬃20 – 600 m. Other surface roughness characterization methods by means of sur-face texture image analysis are contained in Refs. 13–16. However, very little literature about surface roughness characterization, directly from speckle pattern texture images using texture analysis, can be found.
In this paper, we will investigate the statistical prop-erties of speckle pattern texture from the point of view of computer texture analysis and introduce a simple method for characterizing a grinding object’s surface roughness from a single laser speckle pattern image, which is taken by a simple configuration setup consist-ing of a laser and a CCD camera. The surface rough-ness is extracted by using the gray-level co-occurrence matrix (GLCM) of the speckle pattern texture image and quantized by the features of the GLCM. Though there are many parameters that can be used to char-acterize surface roughness, this paper will concentrate on the relationship of the parameter Ra with the
GLCM from speckle images due to the paper length limitation. The merit of the surface roughness eval-uation method depicted in the paper is that it is easily carried out and is useful for in-process surface rough-ness inspection.
2. Theory and System Setup Configuration
The basic configurations of the setup for surface roughness measurements by means of speckle pat-tern images are shown in Fig. 1. In Fig. 1(a), the speckle pattern formed in free-space geometry is called objective speckle. Alternatively, the speckle pattern that is formed by collecting the scattered light with a lens and focusing it onto a screen is called subjective speckle pattern as shown in Fig. 1(b). The
size of speckles, a statistical average of the distance between adjacent regions of maximum and minimum intensity is given by17
z⫽1.22L
D, (1)
[image:2.603.311.541.41.154.2]where is the wavelength of the laser light, ⫽ 1 for objective speckles, and ⫽共1⫹M兲for subjective speckles, where M is the lens magnification. Other geometrical parameter meanings are shown in Fig. 1. In our research, we adopt the Fig. 1(a) setup con-figuration for convenience, to obtain a proper size of speckle pattern and investigate the influence of the distanceLvariations on surface roughness evalua-tion. The setup is built with a digital camera and a 35 MW diode laser with a wavelength of 660m, the power of which can be adjusted to avoid the digital camera signal saturation. The camera is located in the specimen normal direction. The angle between the incident laser light beam and the normal direc-tion is fixed to be as small as practically possible to reduce the effect of the direction of surface micostruc-ture in the surface roughness evaluation. In the setup, the angle is ⬃10°. By means of the simple setup, different speckle pattern images from stan-dard grinding surface roughness specimens are ob-tained. The speckle pattern texture images against
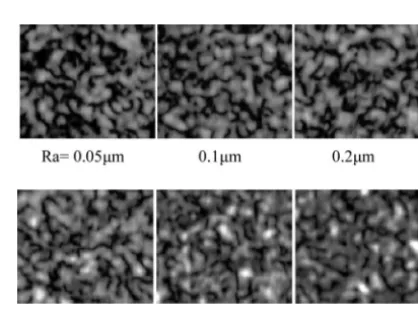
[image:2.603.321.530.541.696.2]Fig. 2. Speckle pattern variations against the specimen surface roughness.
surface roughness Ra values are shown in Fig. 2.
From left to right of the images, it is apparent that the speckle pattern contrast becomes weaker and the image signal approaches saturation with the surface roughness Ra increasing. This implies that
the speckle pattern texture properties change with the surface roughness, and it is possible to extract the surface roughness from the speckle pattern texture images using texture analysis.
3. Computation of the Speckle Pattern Texture Co-occurrence Matrix
Information extraction from texture images can be accomplished by different texture analysis meth-ods, which are classified into four categories: sta-tistical methods, geometrical methods, model-based methods, and signal processing methods.18 A
dis-cussion of their relationships and applications are given in Ref. 19, including a second-order statistics feature for texture representation.20 Here we will
investigate the surface roughness evaluation method using the gray-level co-occurrence matrix, which be-longs to the statistical methods. The reason it is chosen is that the gray-level co-occurrence matrix is based on second-order statistics, which deal with the spatial relationships of pairs of gray values of pixels in texture images.
The texture image gray-level co-occurrence matrix indicates how often pairs of gray levels of pixels, which are separated by a certain distance and lie along a certain direction, occur in a texture image, as defined in Ref. 21. Let a digital texture image be f:Lx ⫻ Ly→G, with horizontal and vertical spatial
domains:Lx⫽兵0, 1, . . . ,nx其andLy⫽兵0, 1, . . . ,ny其,
respectively, and the gray levels G ⫽ 兵0, 1, . . . ,m
⫺ 1其. Let an offset dbe the distance that separates two pixels, whose positions are 共x1,y1兲 and 共x2,y2兲,
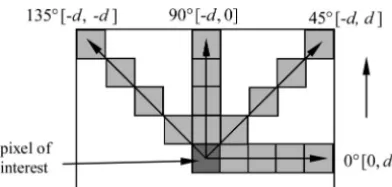
respectively, and whose gray values are iand j, re-spectively.d⫽1 means the pixel pairs are neighbor-ing pixels,d⫽2 means pixel pairs are separated by one pixel, and so forth. If giving four angles (direc-tions) of ⫽0°, 45°, 90°, and 135° as shown in Fig. 3, along which the pairs of pixels lie, thus for a fixed offset distance d, one obtains the four co-occurrence matrices P0,P45,P90, andP135, which are defined as
follows:
P0⫽关p0共i, j兲兴, i⫽0, . . . , m⫺1, j⫽0, . . . , m⫺1,
(2)
wherep0共i,j兲is the cardinality of the set of pixel pairs
having the properties that
f共x1, y1兲⫽i, f共x2, y2兲⫽j,
ⱍ
x1⫺x2ⱍ
⫽d, y1⫽y2. (3)For the definition ofP45, one has to replace condition
(3) by
兵共x1⫺x2⫽ ⫺d兲 共y1⫺y2⫽ ⫺d兲 共x1⫺x2⫽d兲 共y1⫺y2⫽d兲. (4)
The computational example of the gray-level co-occurrence matrix P0 is illustrated in Fig. 4, where
the image sizenx⫻ny⫽4⫻5, maximum gray level
m⫺ 1⫽7, and offsetd⫽ 1.
A co-occurrence matrix is capable of texture anal-ysis by using texture features extracted from GLCM. Haralicket al.21suggested 14 textural
fea-tures that can be used. Here, we chose four feafea-tures, contrast, correlation, energy, and homogeneity, for speckle pattern texture analysis. The contrast fea-ture measures the local variations in the gray-level co-occurrence matrix; correlation measures the joint probability occurrence of the specified pixel pairs; en-ergy, which is also known as uniformity or the angu-lar second moment, provides the sum of squared elements in the GLCM; and homogeneity measures the closeness of the distribution of elements in the GLCM to the GLCM diagonal. They are defined as follows:
Pnormalized⫽关p⬘共i, j兲兴⫽
1
兺
i⫽0 m⫺1兺
j⫽0 m⫺1p共i, j兲关
p共i, j兲兴, (5)
then the four features are
Contrast:
兺
i⫽0 m⫺1
兺
j⫽0 m⫺1ⱍ
i⫺jⱍ
2p⬘共i, j兲, (6)Correlation:
兺
i⫽0 m⫺1
兺
j⫽0m⫺1
冋
i⫺兺
i⫽0 m⫺1兺
j⫽0 m⫺1jp⬘共i, j兲
册冋
j⫺兺
i⫽0 m⫺1
兺
j⫽0 m⫺1ip⬘共i, j兲
册
p⬘共i, j兲冑
mi兺
⫽⫺01mj兺
⫽⫺01共j⫺ui兲2p⬘共i, j兲冑
兺
i⫽0 m⫺1兺
j⫽0 m⫺1共i⫺uj兲2p⬘共i, j兲
, (7)
Energy:
兺
i⫽0 m⫺1
兺
j⫽0 m⫺1p⬘共i, j兲2, (8)
Homgeneity:
兺
i⫽0 m⫺1
兺
j⫽0m⫺1 p⬘共i, j兲
Considering the speckle pattern texture distribu-tion in images is not homogeneous in all direcdistribu-tions, let us compute the gray-level co-occurrence matrix of the speckle pattern texture images in the following four directions with offset distancedas
and set the image gray-value scaling factor m ⫽ 256 to obtain maximum information. For each offset
关,d兴array and each texture feature in Eqs. (7)–(9), 60 feature values are obtained. If drawing the values of each feature in the four directions into the same diagram, four diagrams indicating the relationship of the features contrast, correlation, energy, and homo-geneity with the offsets are obtained. Figure 5 illus-trates the computational results, which are obtained from the image of a grinding surface with roughness Ra⫽0.1m, shown in Fig. 2. To clarify the diagrams,
each direction curve in the same diagram is sepa-rately plotted with a certain offset in the ordinate direction.
4. Surface Roughness Extraction from Texture Features
In the Fig. 5 feature diagrams, it is apparent that all four feature curves have periodical triangular wave-form components. Our experimental results show
that the periods are the same and do not change with surface roughness. Each triangular waveform is also modulated by an exponential component. The curves of co-occurrence statistic energy and homogeneity also show that the triangular waveforms severely vibrate at the beginning but attenuate with the pe-riods. They become stable after 10 periods that cor-respond to 20 pixel offsets in the speckle pattern texture images. The feature curves have not directly presented their relationships with the surface rough-ness of the samples. To be able to quantify the surface roughness from the texture feature, our experimental results show that the exponential component param-eters of the energy feature have a good relation to the surface roughness in contrast to the other three fea-ture curves. The exponential component parameters
can be obtained by fitting the energy feature curves in the four directions with the following curve equation:
y⫽y0⫹kexp
共
⫺x兾冑
兲
, (10)where xindicates the offset distanced and yis the energy feature value.
As Fig. 5 shows, in different directions the tri-angular waveforms have different amplitudes and offsets. This implies that the shapes of speckle pat-terns are not uniformly distributed in the four direc-tions. Computation of invariant features is mostly done either by using moments, through harmonic analysis, or by using the autocorrelation function (ACF).22 In contrast, a feature normalization
tech-nique is applied.23 To reduce the influence of the
variances of the amplitudes and offsets, before com-puting the exponential component parameters, the energy feature curves in the four directions are nor-malized by
y⬘⫽y⫺uy
y
, (11)
where uyand yindicate the mean value and
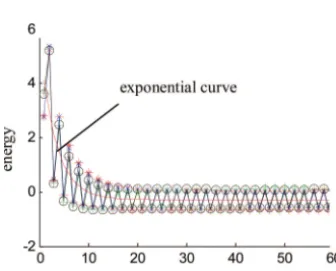
[image:4.603.71.267.37.130.2]stan-dard deviation of the feature curve valuey. The nor-malized energy feature curves of the speckle pattern texture with roughnessRa⫽0.1m are illustrated in
Fig. 6. The fitting exponential curve is also drawn in the same figure. For speckle pattern texture images from specimens with different surface roughnesses shown in Fig. 2, different fitting results can be ob-offsets关0, d兴⫽关0 1; 0 2; 0 3; 0 4; . . . ; 0 60兴,
offsets关45, d兴⫽关⫺1 1; ⫺2 2; ⫺3 3; ⫺4 4; . . . ; ⫺60 60兴, offsets关90, d兴⫽关⫺1 0; ⫺2 0; ⫺3 0 ;⫺4 0; . . . ; ⫺60 0兴, offsets关135, d兴⫽关⫺1 ⫺1; ⫺2⫺2; ⫺3⫺3; ⫺4⫺4; . . . ; ⫺60⫺60兴 Fig. 3. Co-occurrence matrix offset and its direction definition.
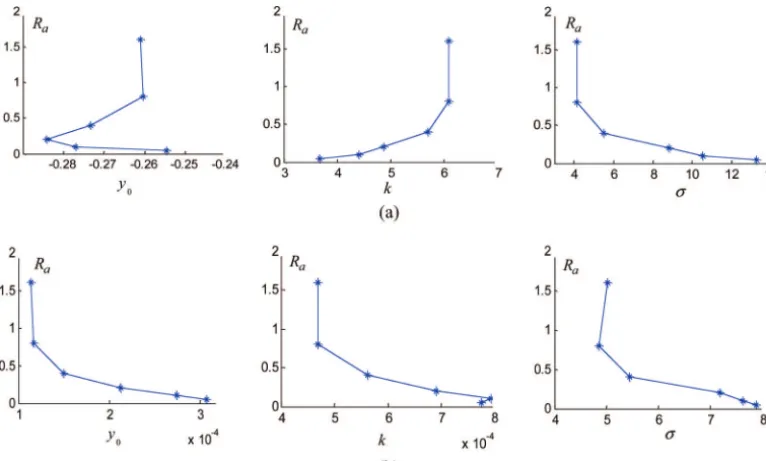
[image:4.603.64.275.598.697.2]tained. If plotting the fitting parameters against surface roughness, their relationship curves can be obtained, which are illustrated in Fig. 7. To demon-strate the effects of the normalization and nonnor-malization fitting results of the energy feature curves
on surface roughness evaluation, in Fig. 7 two kinds of computational result curves are plotted. In the following sections, we will discuss the robustness of the fitting parameters under different measurement conditions and identify which one is the best to char-acterize surface roughness.
5. Robustness of the Surface Roughness Evaluation
To test the robustness of the surface roughness evaluation method above, in this section, we will investigate the influences of the setup configuration variances, such as the laser light power, surface machining mark directions, and the distance of the surface to the observation plane.
A. Influence of the Laser Power Variance
[image:5.603.89.510.41.460.2]In the setup configuration shown in Fig. 1(a), the cam-era is a digital camcam-era, JAI CV-M8CL. The range of gray-level image signal coming from the camera is set from 0 to 255. The speckle pattern images result from Fig. 5. (Color online) Feature curves of the speckle pattern texture of the specimen surface withRa⫽0.1m.
[image:5.603.85.253.571.706.2]the laser light scattering near the surface normal di-rection. For a rougher surface, more scattered laser light goes into the camera and results in brighter speckle images. To avoid the digital camera signal be-ing saturated by the strong scattered laser light, the laser power should be set so that the largest image gray-level value coming from the roughest surface to be measured, such as the specimen surface with Ra⫽ 1.6m in our experiment, is less than 255.
To test the influence of the laser light power vari-ance, the serial speckle pattern texture images result-ing from a certain surface are captured by changresult-ing the laser light power. Figure 8 shows a small portion of texture images captured from the specimen surface with roughness Ra ⫽ 0.1m. The number beneath
each texture image indicates the maximum image gray-level value in the corresponding image after changing the laser light power. Based on the images and the surface roughness extraction method
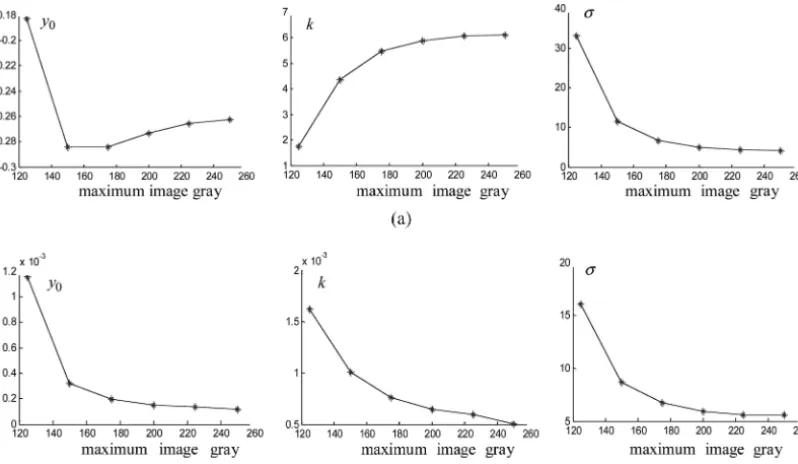
de-picted above, the exponential parameters of the energy features of the texture image gray-level co-occurrence matrix of each speckle texture image are calculated. Figure 9 illustrates the relationship be-tween the exponential parameters and the maximum image level.
Figure 9 shows that exponential parameter vari-ances caused by the unstable laser power is signif-icant during lower laser power illumination. When the maximum gray-level value of the texture im-ages is larger than 175, the parameter variances become smaller. To compare the influence when the maximum image gray-level value changes between 175 and 250, Table 1 lists the statistical computa-tional results of the exponential parameters, their mean values, standard deviations, and the percents of the deviations against the mean values. To find which parameter is the best one to formulate the surface roughness, it is reasonable to compare the ratio of the standard deviation against the mean value in each column of Table 1. From Table 1, it is obvious that normalized parameter k is more stable with respect to the change of the laser power. Though the ratio value of the deviations against the mean values of the normalized exponential curve parameter absolute value,y0, is smallest, the
param-eter is incapable of formulating surface roughness, as shown in Fig. 9(a).
B. Influence of the Surface Distance
[image:6.603.108.491.38.268.2]For different surfaces to be measured, the distanceL between the surface and the image plane of the CCD camera, as shown in Fig. 1, may be difficult to keep constant, particularly in on-line inspection. To inves-tigate the influence of the distance variance on the surface roughness evaluation, a series of speckle pat-Fig. 7. Relationship between surface roughness and energy feature curve-fitting parameters. (a) Normalized computational results, (b) nonnormalized computational results.
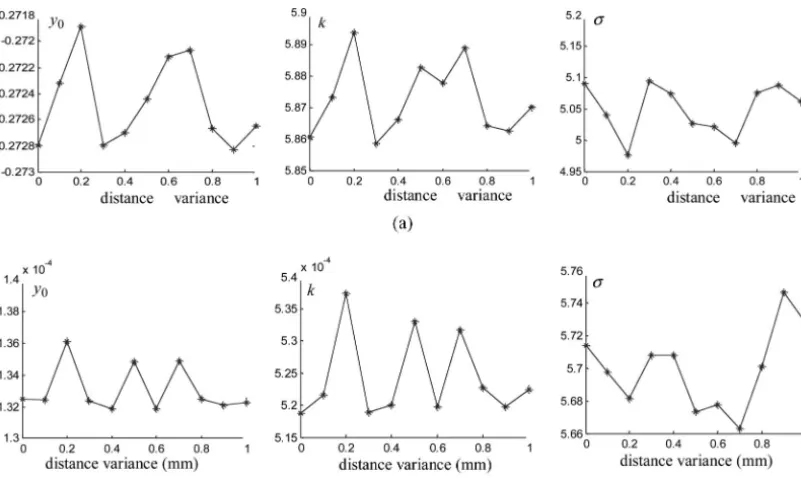
[image:6.603.59.279.547.697.2]tern texture images at different distance variances from 0 to 1 mm at the 150 mm original distance are taken. Then, to compute the relationship of the ex-ponential parameters of the energy feature with the distance variances use the same method as depicted in Section 4. The curves indicating energy features against distance variance and their statistical results are illustrated in Fig. 10 and Table 2. From Table 2, it can be found that the influence of the distance variance is very tiny compared with the influences of laser power variances, and the energy feature nor-malized parameterkis more stable, without consid-ering the smallest ratio value between the deviation and the mean values of the normalized exponential curve parameter absolute valuey0.
C. Influence of Machining Orientations
Most object surfaces machined in workshops have regular machining mark distribution. When the in-cident laser light shown in Fig. 1(a) is obliquely projected on the surface to be measured, the scat-tered light distribution near the surface normal direction will depend on the machining mark
ori-entation against the incident light. The speckle pat-tern texture images captured by the digital camera in Fig. 1(a) will change with the machining mark orientation. To investigate the influence of the ori-entation variance on surface roughness evaluation, a grinding surface specimen is rotated from 0° to 90°, and serial speckle pattern texture images are taken by the digital camera. Then, the energy fea-ture extraction is done as depicted in Subsection 5.A, and the exponential fitting parameter curves against the rotation angle are obtained. Table 3 shows the statistical values of with and without normalized techniques for feature fitting curves. The normalized parameterkseems more stable. It is inconclusive for the variations of machining di-rections. Comprehensive study for different manu-facturing direction samples with differentRawill be
undertaken in the future.
6. Discussion
[image:7.603.101.500.39.271.2]In the depiction in Section 5, it can be found that in the common four texture features extracted from Fig. 9. Influence of the laser power on the energy texture feature. (a) Normalized computational results, (b) nonnormalized computational results.
Table 1. Influence of the Laser Power on the Energy Texture Feature
Gray Level
Normalized Nonnormalized
y0 k y0⫻10⫺4 k⫻10⫺4
175 ⫺0.28 5.46 6.73 1.92 7.60 6.75
200 ⫺0.27 5.88 5.08 1.51 6.42 5.91
225 ⫺0.26 6.06 4.38 1.36 5.93 5.58
250 ⫺0.26 6.11 4.16 1.17 5.03 5.63
Mean ⫺0.27 5.88 5.09 1.49 6.25 5.97
Standard deviation 0.008 0.56 1.01 0.28 0.93 0.47
[image:7.603.53.547.605.717.2]the gray-level co-occurrence matrix of speckle pat-tern texture images, only the normalized curve pa-rameters, k and , and the nonnormalized curve parameters,y0,k, and, of the exponential trend of
the energy feature waveform have a good relation-ship with surface roughness. Based on the investiga-tion of their robustness against the variances of laser power, surface distance, and surface microstructure, however, it is apparent that the normalized exponen-tial curve parameterkis more stable than the others in each case. Therefore the normalized exponential curve parameterkis the best one that can be used to characterize surface roughness. The investigation in Section 5 also shows that both the variances of the laser light power and the surface microstructure orientation have significant influence. It can be
[image:8.603.100.501.37.276.2]overcome by using normalized feature fitting as in-troduced in Subsection 5.A. In addition to feature normalization, to deal with the influence of the sur-face microstructure, the oblique angle of the inci-dent laser light should be set as small as practical. If we insert a splitter on the way between the cam-era and the surface to be measured and let the laser light beam emit on the surface vertically, the influ-ence may be removed. The investigation in Subsec-tion 5.B also shows that the influence of the surface distance to the camera image plane during a 1 mm small range is negligible. This property makes the surface roughness measurement method very effec-tive for the in-process surface measurement in the circumstance where the surface position is inter-rupted by vibrations.
Table 2. Influence of the Distance Variance on the Energy Texture Feature
Normalized Nonnormalized
y0 k y0⫻10⫺4 k⫻10⫺4
Mean ⫺0.27 5.87 5.05 1.33 5.24 5.70
Standard deviation 0.0003 0.011 0.04 0.01 0.06 0.23
Standard deviation兾mean 0.12% 0.19% 0.76% 1.57% 1.19% 0.41%
Table 3. Influence Caused by the Surface Microstructure Orientations
Normalized Nonnormalized
y0 k y0⫻10⫺4 k⫻10⫺4
Mean ⫺0.28 5.46 6.72 1.53 5.69 6.37
Standard deviation 0.003 0.16 0.63 0.14 0.37 0.34
[image:8.603.49.546.536.609.2]Standard deviation兾mean 1.19% 3.01% 9.38% 9.03% 6.50% 5.34%
[image:8.603.49.548.647.718.2]7. Conclusion
We have put forward a surface roughness measure-ment technique through investigating the relation-ship between the surface speckle pattern texture and the features of the texture image gray-level co-occurrence matrix. There are many texture features that can be extracted from the gray-level co-occurrence matrix. In our research, the four com-monly used features— contrast, correlation, energy, and homogeneity—are studied with respect to sur-face roughness. As discussed, the parameter k of the normalized exponential trend curve of the en-ergy feature has a good relationship with the sur-face roughness; is more robust to the variances of the setup configuration, the position, and the ori-entation of the surface to be measured; and is the best feature parameter to characterize the surface roughness.
From the experimental results with the grinding surface roughness specimens, the surface roughness measurement technique is effective to characterize the grinding surface roughness fromRa⫽0.05m to
Ra⫽1.6m. For different object surfaces consisting
of specific material and machined by specific meth-ods, the range of the surface roughness, which can be characterized by the method, may be different. This means the surface roughness measurement tech-nique we have developed needs calibration before-hand.
In the surface roughness measurement technique, the speckle pattern texture images are taken by a very simple setup configuration consisting of a laser and a CCD camera. The parameter k of the exponential trend of the energy feature for a specific object surface is computed from only a single speckle pattern texture image of the surface. This means, after the measure-ment system is calibrated by standard specimen sur-faces, that the surface roughness of the object surface composed of the same material and machined in the same way as the standard specimen surfaces can be evaluated from a single speckle pattern texture image. The co-occurrence matrix feature is only one of the texture features. More features and their fusion will be investigated under different manufactured samples versus different roughness parameters including Ra.
In collaboration with the normalization techniques, the surface roughness measurement technique can be used for in-process surface measurements.
The authors thank the Higher Education Funding Council for England (HEFCE) and Corus for funding this work.
References
1. D. J. Whitehouse,Handbook of Surface and Nanometrology (Institute of Physics, 2003).
2. J. M. Bennet and L. Mattsson,Introduction Surface Roughness and Scattering(Optical Society of America, 1993).
3. B. Ruffing, “Application of speckle-correlation methods to surface-roughness measurement: a theoretical study,” J. Opt. Soc. Am. A3,1297–1304 (1986).
4. T. Yoshimura, K. Kato, and K. Nakaeawa, “Surface roughness dependence of the intensity correlation function under speckle pattern illumination,” J. Opt. Soc. Am. A7,2254 –2259 (1990). 5. P. Lehmann, “Surface-roughness measurement based on the intensity correlation function of scattered light under speckle-pattern illumination,” Appl. Opt.38,1144 –1152 (1999). 6. L. C. Leonard and V. Total, “Roughness measurement of
me-tallic surfaces based on the laser speckle contrast method,” Opt. Lasers Eng.30,433– 440 (1998).
7. C. Cheng, C. Liu, N. Zhang, T. Jia, R. Li, and Z. Xu, “Absolute measurement of roughness and lateral-correlation length of random surfaces by use of the simplified model of image-speckle contrast,” Appl. Opt.41,4148 – 4156 (2002).
8. G. S. Spagnolo, D. Paoletti, A. Paoletti, and D. Ambrosini, “Roughness measurement by electronic speckle correlation and mechanical profilometry,” Measurement 20, 243–249 (1997).
9. S. L. Toh, C. Quan, K. C. Woo, C. J. Tay, and H. M. Shang, “Whole field surface roughness measurement by laser speckle correlation technique,” Opt. Laser Technol.33,427– 434 (2001). 10. C. Joenathan, R. Torroba, and R. Henao, “Surface roughness effects in dual beam illumination speckle interferometers— theoretical study,” Optik112,163–158 (2001).
11. E. S. Gadelmawla, “A vision system of surface roughness characterization using the gray level of co-occurrence ma-trix,” NDT & E Int.37,557–588 (2004).
12. S. I. Chang and J. S. Ravathur, “Computer vision based on no-contact surface roughness assessment using wavelet transform and response surface methodology,” Qual. Eng.17,
435– 451 (2005).
13. R. Kumar, P. K. Kulashekar, B. Dhanasekar, and B. Ra-mamoorthy, “Application of digital image magnification for surface roughness evaluation using machine vision,” Int. J. Mach. Tools Manuf.45,228 –234 (2005).
14. M. B. Kiran, B. Ramamoorthy, and V. Radhakrishnan, “Eval-uation of surface roughness by vision system,” Int. J. Mach. Tools Manuf.38,685– 690 (1998).
15. G. A. Al-kind, R. M. Baul, and K. F. Gill, “An application of machine vision in the automated inspection of engineering surfaces,” Int. J. Prod. Res.30,241–253 (1992).
16. C. Lee and Y. J. Chao, “Surface texture dependence on surface roughness by computer vision,” in IEEE International Con-ference on Robotics and Automation (IEEE, 1987), Vol. 4, pp. 520 –524.
17. J. C. Dainty, ed., Laser Speckle and Related Phenomena, Vol. 9 of Topics in Applied Physics (Springer-Verlag, 1984). 18. M. Tuceryan and A. K. Jain, “Texture analysis,” inHandbook
of Pattern Recognition and Computer Vision,2nd ed., C. H. Chen, L. F. Pau, and P. S. P. Wang, eds. (World Scientific, 1998), pp. 207–248.
19. X. Liu and D. Wang, “Texture classification using spectral histograms,” IEEE Trans. Image Process.12,661–570 (2003). 20. S. H. Ryu, D. K. Choi, and C. N. Chu, “Roughness and texture generation on end milled surfaces,” Int. J. Mach. Tools Manuf.
46,404 – 412 (2006).
21. R. M. Haralick, K. Shanmugam, and I. Dinstein, “Texture features for image classification,” IEEE Trans. Syst. Man Cybern.3,610 – 621 (1973).
22. J. Brochard, M. Khoudeir, and B. Augereau, “Invariant feature extraction for 3D texture analysis using the autocorrelation function,” Pattern Recogn. Lett.22,759 –768 (2001). 23. G. Finlayson, S. Hordley, G. Schaefer, and G. Y. Tian,