2017 International Conference on Mathematics, Modelling and Simulation Technologies and Applications (MMSTA 2017) ISBN: 978-1-60595-530-8
Impact of the Wind Drag Coefficient on Numerical Simulation of
Storm Surge in Bohai Sea
Yu-mei DING
School of Science, Tianjin University of Science & Technology, Tianjin 300457, China
Keywords: Storm surge, Wind drag coefficient, Numerical simulation, Bohai Sea.
Abstract. Wind stress is the main force power of the storm surge. The wind drag coefficient has decided the momentum transmission from air to the sea. In storm surge simulation, the formation and the propagation of storm surge changes with different wind drag coefficient. A series of numerical experiments are performed to study the impact of wind drag coefficient on storm surge. The result indicates that it is in good agreement with the observed data in the storm surge simulation using the wind drag coefficient by Garratt (1977) in Bohai Sea.
Introduction
Bohai Sea is one of the serious areas effected by the storm surge in the world. It will be threatened by extratropical storm surge in Spring and Autumn and often be attacked by tropical storm surge in Summer. The mean depth is only 18 meters in Bohai Sea, so the effect of the storm surge is extremely obvious. Comparing the barometric, the wind stress is the main force power of the storm surge[1].The storm surge simulation will be affected by the setting of the wind drag coefficient[2-3].
This paper will effectively enhance the ability of the precision of the storm surge simulation and have some application value on the storm surge forecast and coastal engineering design.
The wind stress is often used as the empirical formula (1) in the storm surge simulation,
10 10U
U Cd a
s
(1) where
C
d is the wind drag coefficient,
a1.293 /kg m3is the density of the air,U
10is the windvelocity in the 10 m from the ground. The wind drag coefficient is used as the formula (2),
3 10) 10
(
a bU
Cd (2)
The precision of the storm surge would be effected by the parameterization schemes of the wind drag coefficient. In this paper, using the three-dimensional finite-volume coastal ocean model(FVCOM), the extratropical storm surge is simulated in Bohai Sea in Oct. 2003. The impact of the wind drag coefficient on numerical simulation of storm surge is studied.
Model Setting and Verification
The storm surge is simulated by the three-dimensional FVCOM ocean model. The finite volume method is used for the model calculation. It has the discrete simplicity, calculation efficiency and strong adaptability[4].The model uses triangular mesh to fit the complex coastline and is widely used
in Bohai Sea, Yellow Sea, Mexico Bay and other sea areas.
Model Setting
external time step is 3 seconds and the ratio of internal time step to external time step is 10. In this work, the ocean model has been forced by 3-hourly 10-m winds calculated by the WRF model simulation[5]. The spatial resolution is 0.1o and 0.1o in latitude and longitude, respectively. The
elevation clamped open boundary condition is given. The time-dependent water elevations consist of eight main astronomical tides, i.e. M2, S2, N2, K2, K1, O1, P1 and Q1 calculated from OTPS (OSU
[image:2.612.160.449.149.408.2]Tidal Prediction Software,http://volkov.oce.orst.edu/tides/) along the open boundary[6-7].
Figure 1. Geometry and bathymetry of Bohai Sea and Yellow Sea.
Model Verification
At first, we have tested the tide simulation. Figure 2 shows the Co-amplitude and Co-phase of M2
and K1 constituents in Bohai Sea and Yellow Sea which are in accordance well with the
observations. For the storm surge simulations, the model is driven by the wind stress from the WRF data, plus astronomical tides in Oct. 2003. The surge level is the water level outputs from the storm surge simulation minus the water level outputs from the tide simulation. A detailed validation of the hindcast against observation is presented in Figure 3, which shows the surge level simulation is in good agreement with the observation.
(a) (b)
[image:2.612.139.476.543.684.2]Figure 3. Calculated and observed surge level at Huanghua Port.
Result and Discussion
The sensitivity runs are performed for the storm surge occurring in Oct. 2003 in order to study the impact of the wind drag coefficient. The different wind drag coefficient parameterization are showed in Table 1. The result shows the simulated surge level is lower than the observation using the scheme of RM35 and Sv42. The scheme of Wu82, Ge87, YT98 aren’t fit for the simulation for the big error. Therefore, we choose the schemes of LP81[8], Ga77 [9]and Sm80 [10]to carry on the
[image:3.612.143.468.76.272.2]simulation.
Table 1. Wind drag coefficient parameterization.
Scheme a b(s/m) Velocity
(m/s)
RM35(Rossby, Montgomery,1935) 1.30 0 5.5-7.9 Sv42(Sverdrup,1942) 2.60 0 5.5-7.9 DW62(Deacon and Webb,1962) 1.00 0.07 1.5-13 Ga77(Garratt,1977) 0.75 0.067 3-21 Sm80(Smith,1980) 0.61 0.063 5-22 LP81(Large and Pond,1981) 0.49 0.065 11-25 Wu82(Wu,1982) 0.80 0.065 7.5-50 Ge87(Geermaert,1987) 0.58 0.085 5-25 YT98(Yelland and Talor,1998) 0.50 0.071 6-26
In FVCOM Model, it is often used with the scheme of Large and Pond (1981) as follows.
s m U s m U s m U s m U Cd / 0 . 25 , 10 ) 0 . 25 065 . 0 49 . 0 ( / 0 . 25 / 0 . 11 , 10 ) 065 . 0 49 . 0 ( / 0 . 11 , 10 ) 0 . 11 065 . 0 49 . 0 ( 10 3 10 3 10 10 3 (3) The schemes of Garratt and Smith are showed as formulas (4) and (5)
s m U
s m U
s m U
s m U
Cd
/ 0 . 22 ,
10 ) 0 . 22 063 . 0 61 . 0 (
/ 0 . 22 /
0 . 5 , 10 ) 063 . 0 61 . 0 (
/ 0 . 5 ,
10 ) 0 . 5 063 . 0 61 . 0 (
10 3
10 3
10
10 3
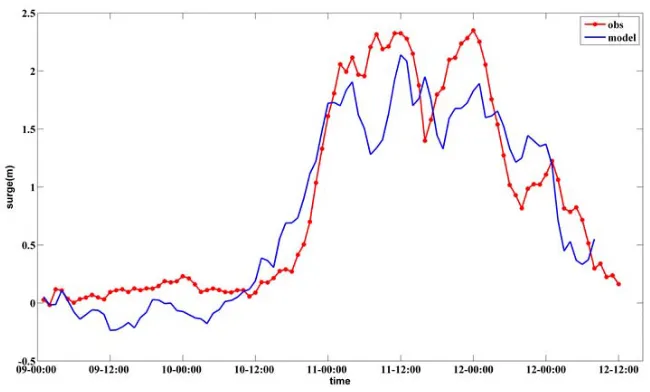
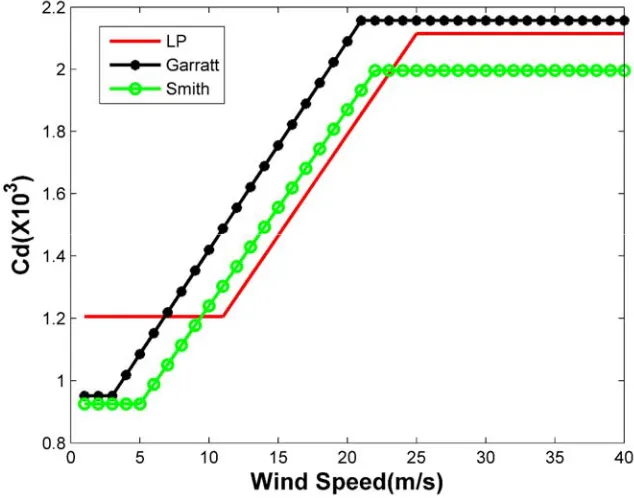
(5) Figure 4 shows the comparison of the wind drag coefficient and wind speed. The wind drag coefficient becomes more bigger in the strong wind. Comparing the scheme of Smith, the wind drag coefficient of Garratt and LP could reflect the range of the wind speed. The storm surge is simulated using the three kinds of wind drag. As showed in Figure 5, the surge level simulation is in good
[image:4.612.139.456.209.458.2]agreement with the observation, both in storm surge amplitude and phase using Garratt parameter.
[image:4.612.128.485.478.649.2]Figure 4. Comparison of three kinds of wind drag coefficient and wind speed.
Figure 5. Calculated and observed surge level at Tanggu Port with the LP and Garratt parameter respectively.
Conclusion
The results show that the surge elevations are in good agreement with the observations using the Garratt wind drag coefficient.
Acknowledgement
This work was supported by Tianjin Municipal Science of Technology Commission (Grant 15JCYBJC22400).
References
[1] Feng, S.Z. Introduction to storm surge. Science Press, Beijing. 1982, 148-149.
[2] Wang X.Q, Qian C.C. and Wang W. Test of INfluence of Wind Drag Cofficient on Typhoon Storm Surge Simulations. Journal of Ocean University of Qingdao. 2001, 31(5): 640-646.
[3] Luo J.M., Pan J., and Yang Z.Z.. Impact of the parameterization scheme about sea surface wind stress drag coefficients on numerical simulation of storm surge. Marine Forecasts. 2011, 28(3): 15-19
[4] Chen C.S., Liu H.D. and Beardsley R.C., An unstructured, finite-volume, three-dimensional, primitive equation ocean model: application to coastal ocean and estuaries. Journal of atmospheric and ocean technology. 2003, 20: 159-186.
[5] Gao, S.H., Wu, Z.M., Xie, H.Q. The developments and applications of Kalman filters in meteorological data assimilation. Advances in Earth Sciences. 2000, 15(5), 571-575.
[6] Ding Y.M. and Ding L. A numerical simulation of extratropical storm surge and hydrodynamic response in the Bohai Sea. Discrete dynamics in nature and society. 2014, 1-8. Doi: 10.1155/2014/282085.
[7] Ding Y.M. and Wei H. Modeling the impact of land reclamation on storm surges in Bohai Sea, Nature Hazards. 2017, 85(1), 559-573. doi:10.1007/s11069-016-2586-4
[8] Large W.G., and Pond S. Open ocean momentum flux measurements in moderate to strong winds. Journal of Physical Oceanography. 1981, 11: 324-336.
[9] Garratt, J.R., 1977. Review of drag coefficients over oceans and continents. Monthly Weather Review. 105(7), 915-929.