2015 3rd AASRI Conference on Computational Intelligence and Bioinformatics (CIB 2015) ISBN: 978-1-60595-308-3
A Novel Method to Estimate Yaw Rate Based on Ensemble
Empirical Mode Decomposition
Wei Chen, Xu Li
*, Qimin Xu
School of Instrument Science and Engineering, Southeast University, Nanjing, 210096, China; [email protected]; [email protected]; [email protected]
*
Corresponding author: Xu Li; [email protected]
ABSTRACT: Vehicle yaw rate is the key parameter that needs to be known by an Electronic Stability Control (ESC) system to improve the stability of the vehicle motion in emergency situations. In this paper, a novel method is proposed to estimate vehicle yaw rate which eliminates the need for the installation of conventional yaw rate sensor. In this method, yaw rate is roughly estimated by exploiting wheel speed, which is obtained from the preinstalled anti-lock braking system (ABS) wheel speed sensor. Then, a novel threshold filtering algorithm based on ensemble empirical mode decomposition (EEMD) is designed to de-noise the rough yaw rate in order to improve the accuracy of yaw rate estimation. To verify the feasibility and effectiveness of the proposed method, real road tests were performed. The results demonstrate that the proposed method has comparable performance with the gyroscope.
KEYWORDS: Active safety system; Yaw rate; EEMD; Wheel speed
1 INTRODUCTION
As automotive technology improves and road become busier, vehicle active safety systems are proposed to enhance the safety of drivers and passengers by preventing crash from happening [1]. For example, Electronic Stability Control (ESC) system, which is one of the most studied active safety system, can improve the yaw stability of the vehicle motion in emergency situations. In a handling maneuver, it can provide a control action to prevent the vehicle from under-steering or over-steering [2]. To ensure a proper operation, accurate knowledge of the yaw rate is a necessity for the ESC system [3].
To measure the yaw rate, the commonly used sensor is gyroscope. Even adopting the low-cost gyroscope based on microelectromechanical (MEMS) technology, it is still a relatively costly component of an ESC system. To lower the system overall cost, several attempts to estimate yaw rate have been reported in [4]-[7]. In references [4] and [5], yaw rate was estimated based on two lateral accelerometers. In reference [6], a Kalman filter-based method was introduced which uses lateral acceleration, vehicle velocity and steering angle to estimate yaw rate. Moreover, a Set Membership (SM) method was suggested in [7] to accurately
estimate yaw rate using lateral acceleration, longitudinal velocity, and steering angle measurements. However, these methods mentioned above all require an installation of lateral accelerometer, which will increase system complexity and limit their applications.
Alternatively, several researches have been conducted to estimate yaw rate based on wheel speed [8]-[9]. This method can further reduce the system cost and decrease system complexity due to that the information of wheel speed can be easily obtained usually via the vehicle’s Controller Area Network (CAN) bus without any additional cost when the vehicle are equipped with anti-lock braking system (ABS). Since the quality of the information of the ABS wheel speed sensor is low, the estimation of yaw rate is too noisy to satisfy the requirement of ESC system.
EMD, which is a is a complete self-adaptive data processing technique that is especially well suited for nonlinear and non-stationary signals [10]. The proposed method eliminates the need of the expensive gyroscope and allows a significant cost reduction of safety control systems, like the ESC system.
The remainder of the paper is organized as follows. Section 2 presents an overview of the method proposed in this paper. Section 3 introduces rough estimation of yaw rate based on kinematic model. The designed EEMD-based threshold filtering algorithm is discussed in detail in section 4. Section 5 describes the real road experimental results. Section 6 is devoted to the conclusion.
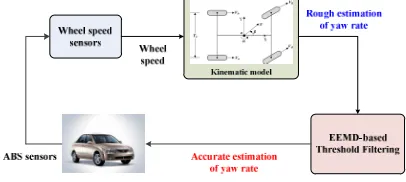
2 OVERVIEW OF THE PROPOSED METHOD
[image:2.612.368.509.210.304.2]The proposed method is composed of two steps to estimate vehicle yaw rate, i.e. the rough estimation based on kinematic model, and the accuracy improvement of rough estimation using EEMD-based filtering, as shown in Figure 1.
Figure 1. Flowchart of the proposed method.
First, vehicle yaw rate is roughly estimated based on kinematic model by exploiting the speeds of left rear wheel and right rear wheel. The wheel speed is obtained from the ABS wheel speed sensor, which is preinstalled in the vehicle. Since the measurements of ABS wheel speed sensor usually suffer from heavy noises, the accuracy of yaw rate estimation is poor and cannot meet the requirements of vehicle active safety systems.
Then, a novel threshold filtering algorithm based on EEMD is designed to eliminate the noises in rough estimation of yaw rate. In the proposed filtering algorithm, an optimal threshold selection mechanism is developed based on fractional Gaussion noise (fGn) model, and an interval threshold shrinkage scheme is introduced to perform thresholding on intrinsic mode functions (IMFs), which are obtained through EEMD. The proposed preprocessing algorithm can effectively and efficiently suppress the noises in rough yaw rate estimation, providing more accurate information for vehicle control.
3 ROUGH ESTIMATION OF YAW RATE BASED ON KINEMATIC MODEL
In this paper, the vehicle yaw rate is first estimated using vehicle kinematic model, as shown in Figure 2. In this figure, “o” is the center of gravity (CG), V is the velocity at the CG, β is the vehicle side slip angle, ω is the vehicle yaw rate, Tw is the rear track width of the vehicle. Vlf, Vrf, Vlr, and Vrr represent the velocities at the left front wheel, the right front wheel, the left rear wheel and the right rear wheel, respectively. In addition, the front wheels are steering wheels, and the rear wheels are driving wheels
Tw
Vlr
Vrr
Vlf
Vrf X
Y
β V
o
[image:2.612.76.279.328.419.2]ω
Figure 2. Vehicle kinematic model.
According to the vehicle kinematic model, we can get the following equations
cos 2
w lr
T
V =V β − ω (1)
cos 2
w rr
T
V =V β + ω (2)
Subtracting (2) from (1), the following equation can be obtained
rr lr
w
V V
T
ω= − (3)
Therefore, vehicle yaw rate can be estimated using the (3).
4 PROPOSED FILTERING ALGORITHM BASED ON EEMD
4.1 Brief review of EEMD
EMD is an adaptive signal processing method for nonlinear and non-stationary data analysis, which decomposes a signal into a set of intrinsic mode function (IMF) by their local characteristic time scales. However, the original EMD suffers from mode mixing problem. To alleviate the problem, the EEMD method was proposed.
After the processing of EEMD, the signal x(i) (i=1, 2,…, N) can be decomposed into k IMF components dM(i) (M=1, 2,…,k), and one residual component r(i)
1
( ) ( ) ( )
k
M M
x i d i r i
=
4.2 Brief review of fGn
A fractional Gaussian noise is a zero mean stationary process characterized by is determined merely by its second-order structure, which depends on a parameter H, known as Hurst parameter (0<H<1). It is a versatile model for a homogeneously spread broadband noise dominated by no specific frequency band. The distribution of fractional Gaussian noise is fully specified by its autocorrelation sequence as following [11]
2
2 2 2
( ) ( 1 2 1 )
2
H H H
H
C τ =σ τ− − τ +τ+ (5)
Where τ is the lag length and σ2 is the variance CH(τ). Particularly, when H=0.5 the fGn reduces to white noise, i.e. C 0.5(τ)= σ2 for τ=0, and C0.5(τ)=0 for all τ≠0. Therefore, fGn is the generalization of white noise. In this paper, the fGn model is used to model the noises contained in the rough estimation of yaw rate.
4.3 Optimal threshold selection criterion
Threshold selection is the one of the most important steps in the process of EEMD-based threshold algorithm. Since each IMF has different noise intensities, it will inevitably introduce greater quantizing error to the reconstructed signal if each IMF is processed by the same threshold. In addition, if the threshold is too little, the processed IMF will contain more noise component; if the threshold is too great, the real signal component will be destroyed. The selection of the threshold plays a vital role for the result of the de-noising.
To solve the problem, a level-dependent threshold selection criterion is adopted based on the variance relation among the IMFs of fGn. The IMF variance of fGn is expected to be an exponentially decreasing function of the IMF index, with a decay rate which is a simply linear function of the Hurst exponent H as expressed
2(1 )
, 2
H M
M H H
V C ρ− − M
= ≥ (6) Where VM is the variance of M-th IMF, and CH=V1/ρH(H-1) , ρH ≈2.01+0.2(H-0.5)+0.12(H-0.5)2.
According to the theory of EMD, the several low order IMFs capture most of the high frequency contents, which is commonly considered as noise. Thus, the variances of the first two IMFs, i.e. d1(i) and d2(i), can be estimated employing a robust estimator
2 ( ( ) )
, 1, 2 0.6745
M M
median d i
V = M =
(7)
As the order of IMF increases, there is more useful information contained in the IMF. Thus, it is not valid to adopt (7) to estimate the noise variances for high order IMFs. In this situation, the variances of higher order IMFs can be derived from (6) that
( 2 2)( 2)
2, 2
H M
M H
V ρ − − V M
= ≥ (8) Inspired by wavelet VisuShrink threshold, the optimal level-dependent thresholds TM can be determined by
( 1)( 2) 2
2 ln , 1, 2
2 ln
2 ln , 2
M
M M H M
H
V N M
T V N
V N M
ρ − −
∗ = = ∗ = ∗ > (9)
Where N is the length of original signal.
4.4 Interval threshold shrinkage scheme
After obtaining the thresholds, we can adopt shrinkage scheme to perform thresholding on the IMFs to remove the noise components. The most commonly used shrinkage schemes for threshold de-noising is soft-thresholding because the hard-thresholding causes discontinuity in the de-noised signal. Though soft-thresholding can maintain the continuity of the de-noised signal, it generates biased outputs, which may result in additional error sources in certain conditions. To overcome abovementioned disadvantages, a new thresholding technique is proposed as follow
sgn( ( ))( ( ) ), ( ) ( )
exp( ) ( )
0, ( )
M
M M M M
M M
M
M M
T
d i d i d i T
d i T
d i
d i T
η − ≥ − = < (10)
Where dM( )i represents the thresholded IMF, exp (.) is the natural exponential function, η is an adjustable parameter and can be arbitrary positive number. The proposed scheme is a more continuous approach which preserves the high amplitude points and has a smooth transition from noise point to important feature point. Through adjusting the parameter η, it can change from hard-thresholding to soft-thresholding. Thus, it is a compromise of hard- and soft-thresholding and can help keep the continuity and reduce the impact of a biased signal.
Due to the fact that noise mainly exits in low order IMFs, the first two IMFs, i.e. d1(i) and d2(i), are treated noise components and omitted in the process of signal reconstruction. To sum up, there are four steps to implement the proposed EEMD threshold filtering algorithm:
(1) Perform EEMD for rough estimation of yaw rate to obtain IMFs and residue.
(2) Calculate level-dependent thresholds using (9).
(3) Implement interval thresholding on IMFs according to (11).
(4) Reconstruct the de-noised inertial signal by the combination of thresholded IMFs and residue.
5 REAL ROADS TESTS AND RESULTS
5.1 Test setup
To verify the performance of the proposed method in practice, tests were conducted on a Chery SUV vehicle. It was equipped with an ABS and a MEMSIC MEMS-based VG440CA-200 inertial measurement unit (IMU) sampled at 100 Hz. The sensor accuracies (1σ) are 0.02m/s for ABS wheel speed sensor and 0.2°/s for the angular rate sensor. The yaw rate measured by VG440CA-200 IMU is used as the reference. During the experiments, all sensor data were collected using a PC104 computer which has a VxWorks operating system.
[image:4.612.339.526.59.156.2]The tests were carried out in the campus of Southeast University, Nanjing City, China. The test trajectory is shown in Figure 3.
Figure 3. Field test trajectory.
5.2 Performance of kinematic model-based method
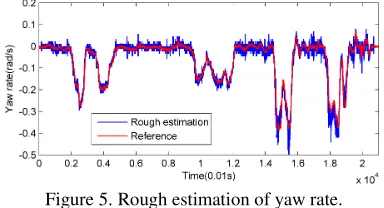
Based on the vehicle kinematic model, the yaw rate can be roughly estimated using the speeds of left rear wheel and right rear wheel. During the experiment, the vehicle operates at a low speed, around 20km/h, at the first circle and at a high speed, around 40km/h, at the second circle, which is illustrated in Figure 4. The rough estimation of yaw rate is given in Figure
5. In Figure 5, the reference value is obtained from VG440CA-200 IMU.
Figure 4. Speeds of left rear and right rear wheels.
[image:4.612.338.530.240.344.2]From Figure 5, we can find that the estimated yaw rate fluctuates around the reference value, which verifies the effectiveness of kinematic model-based method for yaw rate estimation. However, the accuracy of rough estimation is low and cannot directly used in vehicle safety applications.
Figure 5. Rough estimation of yaw rate.
5.3 Performance of EEMD-based threshold
filtering algorithm
To improve the accuracy of yaw rate, an EEMD-based threshold filtering algorithm is proposed to eliminate the noises contained in rough estimation. In order to verify the effectiveness of the proposed filtering algorithm the wavelet filter is also investigated for comparison. The wavelet filter is the
most widely used method in the accuracy enhancement of sensors. Figure 6 displays the performance of filtering based on wavelet method and the proposed filtering algorithm. Figure 6(b) and Figure 6(c) are the zoomed-in figures of the sections marked by magenta circles in Figure 6 (a). In this paper, the wavelet filter is carried out employing the wavelet function “db5” with soft thresholding scheme based on Stein’s Unbiased Risk Estimate (SURE).
From Figure 6, we can find that the wavelet method products biased results and distorts the rough estimation of yaw rate, which can be accounted for by the soft thresholding schemes it adopted. In contrast, the proposed EEMD-based threshold filter adopts the proposed thresholding scheme and can mitigate this disadvantage to some extent. As can be further observed in Figures 6 (b)
s g n ( ( ( ( ) ) ) ( ( ( ) ) ) , ( ( ) )
( ( ) )
e x p ( )
( ( ) )
0 , ( )
M
M M M M M M M
M M M
M M
M M
T
d E j d j d E j T
d j T
d j
d i T
η
− ≥
−
=
<
θ
θ θ
[image:4.612.86.299.464.630.2]and 6(c), the EEMD-based threshold filter obviously outperforms the wavelet method. The main reason is that the proposed method adopts an optimal threshold selection criterion based on fGn model.
Figure 6. Comparison of EEMD-based filter and wavelet filter.
6 CONCLUSIONS
To provide a reliable and accurate estimation of yaw rate for vehicle safety applications, this paper proposes a novel method, which can eliminate the installation of yaw rate sensor. In the proposed method, the yaw rate is roughly estimated using wheel speed based on kinematic model at first. Then, an EEMD-based threshold filter is developed to remove the noises in rough estimation.
Extensive real-world experiments have been carried out to evaluate the performance of the proposed method. The wavelet filter is investigated for comparison with the proposed filtering algorithm. The experimental results validate the effectiveness of the rough estimation based on kinematic model and the designed EEMD-based threshold filter.
7 ACKNOWLEDGMENT
This work was supported by the National Natural Science Foundation of China (Grant No. 61273236),
the Jiangsu Provincial Basic Research Program (Natural Science Foundation, Grant No. BK2010239), the Doctoral Fund for Youth Teachers of Ministry of Education of China (grant number 200802861061) and the Jiangsu Planned Projects for Postdoctoral Research Funds (Grant No. 1401012C).
REFERENCES
[1]C. L. Huang, Y. P. Fallah, R. Sengupta, and H. Krishnan, “Intervehicle transmission rate control for cooperative active safety system,” IEEE Trans. on Intell. Transp. Syst.,
vol. 12, no.3, pp.645-658, Aug. 2011.
[2]A. Høye, “The effects of Electronic Stability Control (ESC) on crashes-An update,” Accident Analysis & Prevention, vol. 43, no.3, pp.1148-1159, May. 2011.
[3] S. Niu, and W. Zhan, “Analysis of confidence lower limits of reliability and hazard rate for electronic stability control systems,” Quality and Reliability Engineering International, vol.29, no.5, pp.621-629, Mar.2013.
[4] N. Sivashankar and A. G. Ulsoy, “Yaw rate estimation for vehicle control applications,” Journal of Dynamic Systems, Measurement and Control, vol. 120, no. 2, pp. 267–274, Sep.1998.
[5] W. Chee, “Yaw rate estimation using two 1-axis accelerometers,” in Proc. the IEEE American Control Conf., Portland, Ore, USA, pp. 423–428, June 2005. [6] Z.H. Gao, “Soft sensor application in vehicle yaw rate
measurement based on Kalman filter and vehicle dynamics,” In Proc. IEEE Intelligent Transportation Systems conf., 2003, pp. 1352-1354
[7] C. Novara, F. Ruiz, and M. Milanese, “Direct identification of optimal SM-LPV filters and application to vehicle yaw rate estimation,” IEEE Trans. on Control Syst. Technol., vol.19, no.1, pp.5-17, Jan.2011.
[8] C. R. Carlson, J. C. Gerdes, and J. D. Powell, “Practical position and yaw rate estimation with GPS and differential wheel speeds,” In Proc. AVEC 6th International Symposium, Hiroshima, Japan, Sep.2002.
[9] A. Hac, and M. D. Simpson, “Estimation of vehicle side slip angle and yaw rate,” SAE Technical Paper, 2000, No. 2000-01-0696.
[10] J. Wang, R. X. Gao, and R. Yan, “Integration of EEMD and ICA for wind turbine gearbox diagnosis,” Wind Energy, vol.17, no.5, pp.757-773, Sep. 2014.