The London School of Economics and Political Science
Essays on Labour Economics
Attakrit Leckcivilize
A thesis submitted to the Department of Economics of the
London School of Economics and Political Science for the degree
of Doctor of Philosophy
2
Declaration
I certify that the thesis I have presented for examination for the PhD degree of the London School of Economics and Political Science is solely my own work other than where I have clearly indicated that it is the work of others (in which case the extent of any work carried out jointly by me and any other person is clearly identified in it).
The copyright of this thesis rests with the author. Quotation from it is permitted, provided that full acknowledgement is made. This thesis may not be reproduced without my prior written consent.
I warrant that this authorisation does not, to the best of my belief, infringe the rights of any third party.
I declare that my thesis consists of 40,133 words.
Statement of use of third party for editorial help
I can confirm that my thesis was copy edited for conventions of language, spelling and grammar by David M. Waugh.Abstract
Empirical studies in labour economics often suffer from endogeneity problems. Em-ploying exogenous variations in policies and natural shock, this thesis investigates three topics. The first two topics concern labour market phenomena in Thailand, whereas the third provides a case study of labour demand adjustment after an international supply chain shock.
Chapter 2 assesses the impact of minimum wage policy on wage inequality in Thai-land. The result is rather mixed. Although the minimum wage effectively reduces wage inequality among workers in formal sectors, it does not affect the wage distribution in the informal sector at all. The evidence suggests that such a result is mainly driven by weak law enforcement.
Meanwhile, using changes in compulsory schooling law, chapter 3 provides consis-tent estimates of the rates of return to education in Thailand. Based on the IV method, only female employees experience a positive and significant return to (upper primary) education. Interestingly, the size and direction of bias of the estimator, especially for male sub-sample, are not consistent with the conventional result. The possible reasons underlying these findings are elaborated.
Chapter 4 relies on a different type of shock. The Great Tohoku Earthquake and Tsunami 2011 is treated as an external shock to the international supply chain of Auto industry. Then I estimate the impact of the supply chain disruption on labour inputs adjustment in the US auto industry. Despite the break down in supply chain of motor vehicle parts and accessories among Japanese auto companies, these firms do not seem to reduce their labour inputs (used as a proxy for changes in production) significantly except for a small drop in average monthly earnings of workers in Japanese assembly plants.
Acknowledgements
I owe my deepest gratitude to my supervisor, Alan Manning, and my advisor, Steve Pischke, for their invaluable support and guidance.
Over the years, I have been supported by many faculty members, staffs, and friends at the LSE. I thank Guy Michaels, Gianmarco Ottaviano, Barbara Petrongolo, Veron-ica Rappoport and fellow researchers, especially in the Labour group, for their advices and insightful comments.
I would like to thank various discussants and participants in the following semi-nars and conferences: CEP/LSE Labour seminar, TDRI and Chulalongkorn seminar series, European Economic Association, International Input-Output Conference, Dan-ish International Economics Workshop, and Oxford’s Project Southeast Asia for their helpful comments.
My PhD years in LSE could not be fulfilled without mentioning my teaching and volunteering experience. I would like to thank Wendy Carlin, Ed Cobbold, Liam Graham, Neil McLean, Chris New, Hannah Starr and Mark Wilbor for providing me such opportunities and support to make me become a good teacher in some day.
Thank you Wenya and Abhimanyu, for being such good friends to me; I cannot imagine how my LSE life would be without officemates like you.
I also give my thanks to NSO, Kamphol Pantakua, P’Keng, P’Yos, P’Nong, Palm and other colleagues at TDRI for the data, comments and technical support. Special thanks go to David Waugh, who is my landlord, my friend, and my proofreader.
Thank you to many teachers and friends in the UK: P’Some, P’Suk, P’Beer, P’Aum, P’Maude, P’O, P’Tan, P’Tang, P’Warn, Tong, Mick, Pai, P’Pearl, Note, Zael, Sea, Yui, Kuck, Kaew, Fah, Aim, Kim, Alex; and outside the UK: Arjarn Yongyuth, Arjarn Somsiri, Arjarn Sirima, Arjarn Somboon, P’Jit, Bua, Jum, Oil, O, Jeab, Fa, Wat, J’Suporn, Gaew, Yui, Ice and others I do not mention their names here; for your help, the laughs and support along the way.
I am grateful to mental and spiritual support of Luang Tia’ as well as Sangha and lay communities, especially the Vipassana group, in Thailand and the UK. Their kindness and guidance, whether they aware of it or not, always help me through difficult time.
I would like to attribute my special thanks to Siriwan Santipitaksakul and Saijai Liangpunsakul for delicious home cook food, board game, and invaluable moral sup-port. Nam, without your provocative research idea, encouragement, and great care , I might not be able to complete this journey.
6
Contents
Contents 6
List of Tables 8
List of Figures 11
1 Introduction 13
2 Minimum Wage and Wage Inequality in Thailand 15
2.1 Introduction . . . 15
2.2 Data and descriptive analysis . . . 18
2.2.1 Minimum wage in Thailand . . . 18
2.2.2 Wages . . . 19
2.3 Methodology . . . 22
2.4 Results . . . 24
2.5 Robustness checks . . . 30
2.6 Discussion . . . 34
2.7 Conclusion . . . 36
2.A Bindingness of Provincial Minimum Wages (other sub-samples) . . . 38
2.B Descriptive statistics . . . 40
3 Compulsory Schooling, Earnings and Health in Thailand 44 3.1 Introduction . . . 44
3.2 Education system and compulsory schooling law in Thailand . . . 46
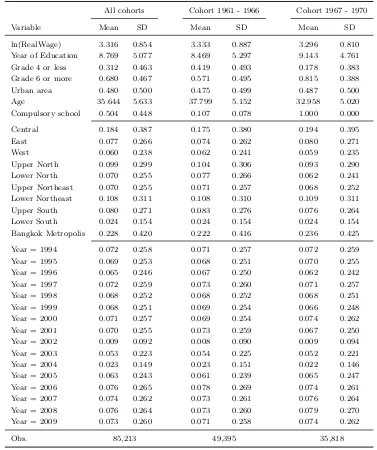
3.3 Data and descriptive analysis . . . 47
3.4 Methodology . . . 49
3.5 Results . . . 51
3.5.1 Effect on schooling . . . 51
3.5.2 Return to Education . . . 53
3.5.3 Education and Self-Assessed Health Status . . . 57
3.6 Conclusion . . . 58
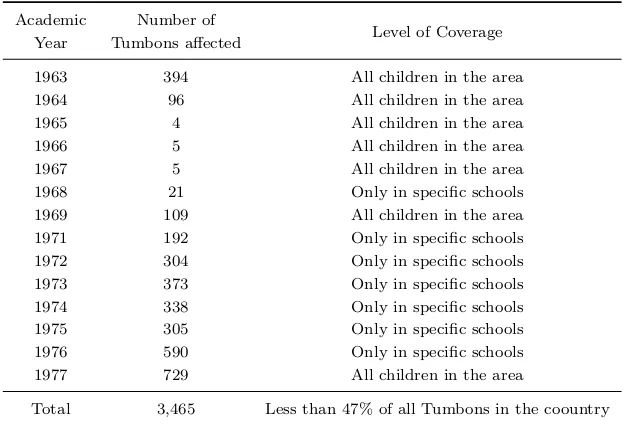
3.A Changes in Compulsory Schooling Law . . . 60
3.B Descriptive statistics . . . 61
3.C Compulsory Schooling Law & Years of Education by Gender . . . 67
4 The Impact of Supply Chain Disruptions: Evidence from the Japanese Tsunami 71 4.1 Introduction . . . 71
4.2.2 US Auto industry and the market aftermath . . . 77
4.3 Data . . . 78
4.4 Methodology . . . 80
4.5 Results . . . 84
4.6 Other margins of adjustment . . . 88
4.7 Conclusion . . . 95
4.A Japanese Export in Motor vehicle and Motor parts & accessories . . . . 96
4.B Car sales in the US market by manufacturers (units) . . . 97
4.C Data Appendix . . . 98
4.C.1 Japanese auto makers direct employment . . . 98
5 Conclusion and Future Research 101
References 103
8
List of Tables
2.1 Summary statistics for bindingness of provincial minimum wages . . . . 22 2.2 The effect of minimum wage on log wage gap of selected percentiles,
log(pth) - log(p60), All workers from 1985 Q1 to 2010 Q1 . . . 25 2.3 The effect of minimum wage on log wage gap of selected percentiles,
log(pth) - log(p60), Sub-sample Male Private Employees outside Agri-cultural sector from 1985 Q1 to 2010 Q1 different age groups . . . 26 2.4 The effect of minimum wage on log wage gap of selected percentiles,
log(pth) - log(p60), Sub-sample Private Employees age 25-54 in large firms (more than 100 workers) outside Agricultural sector by Gender from 1987 Q3 to 2010 Q1 . . . 27 2.5 The effect of minimum wage (measured by fraction of affected workers)
on changes in log wage of different sub-sample from 3rd quarter 1994 to 1995 . . . 29 2.6 The effect of minimum wage (measured by fraction of affected workers)
on changes in log wage of different sub-sample from 3rd quarter 1996 to 1997 . . . 29 2.7 The effect of minimum wage on log wage gap of selected percentiles,
log(pth) - log(p60), All workers in 32 provinces with sizable sample from 1994 Q1 to 2010 Q1 . . . 31 2.8 The effect of minimum wage on log wage gap of selected percentiles,
log(pth) - log(p60), Sub-sample Male Private Employees age 25-54 out-side Agricultural sector in 32 provinces with sizable sample from 1994 Q1 to 2010 Q1 . . . 31 2.9 The effect of minimum wage on log wage gap of selected percentiles,
log(pth) - log(p60), Sub-sample Private Employees age 25-54 in large firms (more than 100 workers) outside Agricultural sector in 32 provinces with sizable sample from 1994 Q1 to 2010 Q1 . . . 32 2.10 The effect of minimum wage on log wage gap of selected percentiles,
log(pth) - log(p60), Sub-sample Private Employees age 25-54 in small and medium firms (fewer than 100 workers) outside Agricultural sector in 32 provinces with sizable sample from 1994 Q1 to 2010 Q1 . . . 33 2.11 Summary statistics for bindingness of provincial minimum wages
Sub-sample Private Employees age 25-54 outside Agricultural sector . . . . 38 2.12 Summary statistics for bindingness of provincial minimum wages
32 provinces with sizable sample) Sub-sample Private Employees age 25-54 outside Agricultural sector . . . 39 2.14 Summary statistics for bindingness of provincial minimum wages (only
32 provinces with sizable sample) Sub-sample Private Employees age 25-54 in large firms (more than 100 workers) outside Agricultural sector 39 2.15 Descriptive statistics of all employees in the LFS 1994 sample . . . 40 2.16 Descriptive statistics of all employees in the LFS 1996 sample . . . 40 2.17 Labour inspection in the whole country 2006 - 2010 (number of
estab-lishments) . . . 43 3.1 The impact of the changes in compulsory schooling law on level of
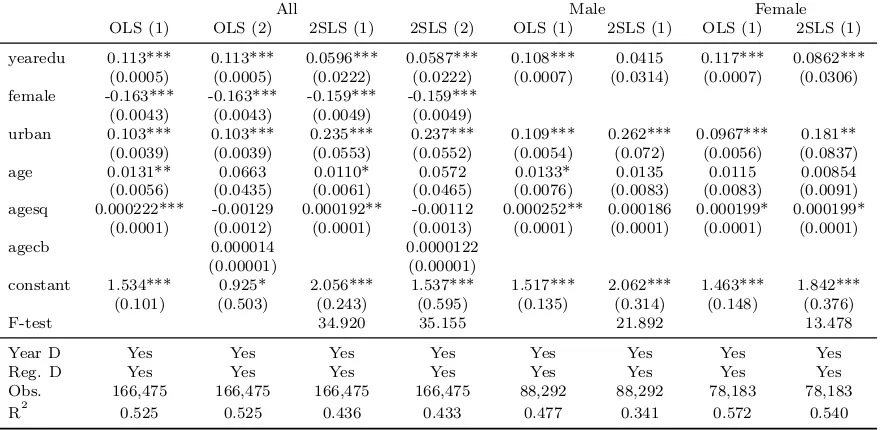
edu-cation . . . 52 3.2 Return to Education for cohorts born in 1961 to 1970 by gender . . . . 54 3.3 Return to Education for cohorts born in 1961 to 1970 by gender
(Ex-cluding Bangkok) . . . 55 3.4 Return to Education for cohorts born in 1958 to 1975 by gender . . . . 56 3.5 The effect of schooling on self-assessed health status cohorts born in
1961 to 1970 by gender (HWS 2006) . . . 58 3.6 The number of Tumbons affected by the changes in compulsory
school-ing law 1963-1977 . . . 60 3.7 Labor Force Survey 1994 2009 (workers both genders cohorts 1961
-1970) . . . 61 3.8 Labor Force Survey 1994 - 2009 (male workers cohorts 1961 - 1970) . . 62 3.9 Labor Force Survey 1994 - 2009 (female workers cohorts 1961 - 1970) . 63 3.10 Health and Welfare Survey 2006 (All respondents cohorts 1961 - 1970) 64 3.11 Health and Welfare Survey 2006 (Male respondents cohorts 1961 - 1970) 65 3.12 Health and Welfare Survey 2006 (Female respondents cohorts 1961
-1970) . . . 66 3.13 The impact of the changes in compulsory schooling law on level of
edu-cation (Male) . . . 69 3.14 The impact of the changes in compulsory schooling law on level of
edu-cation (Female) . . . 70 3.15 First stage regressions for Return to Education (cohorts born in 1961
to 1970 by gender) . . . 70 4.1 Descriptive Statistics of the CPS Sample . . . 79 4.2 Descriptive Statistics of the QWI Sample . . . 80 4.3 Share of direct employment by Japanese auto makers and impacts on
labour inputs (CPS data) . . . 85
4.4 Share of direct employment by Japanese auto makers and impacts on labour inputs based on QWI data . . . 86 4.5 Share of direct employment by Japanese auto makers and impacts on
labour inputs based on QWI data (cont.) . . . 86 4.6 Optimal specification for each SARIMA(p,d,q)(P,D,Q)12 with impacts
of the shock intervention . . . 87 4.7 Impacts on labour inputs by groups based on QWI data . . . 88 4.8 Indirect Impacts on labour inputs by groups based on QWI data . . . . 89 4.9 Share of Japanese auto makers direct employment in each state . . . . 98 4.10 Data Sources . . . 100
List of Figures
2.1 Real Minimum wage by provinces (Baht per day in 2007) 1981-2011 . . . 20
2.2 Kernel Density of Log hourly wage (weighted) for all workers July 2007 VS 2008 in selected provinces . . . 21
2.3 Kernel Density of Log hourly wage (weighted) in Thailand for formal and informal workers 3rd quarter 1994 VS 1995 . . . 41
2.4 Kernel Density of Log hourly wage (weighted) in Thailand for formal and informal workers July 2007 VS 2008 . . . 41
2.5 Cumulative Distribution of Log hourly wage (weighted) in Thailand for formal and informal workers 3rd quarter 1994 VS 1995 . . . 42
2.6 Cumulative Distribution of Log hourly wage (weighted) in Thailand for formal and informal workers July 2007 VS 2008 . . . 42
3.1 Effect of Compulsory Schooling on Years of Education (estimated from Linear Probability Model) with 95% confident interval . . . 52
3.2 Average Years of Education of the Population by cohort and gender, LFS 1994-2009 . . . 67
3.3 Average Years of Education of All in the Labour Force by cohort and gender, LFS 1994-2009 . . . 67
3.4 Average Years of Education of All Employees by cohort and gender, LFS 1994-2009 . . . 68
3.5 Effect of Compulsory Schooling on Years of Education of Male in Labour force (estimated from Linear Probability Model) with 95% confident interval . . . . 68
3.6 Effect of Compulsory Schooling on Years of Education of Female in Labour force (estimated from Linear Probability Model) with 95% confident interval . 69 4.1 Transmission Mechanism of the Shock and Potential Channels of Adjustment 72 4.2 Japan’s Export Value to USA 2009-2011 by HS code industry 84-89 . . . 76
4.3 Japan’s Export Value to USA (Monthly Indices) . . . 76
4.4 Market Share of Auto Industry by firms’ nationality . . . 77
4.5 US monthly trade in Automobiles and Light Duty Motor Vehicles, Including Chassis . . . 90
4.6 US monthly trade in Motor Vehicle Engines and Parts . . . 90
4.7 CPI urban area for New Vehicles by region . . . 91
4.8 CPI urban area for Used Cars and Trucks by region . . . 91
4.9 Manufacturer True Cost of Incentives (USD) Detroit 3 and Japan big 3 . . . 92
4.10 Manufacturer True Cost of Incentives (USD) Germany, South Korea and Japan 92 4.11 Manufacturer Days To Turn (days) Detroit 3 and Japan big 3 . . . 94
4.12 Manufacturer Days To Turn (days) Germany, South Korea and Japan . . . . 94
4.14 Japan’s Export Value to USA (Monthly indices) for Selected Motor Vehicles
Parts & Accessories . . . 96 4.15 Car sales in the US market by manufacturers (units) Nov 2010 - Apr 2012 . . 97
1
Introduction
Endogeneity is one of the major statistical concerns in empirical economic research attempting to uncover causal relationships. There are two main frameworks used in econometrics to estimate “causal effects”, namely the potential-outcome framework and the structural equation model (Pearl, 2009). Following identification strategies proposed in the recent treatment effect literature (such as Angrist, 2004; Imbens, 2004), this thesis exploits external variations in labour law (chapter two), education policy (chapter three), and natural disaster (chapter four) to evaluate effects of such inter-vention, estimate causal parameters consistently, and explore adjustments in labour market through firms’ and households’ decision.
The second chapter concerns one of the most popular labour market intervention policies, the minimum wage, and its impacts on wage inequality in Thailand. Most minimum wage literature in developing countries provide supporting evidence on its effectiveness in reducing wage inequality (e.g. Maloney et al., 2001; Neumark and Wascher, 2008). Using the Thai Labor Force Survey (LFS) from 1985 to 2010, I find rather mixed outcomes. The minimum wage seems to help compress the lower part of wage distribution for employees in large businesses. Yet the effect does not extend to either the whole labour market or small firms in sectors obliged to pay the minimum wage. These results are not sensitive to changes in identification strategies and are not influenced by periods of incremental increases in nominal minimum wages after the 1997 Asian financial crisis.
In contrast with its role as a benchmark for wage adjustment in Latin America (Maloney and Mendez, 2003), the minimum wage in Thailand does not reduce overall wage inequality owing to high non-compliance rate and weak law enforcement, par-ticularly in the informal sector. However, such conclusion agrees with the segmented labour market (or Welch-Gramlich-Mincer) model (Lewis, 1954; Harris and Todaro, 1970; Gramlich, 1976; Mincer, 1974a; Welch, 1974) and other studies in Indonesia (e.g. Suryahadi et al., 2001; Alatas and Cameron, 2003). Hence, more research is needed to identify reasons behind differential effects across developing countries (especially those in Latin America and Asia-Pacific regions).
1. Introduction 14 Particularly, only female sub-sample yields a positive and robustly significant rate of return to schooling regardless of model specifications. Although the previous study in Thailand using pseudo-panel approach confirms higher rate of return to women’s education (Warunsiri and McNown, 2010), their estimates for both genders are larger and significantly different from zero. Therefore, this chapter extensively discusses two findings, which are the direction of bias in OLS regression and the zero return to men’s compulsory education, and tries to reconcile with existing literature (such as Card, 2001; Duflo, 2001; Pischke and von Wachter, 2008). In addition, I employ the Health and Welfare Survey (HWS) to assess the relationship between education and health outcomes. All estimates from IV method are neither significant nor strongly identified owing to a much smaller sample size.
The last chapter attempts to empirically assess the impacts of international supply chain disruptions on labour demand and other margins of adjustment. Using, as a nat-ural experiment, the sharp drop in Japanese exports of motor vehicles and parts to the USA after the Great Tohoku Earthquake and Tsunami 2011, the impacts of the supply chain disruption on labour inputs adjustment in the US auto industry are estimated. Exploiting state-level variation in numbers of direct employment by Japanese auto makers and location of auto manufacturing factories, this paper identifies the adjust-ment among Japanese companies, their suppliers as well as their competitors based on the Current Population Survey (CPS) and the Quarterly Workforce Indicators (QWI) data.
Notwithstanding significant losses of the Japanese firms’ market share, I find that the disaster negatively affects only average monthly earnings of workers in Japanese assembly plants whereas their competitors, specifically the American and German manufacturers, do not seem to significantly increase any labour inputs in their US assembly plants. Moreover, other than a slight change in inventory and sales incentive, there is no evidence of any adjustments on other margins of factors such as import substitution, or spikes in prices. These results suggest that the overall impact of this disaster on the US economy through the auto industry is rather small. Nevertheless, the role of incentive and inventory management as potential mechanisms to stabilize the shock deserve a thorough assessment in future research.
2
Minimum Wage and Wage
In-equality in Thailand
2.1 Introduction
The effects of minimum wages on various groups of workers have been a popular sub-ject of vigorous debate in the long history of economic literature, as reviewed by Card and Krueger (1995), Machin and Manning (1997), Brown (1999), and Neumark and Wascher (2008). A few of the supporting reasons for the minimum wage policy are its potential to reduce wage inequality, especially among the low paid workers, and its potential to lift these workers and their families out of poverty (Saget, 2001). There-fore, it is crucial to verify any effects the minimum wages have on wage distributions. Researches from the US, UK and Canada in the 90s (Card and Krueger, 1994; DiNardo et al., 1996; Lee, 1999; Machin and Manning, 1994; Fortin and Lemieux, 2000) found that minimum wages significantly reduce wage dispersion. Recent studies in these countries find smaller direct and spillover effects of the minimum wage on the overall wage distribution because minimum wages were set at the level where only a small fraction of workers were directly affected (Dickens and Manning, 2004; Autor et al., 2010). Hence, it is interesting to investigate the impacts of such policy in the context of developing countries where minimum wages affect larger fraction of workers.
However, the compliance with the minimum wage law in developing countries is far from perfect and a significant proportion of their workers is in the informal sector. So, the expected result is rather ambiguous (Although the law enforcement and compliance are not the main concern in developed countries, Ashenfelter and Smith (1979) proved that non-compliance with the minimum wage law is reasonable for profit maximizing firms and recommended that compliance issue should be taken into account in future research on the minimum wage). Moreover, comparisons across studies in developing countries are more complicated due to differences in minimum wage levels, enforcement and labour market institutions (Lemos, 2009). Though these studies mostly agree on the positive wage compression effect of the minimum wages in the formal sector, the results in the informal sector are rather mixed (see Maloney and Mendez, 2003; Neumark and Wascher, 2008, for some literature survey).
2. Minimum Wage and Wage Inequality in Thailand 16 Costa Rica not only for large urban enterprises (formal sector) but also small urban and all rural enterprises (informal sector). Other than the classification of wage employees into formal and informal sectors, Lemos (2009) finds that the minimum wage in Brazil compresses the wage distribution of low-educated workers and self-employed workers as well. As one of the most thorough analyses of the minimum wage policy in the Latin America, Maloney et al. (2001) use Kernel-density plots and find that minimum wages could influence the distribution of wages in both the formal and the informal sectors of eight Latin American countries. Surprisingly, their results indicate stronger distortion around the minimum of the informal wage distribution than the formal in Brazil, Mexico, Argentina and Uruguay.
In case of Mexico where real minimum wages deteriorated in the 80s and 90s, early literatures find mixed results on minimum wage and employment (Bell (1997) detects no employment effect in Mexican manufacturing sector but Feliciano (1998) finds disemployment effects of the minimum wage on female workers in all industries). However, based on modification of Lee (1999) model, Bosch and Manacorda (2010) conclude that the deterioration of the real minimum wages contributes to the rise in wage inequality. While minimum wages compress the bottom part of Mexico’s wage distribution, the effects in the informal sector are more pronounced (up to the eight decile of the informal wage distribution). They also observe a positive correlation between minimum wages and inequality of sub-minimum wage workers and stronger spillover effects in the informal sector.
There are several reasons why the minimum wage can affect the informal wage dis-tribution. First, the minimum wage could induce the relocation of capital from formal sector to the labour intensive informal sector leading to higher informal sector wages (Harrison and Leamer, 1997). Though the minimum wage might simply indicate the wage level in high inflation countries, Maloney and Mendez (2003) argue that such a reason does not apply to Brazil, Columbia, and Mexico where inflation rates were moderate during the sample period. They propose that the minimum wage could act as a benchmark for “fair” remuneration (the so-called ‘lighthouse effect’). Moreover, Khamis (2013) provides evidence from Argentina that employers might comply with the minimum wage law but not other benefit entitlements such as social security con-tribution (which is widely used to classify workers into formal or informal sectors). In addition, Boeri et al. (2010) use the matching model to show that if the introduction of the minimum wages changes skill composition between formal and informal sectors, such sorting of workers by skill could result in higher average skills of workers in the informal sector, thus, higher average wages.
there is a paucity of evidence for minimum wage effects on the wage distribution in Southeast Asian economies. Despite rising or persistent wage and income inequality in East and Southeast Asian economies, existing literature focus on economic liberation or Foreign Direct Investment (FDI) as the underlying factors of such trends (Jomo, 2006; Te Velde and Morrissey, 2004). The only exception is Indonesia where researchers find conflicting results.
Rama (2001) and Suryahadi et al. (2001) show that the minimum wage hikes have a positive impact on average wages of all workers and all segments of workforce but mostly insignificant except for the sub-sample of blue-collar workers. On the contrary, using the simulation framework, Bird and Manning (2008) report negative effects on wages in the informal sector. In terms of the impact on employment, Suryahadi et al. (2001) and Alatas and Cameron (2003) report differential effects varied by firm size. While small domestic firms experience employment losses, large firms (both domestic and foreign) are not negatively affected or even experience rises in employment. Yet Bird and Manning (2008) suggest increases in informal employment.
With respect to wage inequality in Thailand, similar to the Anglo-Saxon economies, Lathapipat (2009) finds evidence for wage polarisation in Thailand during the late 1980s to early 2000s (table 4.1 in Lathapipat 2008 and figure 5 in Lathapipat 2009). Particularly, wage inequality at the top had risen whereas wage gaps between the me-dian and the first decile were narrowed down. He proposes that the rise of the bottom part of the wage distribution could result from an internal migration of labourers from hidden unemployment in rural area to the modern sector in urban area. Yet it is in-teresting to investigate if other factors such as labour market institution contribute to such a trend. Hence, the objective of this paper is to assess the role of the minimum wage policy in narrowing the wage gap of low paid workers in Thailand. Additionally, it contributes to the small literature on the differential effects of minimum wages on the formal and informal wage inequality in Southeast Asia.
This paper uses the Thai Labor Force Survey (LFS) in the first and third quarter (dry and rainy season) from 1985 to 2010. Due to high and fluctuating non-compliance rates throughout the period of study, the Dinardo, Fortin and Lemieux decomposition methodology is not applied in this paper. Instead, I exploit variation in the ‘effective minimum’, which is defined as the difference between the statutory minimum wage and median wage in each province (Lee, 1999), to identify impacts of minimum wage on different percentiles of wage in that province. Moreover, to acknowledge criticisms on Lee’s econometric specification, the methodology proposed in Autor, Manning, and Smith (2010) is applied.
2. Minimum Wage and Wage Inequality in Thailand 18 for either all employees or workers in covered sector. However, the evidence suggests that the minimum wage significantly compresses the wage distribution of workers in large establishments in covered sectors. Nevertheless, such policy might be driven by periods of incremental rises in statutory minimum wage after the 1997 Asian financial crisis. Therefore, I use the methodology based on “Fraction of Affected Workers” by Card and Krueger (1995) to assess the effect of minimum wage on wage distribution of periods with significant hikes. Still, the distinctive outcomes among sub-groups of workers are affirmed.
Further, the data from Department of Labour Protection on labour inspection show rather weak law enforcement. This statistic is in line with the ineffectiveness of minimum wage policy observed. Thus, the result of this paper highlights the role of a difference in the compliance rate between formal and informal sectors on effectiveness of minimum wage policy provided that firm size can be used to classify workers into either formal or informal sector. Although such finding is in contrast to most literature from Latin America, where minimum wages effectively influence both formal and informal wage distribution, it is in line with diverse employment effects across sectors observed in Indonesia.
The paper is structured as follows. Section 2.2 describes the data and descrip-tive statistics of minimum wage and hourly wage in Thailand. Section 2.3 outlines the methodologies while Section 2.4 briefly discusses the main results. Section 2.5 presents some robustness check and Section 2.6 discusses the results with respect to law enforcement and economics theories.
2.2 Data and descriptive analysis
2.2.1 Minimum wage in Thailand
The minimum wage was first introduced for private employees outside the agricultural sector in Bangkok and adjacent cities in April 1973. Later in October 1974, its coverage was expanded to the whole country. The statutory minimum wages have been set differently across zones as wage in baht per day which, in general, is defined as 8 hours of work.1 As for part-time workers, they are also entitled to receive hourly minimum
wage which is equal to the daily minimum wage divided by 8 hours.
At first, the minimum wage setting process was centralized and categorized into 3 zones by geographic region. From October 1981, the legislation stated that minimum wage setting took factors of each region such as inflation, living standard,
competitive-1
ness, economic and labour market condition into consideration. However, the number of minimum wage zones was stable around 3-4 zones during 1981-2001. After the enact-ment of the Labour Protection Act 1998, the minimum wage setting was decentralized from the national tripartite committee (comprised of representatives from employers, employees and government) to regional tripartite sub-committee in each province or sub-region. Then number of minimum wage bands started to increase dramatically from 8 zones in 2002 to 28 zones in 2010.
Yet differences between these zones are small and move along with their counter-parts in the same zone before 2001. In addition, figure 2.1 shows an upward trend from late 80s until it reached its peak slightly before the Asian economic crisis. Then it dropped sharply and has not attained such level even in 2011.
2.2.2 Wages
I employ the Labor Force Survey (LFS) conducted by the National Statistics Office of Thailand (NSO). NSO adopts a stratified two-stage sampling of the whole country (blocks or villages and private households) for these surveys. From 1984 to 1997 the surveys were conducted three rounds in each year; the first round enumeration is held in February coinciding with the non-agricultural season, the second round is normally held in May when new labor force from graduated students just finish their study and the third round is conducted in August, during the agricultural season. From 1998, the fourth round of the survey has been conducted in November (NSO, 2003). Then since 2001 the surveys have been conducted monthly with three months combined for each round of survey.
LFS provides data on individual characteristics for every member of the household including work status, occupation, industry and hours worked for all employed persons. Also, for all workers, the LFS records information on wage / salary, overtime payments, bonuses and some other fringe benefits in the first and third round, yet after 1999 this wage data is also available for the second and fourth round. In order to ensure comparability across years, only the first and third round (dry and rainy season) of the LFS from 1985 to 20102 are utilized. Typically, sample sizes of each surveys is large and represents regional level. Only after February 1994, NSO expanded the sample size to assure statistical representation at provincial level (NESDB and NSO, 2004)3.
Hence, due to small sample size in these early surveys (especially for wage earners), this study will provide a robustness check where provinces or rounds with too small observations are dropped.
In this paper, the sample covers all wage earners in private, public and state
en-2With an exception of three rounds which are 1986 1st, 1990 1st, and 2010 3rd
3
2. Minimum Wage and Wage Inequality in Thailand 20
Figure
2.1:
Real
Minim
u
m
w
age
b
y
pro
vinces
(Bah
t
p
er
da
y
in
2007)
[image:20.595.114.519.105.765.2]Figure 2.2: Kernel Density of Log hourly wage (weighted) for all workers July 2007 VS 2008 in selected provinces
1) BKK stands for Bangkok.
2) North includes 2 provinces in the north of Thailand which are among the lowest pay scale of minimum wage.
3) Central comprises of 2 provinces in the central with many industrial estates.
terprises who report their wages and number of hours worked in the preceding week of the survey. As the minimum wage law in Thailand primarily determines the basic wage for regular working hours, the wage variable used is hourly wages excluding other compensation such as bonus, over time, clothes or any benefits.4
According to the kernel density of log hourly wage in figure 2.2 where two vertical lines refer to minimum wage in each zone during July 2007 and 2008 respectively, male workers seem to earn slightly higher than their female counterpart in all zones as expected. Yet the surprising feature is that there is no distinct spike around the minimum wage in any zones. In Bangkok and the central region, peaks of female wage distribution are only slightly higher than the statutory minimum, on the contrary about half of female workers in the north receive basic hourly wage that is higher than the minimum wage in their provinces. This result indicates a possibility of a severe non-compliance problem in many provinces, especially in low minimum wage zones.
4
2. Minimum Wage and Wage Inequality in Thailand 22 Table 2.1: Summary statistics for bindingness of provincial minimum wages
All Female Male
Max. Min. Median Max. Min. Median Max. Min. Median Year(Q3) pctile pctile pctile pctile pctile pctile pctile pctile pctile 1989 85.1 15.5 48.5 95.1 27.4 61.4 80.6 5.0 39.8 1994 72.2 14.2 48.9 85.1 17.6 61.0 62.4 11.2 43.1 1999 62.4 7.5 35.4 75.5 9.6 42.1 59.3 5.8 30.5 2004 65.2 10.8 40.9 74.8 12.4 44.5 62.3 9.4 37.1 2009 51.4 9.5 29.9 62.1 8.4 34.8 53.2 7.6 26.2 The definition for Max. pctile, Min. pctile and Median pctile are as follows: All percentiles (pctile) display in this table are a proportion of workers who received basic wage less than their provincial mini-mum wage. For Max. pctile, it is such percentile in a province with the highest level of non-compliance to the law in each year. Meanwhile, Min. pctile is a percentile in a province with the highest compli-ance to the law whereas Median pctile is the percentile in a province with non-complicompli-ance rates at the middle of all provinces in that year.
In the subsequent table, I provide examples of variation in bindingness percentile5 of the minimum wage across provinces over the sample periods.
Although table 2.1 does not show a clear upward trend in compliance with minimum wage law6, binding percentile in Max, Median and Min. provinces decrease slightly over the sample period. Still, non-compliance rates are higher than 30 % for half of the country even in 2009. Consequently, the wage compression effect from minimum wage law might be partially effective. I will then employ various strategies to investigate this hypothesis in the following sections.
2.3 Methodology
This paper follows the strategy used in Lee (1999) to exploit inter-province variation in the gap between the provincial median wage and its minimum wage (i.e. effective minimum) to estimate the effect of changes in minimum wage on wage inequality in Thailand. However, in the case of Thailand, one of the key identifying assumptions -that the provincial latent wage inequality is uncorrelated with the median- is likely to be violated. Therefore, to address omitted variables resulting from this correlation, I adopt a technique employed by Autor, Manning, and Smith (2010). Provincial fixed effect and provincial trends are included as a control for shocks to the wage distribution that are correlated with changes in minimum wages. The main OLS specification is:
wPnt−wMnt =dtP+dnP+dnP×T+β1P(M Wnt−wntM) +βP2(M Wnt−wntM)2+Pnt (2.3.1) wherewntP is thePth percentile of the observed log wage (per hour),wMnt is the Median (in this paper I used the 6th decile) of the observed log wage;dtP is year dummy,dnP is provincial dummy,T is time trend; M Wnt is the statutory minimum wage and Pnt
5
That is a fraction of employees in each province who receive wages less than legislative minimum wage
is an error term in province n at time t for Pth percentile. Also, all regressions are weighted by multiplication of sampling weight and number of total hours worked.
Moreover, to tackle with Division bias7, I follow a 2SLS strategy as in Card, Katz, and Krueger (1993) and Autor, Manning, and Smith (2010) by instrumenting the effective minimum with statutory minimum wage in each province and year. This instrument should be correlated to provincial effective minimum but uncorrelated to any measurement errors in the sampling median. Thus, it relies on a key assumption that legislated changes in minimum wage are not correlated with changes in latent province wage inequality conditional on year and province dummies and provincial trends. Therefore, the second stage is the same to equation 2.3.1 while the first stage for the effective minimum is specified as:
(M Wnt−wMnt) = dtP +dnP +dnP ×T+δPM Wnt+νntP (2.3.2)
Likewise, an instrument for the square of the effective minimum is computed from a square of predicted value from regression 2.3.2. Yet this instrument might suffer from limited variation because there were few minimum wage zones before 2002. As a robustness check, I adopt a reduced form approach by Autor, Manning, and Smith (2010) and use predicted instead of observed provincial median wage in equation 2.3.1. The predicted median can be estimated as follow:
wMnt = dt+dn+dn×T +unt (2.3.3)
which specifies provincial median wage, wdM
nt ,as a function of year dummies, province dummies and provincial trends. Then define the reduced form effective minimummwgnt as (M Wnt−wdM
nt). Equation 2.3.1 can be rewritten as:
wntP −wntP−1 = dtP +dnP +dnP ×T+ ˜β1Pmwgnt+ ˜β
P
2mwg
2
nt+ ˜Pnt (2.3.4) Further, the other identification strategy proposed in the literature called “fraction affected” (Card and Krueger, 1995) is adopted so as to circumvent potential weak instruments problem as well as a decline of real minimum wage. The primary OLS model is specified as:
wPnt−wPnt−1 = cP +θP(F Ant) +ηntP (2.3.5) where wPnt−wPnt−1 is change in log hourly wage at Pth percentile from year t-1 to t in province n, F Ant is fraction affected in province n year t defined as the fraction
7
2. Minimum Wage and Wage Inequality in Thailand 24 of workers in year t-1 who earn wages between the old and new minimum wage i.e. between year t-1 and t, cP is a constant and ηntP is an error term8. Nevertheless, this technique relies on an assumption that workers directly affected by the increase in minimum wage are those receiving wages either exactly at the former minimum wage or between the former and new minimum wage. Therefore, provinces with a higher fraction affected should show a larger effect on lower part of wage distribution. I will present results from selected years with substantial increase in statutory minimum wages which in turn leads to potentially more variation in fraction affected.
2.4 Results
To investigate the effect of minimum wages on wage inequality in developing countries, compliance rate is one of the major concerns. Although employers in formal sectors are expected to comply with the minimum wage law, the LFS does not provide any information on the social security contribution of each worker which is widely used as an indication of being a formal worker in the literature. To identify the degree of the non-compliance problem, I employ descriptive statistics of the data from various groups of workers as shown in Appendix 2.A table 2.11 - 2.14.
The results demonstrated in this section are classified into three groups of sample according to coverage of the law and level of compliance rate, namely (1) all employees in the sample regardless of their age or industry, (2) male employees in private firms outside the agricultural sector and finally (3) male employees in large private firms. These three classifications will help to analyse the effectiveness of minimum wage policy on wage inequality in different section of Thai labour market.
The empirical strategy employed in the first set of results is derived from mod-els 2.3.1 and 2.3.4. Regression results for all workers are presented in table 2.2. The OLS regressions of all workers both with and without provincial trends have positive and significant coefficients in all percentiles. These results coincide with the criticism about division bias highlighted in Autor, Manning, and Smith (2010)9. The next two columns show the results after using the legislative minimum wage in each province as an instrument for the effective minimum. These marginal effects have positive and significant coefficients in some percentiles of the 2SLS regressions without provincial trends (model (1)). However, results from 2SLS regressions including provincial trend are not significantly different from zero in any percentiles. Lastly, the regressions based on predicted median as in equation 2.3.4 does confirm a pattern of results observed from the 2SLS10. In particular, the minimum wage does not have any significant effects
8
In order to control for different labour market condition across provinces, regressions which include average provincial wages in year t-1 as a control are presented alongside.
9
The results from OLS regressions of other two sub-samples also suffer from this division bias problem. So, those results will be omitted from the following sub-samples.
10
Table 2.2: The effect of minimum wage on log wage gap of selected percentiles, log(pth) - log(p60), All workers from 1985 Q1 to 2010 Q1
Percentile OLS 2SLS Predicted Median (1) (2) (1) (2) (1) (2) (3) 5 0.72*** 0.585*** 3.973*** -0.815 1.256*** -1.041 -2.648**
(0.082) (0.042) (1.003) (0.622) (0.401) (0.669) (1.259) 10 0.654*** 0.578*** 2.669*** -0.308 0.956*** -0.395 -2.314* (0.059) (0.035) (0.67) (0.404) (0.255) (0.483) (1.268) 20 0.537*** 0.55*** 0.622*** -0.304 0.462*** -0.389 -2.067***
(0.031) (0.031) (0.214) (0.387) (0.08) (0.442) (0.753) 25 0.489*** 0.524*** 0.154 -0.093 0.334*** -0.119 -2.004***
(0.029) (0.026) (0.235) (0.322) (0.084) (0.404) (0.561) 30 0.433*** 0.481*** -0.128 -0.031 0.225*** -0.04 -1.061**
(0.03) (0.025) (0.224) (0.257) (0.082) (0.333) (0.416) 40 0.319*** 0.367*** -0.252 0.093 0.118* 0.119 -0.818* (0.027) (0.022) (0.157) (0.153) (0.068) (0.217) (0.436) 75 0.008 -0.015 0.502** -0.08 0.113 -0.102 1.784***
(0.034) (0.028) (0.207) (0.198) (0.078) (0.264) (0.447) 90 0.293*** 0.254*** 0.915** 0.152 0.471*** 0.191 2.15*** (0.058) (0.046) (0.407) (0.36) (0.171) (0.488) (0.662) 95 0.525*** 0.495*** 0.4 0.128 0.657*** 0.162 1.671** (0.05) (0.041) (0.443) (0.382) (0.164) (0.518) (0.837) F-test (weak IV) 30.923 17.996
2. Minimum Wage and Wage Inequality in Thailand 26 Table 2.3: The effect of minimum wage on log wage gap of selected percentiles, log(pth) - log(p60), Sub-sample Male Private Employees outside Agricultural sector from 1985 Q1 to 2010 Q1 different age groups
Percentile
Adult workers Young workers
2SLS Predicted Median 2SLS Predicted Median (1) (2) (1) (2) (1) (2) (1) (2) 5 5.122 -0.912 -0.118 -1.178* 1.41** -1.204* 0.731*** -1.661**
(3.556) (0.608) (0.198) (0.647) (0.601) (0.628) (0.264) (0.828) 10 0.787 -0.79 -0.055 -1.02** 1.011*** -0.696 0.433** -0.965
(1.234) (0.507) (0.141) (0.493) (0.361) (0.477) (0.186) (0.655) 20 -0.655 -0.293 0.071 -0.376 0.108 -0.348 0.219* -0.487
(0.852) (0.301) (0.089) (0.34) (0.235) (0.401) (0.13) (0.534) 25 -0.902 -0.227 0.066 -0.291 -0.005 -0.325 0.172 -0.456
(0.893) (0.264) (0.091) (0.308) (0.217) (0.318) (0.118) (0.41) 30 -1.454 -0.209 0.092 -0.269 -0.035 -0.197 0.203** -0.276 (1.227) (0.269) (0.094) (0.322) (0.195) (0.267) (0.092) (0.356) 40 -1.111 -0.058 0.111 -0.073 -0.245* -0.041 0.144** -0.05
(0.96) (0.211) (0.068) (0.27) (0.146) (0.191) (0.067) (0.267) 75 1.944 -0.331** -0.086 -0.425* -0.094 -0.334* -0.012 -0.467* (1.521) (0.149) (0.094) (0.256) (0.102) (0.191) (0.066) (0.25) 90 4.99 -0.411 -0.196 -0.533 0.063 -0.673 0.144 -0.95 (3.832) (0.361) (0.243) (0.51) (0.234) (0.475) (0.14) (0.64) 95 4.918 -0.733 -0.173 -0.942* 0.238 -1.173* 0.268 -1.606**
(3.743) (0.456) (0.306) (0.566) (0.332) (0.68) (0.221) (0.795) F-test (weak IV) 2.565 18.458 21.023 9.807
Year dummy Yes Yes Yes Yes Yes Yes Yes Yes Province dummy Yes Yes Yes Yes Yes Yes Yes Yes Provincial trend No Yes No Yes No Yes No Yes Note: Standard errors are in parentheses while ***, ** and * indicate significant at 1% , 5% and 10% level respectively.
on wage inequality of all workers after taking provincial trends into account11.
Table 2.3 presents the regression results from the sub-sample of male private em-ployees outside the agricultural sector for two different age groups. According to the legislation, the minimum wage applies for all workers, both part-time and full-time, in private companies outside the agricultural sector. However, the reason for choosing only the male instead of both genders is due to higher prevalence of non-compliance among female labours. So, the results from this male sub-sample should provide an upper bound of the effect of minimum wage policy on this group. Considering the adult workers, 2SLS regressions do not show significant results in any percentiles. The only exception is percentile 75th in the model with provincial trends where minimum wage seems to compress workers’ wage in this percentile towards the median. However, results from models using predicted median show similar patterns of significance with
presents the Kleibergen-Paap rk Wald F-statistic for weak identification test of each column first stage regression. The F-statistic has the same value for every percentile because the same endogenous regressors and the same instrumental variables are employed in all of them. These F-statistics are significantly larger than the Stock-Yogo weak ID test critical value at 10% (Stock and Yogo, 2005). Similar results are also observed in the sub-sample male private employees outside agriculture. Hence, weak instrument is not a major concern for the results in table 2.2 and 2.3
11As for the first-differenced specification, although it is more efficient than the fixed effect when
Table 2.4: The effect of minimum wage on log wage gap of selected percentiles, log(pth) - log(p60), Sub-sample Private Employees age 25-54 in large firms (more than 100 workers) outside Agricultural sector by Gender from 1987 Q3 to 2010 Q1
Percentile
All workers Only Male workers
2SLS Predicted Median 2SLS Predicted Median (1) (2) (1) (2) (1) (2) (1) (2) 5 -0.378 0.729* 0.083 1.337 0.551 0.519* 0.33 1.354
(1.013) (0.375) (0.262) (0.839) (0.694) (0.28) (0.215) (0.833) 10 -1.25 0.499* 0.239 0.927 0.174 0.543** 0.281 1.418** (1.603) (0.283) (0.212) (0.676) (0.652) (0.22) (0.196) (0.603) 20 -0.688 0.63** 0.404*** 1.165** 0.443 0.352** 0.23 0.92*
(1.073) (0.247) (0.113) (0.59) (0.462) (0.149) (0.167) (0.513) 25 -0.478 0.649*** 0.374*** 1.192** 0.516 0.415*** 0.282** 1.084** (0.913) (0.209) (0.094) (0.508) (0.377) (0.129) (0.118) (0.462) 30 -0.305 0.63*** 0.363*** 1.158*** 0.489 0.412*** 0.274*** 1.074** (0.719) (0.192) (0.083) (0.403) (0.312) (0.124) (0.09) (0.432) 40 0.214 0.478*** 0.238*** 0.879*** 0.468 0.433*** 0.157** 1.128***
(0.354) (0.166) (0.058) (0.314) (0.333) (0.096) (0.07) (0.28) 75 0.096 -0.373 -0.037 -0.671* 0.474 0.218 0.014 0.571 (0.353) (0.242) (0.071) (0.374) (0.394) (0.171) (0.068) (0.436) 90 0.695 -0.037 0.296** -0.059 0.042 0.098 0.121 0.258
(0.877) (0.382) (0.146) (0.714) (0.528) (0.3) (0.155) (0.816) 95 -0.205 0.465 0.405** 0.842 -1.004 -0.032 0.194 -0.088
(0.909) (0.519) (0.174) (1.01) (0.952) (0.562) (0.196) (1.535) F-test (weak IV) 2.408 8.942 3.494 10.884
Year dummy Yes Yes Yes Yes Yes Yes Yes Yes Province dummy Yes Yes Yes Yes Yes Yes Yes Yes Provincial trend No Yes No Yes No Yes No Yes Note: Standard errors are in parentheses while ***, ** and * indicate significant at 1% , 5% and 10% level re-spectively. This sample does not include both quarters of 2001 due to a change in definition of a variable ”firm size” in that year.
two additional negative coefficients at the bottom12. It can be interpreted that the minimum wage might result in widening the wage gap between the median worker and the low wage workers in this sub-sample, though the result is not very robust.
Moreover, other than positive and significant results among the bottom two per-centiles in those models without provincial trends, the effects of minimum wage on youth workers (age 16-24) after allowing for different provincial trends are similar to the ones for adults. From this finding, it can be inferred that minimum wage policy could contribute to the widening wage gap for the male low paid workers in private companies outside the agricultural sector.
Lastly, we consider the sub-sample of adult workers in large private firms (with more than 100 workers) outside the agricultural sector. As shown in table 2.12, the median province in this group has the lowest percentage of sub-minimum workers among all three classifications. Table 2.4 illustrates that, after controlling for provincial trends, the minimum wage policy narrows wage gap between percentile 25th - 40th and
12Although the wage compression at the top of wage distribution is still pronounced for percentile
2. Minimum Wage and Wage Inequality in Thailand 28 the median (percentile 60th) regardless of gender13 or model specifications (2SLS14 or
predicted median). Moreover, the coefficients from regression with provincial trends comply with the models underlying assumption that minimum wage should not affect the upper side of wage distribution.
In sum, minimum wage policy seems to have different effects on wage inequality depending on segments of the labour market. Only low paid workers in large private firms (which can be considered as the formal segment of labour market) benefit from such wage compression effect. However, workers in the lowest wage percentile (5th - 10th) in this sub-group still do not benefit from the policy. Thus, non-compliance seems to be one of the important factors contributing to the failure to reduce wage inequality in both formal and informal sectors through minimum wage policy.
Yet erosion of real minimum wage for a decade after the Asian financial crisis in 1997 could be another factor causing such a widened wage gap. In order to assess the important of this concern, the empirical strategy using fraction of workers affected by minimum wage (Card and Krueger, 1995) is adopted with the LFS data for the third quarter of 1994/95 and 1996/97. The reasons why I choose these periods is because they are the last two periods of sizable increase in minimum wage before the Asian financial crisis (around 8.6 - 9.8% rise for every province in July 1995 and 8.2 - 8.7% in October 1996 relative to July 1994 and 1996 respectively). Further, descriptive statistics in table 2.15 and 2.16 show that the characteristics of every sub-group of workers15 in 1994 such as gender, age, average years of education and firm size are
quite similar to those in 1996.
Table 2.5 and 2.6 classify workers into three sub-groups as discussed earlier16. According to the results, only the minimum wage rise in October 1996 has a positive and significant effect (at 5% level) on wage in subsequent year of the 30th percentile for the sub-sample private employees outside the agricultural sector regardless of firm size. This result is still robust after controlling for the average provincial wage in 1996. Conversely, the rise of minimum wage in July 1995 results in negative and significant effects on change in wage of the 25th and 30th percentile of sub-sample male private employees and large firm employees respectively17. Nevertheless, these results are not
13At 5% significant level, the wage compression effect also extends to the 10th percentile of male
only and 20thpercentile of both genders. This result implies that female workers in large firms who are normally received lower wage than male also benefit from the policy.
14
The Kleibergen-Paap rk Wald F-statistic for first stage regression of 2SLS without provincial trend is very low. So, the null hypothesis of Weak identification cannot be rejected even at the maximal IV size of 25% significant level. Still, the model with provincial trend does have a significantly high F-statistic
15which are sub-minimum wage workers, directly affected workers and other workers with higher
wage
16To get comparable results between these sub-groups, I employ only 32 provinces with sizable data
during these periods
17
Table 2.5: The effect of minimum wage (measured by fraction of affected workers) on changes in log wage of different sub-sample from 3rd quarter 1994 to 1995
Percentile All workers Male Private employees Large Firms employees (1) (2) (1) (2) (1) (2) 5 -0.375 -0.389 0.880 -0.711 -0.320 -0.692
(0.644) (0.514) (1.076) (0.664) (0.456) (0.486) 10 0.111 0.102 -0.00874 -0.499 0.295 -0.434
(0.463) (0.371) (0.399) (0.318) (0.465) (0.413) 20 -0.386 -0.394 -0.0143 -0.524 0.609 -0.178
(0.357) (0.301) (0.468) (0.390) (0.419) (0.344) 25 -0.409 -0.416* -0.192 -0.544** 0.791** -0.0609 (0.274) (0.219) (0.243) (0.258) (0.386) (0.240) 30 -0.378 -0.389 0.109 -0.259 0.457 -0.312**
(0.417) (0.276) (0.287) (0.224) (0.296) (0.145) 40 -0.217 -0.228 0.0411 -0.335 0.442 -0.207
(0.389) (0.258) (0.304) (0.265) (0.372) (0.188) 50 0.187 0.174 0.607 0.0254 0.232 -0.203
(0.366) (0.233) (0.409) (0.211) (0.258) (0.186) 75 0.0638 0.0580 -0.413** -0.530*** 0.121 -0.394
(0.529) (0.549) (0.184) (0.180) (0.369) (0.323) 90 0.438 0.433 0.724 0.109 0.258 -0.462
(0.704) (0.729) (0.496) (0.472) (0.381) (0.392) 95 -0.0351 -0.0402 -0.268 -0.831 0.575 -0.105
(0.512) (0.532) (0.822) (0.882) (0.573) (0.628) Average wage No Yes No Yes No Yes Note: Standard errors are in parentheses while ***, ** and * indicate significant at 1% , 5% and 10% level respectively.
Table 2.6: The effect of minimum wage (measured by fraction of affected workers) on changes in log wage of different sub-sample from 3rd quarter 1996 to 1997
Percentile All workers Male Private employees Large Firms employees (1) (2) (1) (2) (1) (2) 5 -0.833** -0.829** -0.790 -1.120* -0.575 -0.267
(0.307) (0.308) (0.477) (0.636) (0.578) (0.603) 10 -0.732** -0.754** 0.0343 -0.170 -0.914* -0.763
(0.304) (0.324) (0.240) (0.309) (0.493) (0.548) 20 -0.163 -0.151 0.856** 0.749* 0.289 0.247
(0.341) (0.322) (0.324) (0.376) (0.189) (0.214) 25 -0.0793 -0.0671 0.621** 0.455 0.231 0.342
(0.372) (0.354) (0.270) (0.272) (0.209) (0.206) 30 -0.274 -0.280 0.610*** 0.489** 0.395** 0.591***
(0.297) (0.305) (0.205) (0.200) (0.170) (0.172) 40 -0.384 -0.386 -0.637 -0.235 0.0170 0.440*
(0.266) (0.279) (0.705) (0.459) (0.290) (0.240) 50 -0.413 -0.484 -0.820 -0.515 -0.399 0.0953
(0.395) (0.374) (0.599) (0.449) (0.457) (0.364) 75 -0.274 -0.435 -1.314 -0.891 -0.445 -0.451
(0.515) (0.497) (0.966) (0.630) (0.384) (0.448) 90 -0.490 -0.642 -2.154 -1.733 -0.597 -0.959
(0.893) (0.865) (1.476) (1.023) (0.468) (0.583) 95 -1.340 -1.432 -3.977* -3.577* -0.853 -1.307
2. Minimum Wage and Wage Inequality in Thailand 30 significant in the regressions without average provincial wage as a control variable.
Although these tables portray conflicting results, timing of the increase in minimum wage could be an explanation for this discrepancy. In particular, the minimum wage hike in July 1st, 1995 is right at the beginning of the third quarter in 1995, whereas the rise in October 1st, 1996 is nine months before the third quarter of 1997. So, it seems that the wage compression effect of the minimum wage depends on not only the market segmentation but also a time lag for ‘law-abiding’ employers to change their wage accordingly. However, the result from 1996/97 supports the claim that only the workers around the second and third decile (in private firms outside the agricultural sector) receive higher wage rises relative to their median counterparts.
After considering results from both methods, it can be concluded that the minimum wage does have a very limited effect on wage inequality. Only employees in large private companies outside agriculture benefit from the reduction in wage gap. Yet within such sub-group, workers with the lowest wage per hour still do not gain from the minimum wage law. Moreover, the series of incremental increases in minimum wages, especially after the Asian financial crisis, do not seem to be an important factor underlying such results. Thus, effectiveness of law enforcement is the most plausible explanation for these results. Some descriptive statistics concerning labour law compliance and models for segmented labour market will be addressed in the discussion.
2.5 Robustness checks
One of the major concerns of using LFS data to analyse the wage inequality at the provincial level is the sample size for wage earners in each province. Moreover, the classification of samples into smaller sub-groups threatens the validity of observed percentiles of wages due to the smaller sample available for percentile calculation. To address this concern, I restrict the sample of provinces to those 32 (out of 76) which consistently have more than 10 respondents in any quarters of the three categories. With the same number of province-quarters in all sub-groups, models 2.3.1 and 2.3.4 are re-estimated.
Regressions based on this restricted sample provide supporting evidence for the results in previous section with a distinct pattern of significance. According to table 2.7 and 2.8, with or without controlling for provincial trends, changes in minimum wage do not have any significant effects (at 5% level) on wage distribution of all wage earners or adult male private employees outside agriculture18. Therefore, the ineffectiveness
specific percentile is smaller in the province with higher fraction of workers affected by minimum wage. Unless there exist significant spillover effect or measurement errors in wage per hour (Autor, Manning, and Smith, 2010), this interpretation is at odds with the fact that the binding of minimum wage in any provinces does not exceed 65th percentile for this sub-sample in those periods. Hence, I decide
not to interpret these counter-intuitive sign of coefficients in this paper.
Table 2.7: The effect of minimum wage on log wage gap of selected percentiles, log(pth) - log(p60), All workers in 32 provinces with sizable sample from 1994 Q1 to 2010 Q1
Percentile OLS 2SLS Predicted Median (1) (2) (1) (2) (1) (2) 5 0.69*** 0.685*** 5.056* -5.267 0.604 -1.811
(0.102) (0.088) (2.887) (10.348) (0.598) (1.256) 10 0.647*** 0.653*** 2.853* -4.099 0.537 -1.411
(0.073) (0.06) (1.496) (8.248) (0.419) (1.024) 20 0.53*** 0.587*** 0.258 -3.004 0.252* -1.036* (0.039) (0.033) (0.388) (5.692) (0.138) (0.626) 25 0.494*** 0.573*** -0.321 -1.855 0.152 -0.644
(0.048) (0.03) (0.567) (3.958) (0.123) (0.553) 30 0.425*** 0.519*** -0.399 -1.645 0.039 -0.569
(0.049) (0.032) (0.523) (3.374) (0.111) (0.445) 40 0.282*** 0.365*** -0.281 -0.569 -0.042 -0.2
(0.028) (0.02) (0.339) (1.629) (0.086) (0.355) 75 -0.054* -0.073** -0.181 0.032 0.019 0.006
(0.032) (0.036) (0.25) (0.786) (0.072) (0.282) 90 0.013 -0.062 -0.281 0.331 0.298 0.119
(0.057) (0.095) (0.623) (1.748) (0.22) (0.664) 95 0.142** 0.09 -0.394 0.998 0.34* 0.339
(0.057) (0.074) (0.71) (2.223) (0.189) (0.762) F-test (weak IV) 1.515 0.217
Year dummy Yes Yes Yes Yes Yes Yes Province dummy Yes Yes Yes Yes Yes Yes Provincial trend No Yes No Yes No Yes Note: Standard errors are in parentheses while ***, ** and * indicate significant at 1% , 5% and 10% level respectively.
Table 2.8: The effect of minimum wage on log wage gap of selected percentiles, log(pth) - log(p60), Sub-sample Male Private Employees age 25-54 outside Agricultural sector in 32 provinces with sizable sample from 1994 Q1 to 2010 Q1
Percentile OLS 2SLS Predicted Median (1) (2) (1) (2) (1) (2) 5 0.601*** 0.645*** 2.443* -0.127 0.308 -0.123
(0.087) (0.108) (1.284) (0.931) (0.34) (0.978) 10 0.642*** 0.717*** 0.321 -0.464 0.161 -0.463
(0.057) (0.06) (0.655) (0.731) (0.17) (0.683) 20 0.581*** 0.635*** 0.139 -0.137 0.233* -0.141
(0.031) (0.036) (0.444) (0.538) (0.122) (0.546) 25 0.518*** 0.57*** 0.219 -0.175 0.183* -0.175
(0.026) (0.026) (0.303) (0.481) (0.108) (0.481) 30 0.51*** 0.568*** 0.227 0.025 0.156* 0.024
(0.028) (0.025) (0.244) (0.439) (0.094) (0.472) 40 0.399*** 0.436*** 0.372* -0.43 0.147** -0.431
(0.025) (0.025) (0.214) (0.442) (0.068) (0.34) 75 0.034 0.035 -0.024 0.03 0.026 0.02
(0.043) (0.05) (0.311) (0.341) (0.079) (0.353) 90 0.02 0.001 0.875 0.355 0.148 0.35
(0.067) (0.08) (0.792) (0.651) (0.168) (0.689) 95 -0.001 -0.062 0.747 1.277 0.408* 1.251
(0.116) (0.124) (0.905) (1.008) (0.232) (1.133) F-test (weak IV) 1.507 3.015
2. Minimum Wage and Wage Inequality in Thailand 32 Table 2.9: The effect of minimum wage on log wage gap of selected percentiles, log(pth) - log(p60), Sub-sample Private Employees age 25-54 in large firms (more than 100 workers) outside Agricultural sector in 32 provinces with sizable sample from 1994 Q1 to 2010 Q1
Percentile OLS 2SLS Predicted Median (1) (2) (1) (2) (1) (2) 5 0.728*** 0.776*** -0.23 1.603*** 0.458** 1.881*
(0.063) (0.059) (0.672) (0.609) (0.222) (0.98) 10 0.718*** 0.745*** -0.482 1.084*** 0.558*** 1.268**
(0.04) (0.041) (0.826) (0.266) (0.127) (0.569) 20 0.653*** 0.673*** 0.339 0.919*** 0.532*** 1.072** (0.031) (0.037) (0.339) (0.316) (0.077) (0.475) 25 0.592*** 0.613*** 0.459 1.072*** 0.48*** 1.257***
(0.032) (0.035) (0.285) (0.337) (0.08) (0.438) 30 0.531*** 0.551*** 0.51** 1.076*** 0.425*** 1.261***
(0.034) (0.037) (0.221) (0.395) (0.067) (0.36) 40 0.413*** 0.432*** 0.553** 0.915** 0.308*** 1.072***
(0.026) (0.029) (0.225) (0.358) (0.056) (0.325) 75 0.03 0.043* -0.145 -0.594 -0.073 -0.705
(0.019) (0.024) (0.209) (0.48) (0.103) (0.5) 90 0.241*** 0.237*** 0.852 0.291 0.263 0.336 (0.055) (0.054) (0.731) (0.649) (0.227) (0.868) 95 0.288*** 0.292*** 0.429 1.422 0.307 1.675
(0.072) (0.067) (0.727) (1.33) (0.308) (1.594) F-test (weak IV) 1.749 2.535
Year dummy Yes Yes Yes Yes Yes Yes Province dummy Yes Yes Yes Yes Yes Yes Provincial trend No Yes No Yes No Yes Note: Standard errors are in parentheses while ***, ** and * indicate significant at 1% , 5% and 10% level respectively. This sample does not include both quarters of 2001 due to a change in definition of a variable ”firm size” in that year.
of minimum wage policy in reducing wage inequality for the whole labour market, or even among eligible workers, is robustly pronounced. Hence, an exclusion of outlier provinces with too small sample in some periods does not seem to alter the main conclusion of this paper.
Furthermore, table 2.9 illustrates even clearer effects of minimum wage on narrow-ing wage gaps among workers in the ‘formal’ segment of the labour market. After con-trolling for provincial trends, all percentiles in the lower part of the wage distribution (5th - 40th) experience positive and significant wage compression pressures towards the median irrespective of model specification. This result leads to a slightly different con-clusion that, instead of just the 20th- 40thpercentile, the whole lower part of the wage distribution is moved closer to the median wage due to minimum wage policy. This minor discrepancy could result from the inclusion of data calculated from provinces with too few respondents in some survey rounds. Hence, some outliers might influence those insignificant results among the low paid workers in previous session while they
Table 2.10: The effect of minimum wage on log wage gap of selected percentiles, log(pth) - log(p60), Sub-sample Private Employees age 25-54 in small and medium firms (fewer than 100 workers) outside Agricultural sector in 32 provinces with sizable sample from 1994 Q1 to 2010 Q1
Percentile OLS 2SLS Predicted Median (1) (2) (1) (2) (1) (2) 5 0.364*** 0.426*** 8.731 -0.073 -0.163 -0.056
(0.108) (0.118) (7.926) (1.707) (0.5) (1.332) 10 0.432*** 0.496*** 5.429 -0.956 -0.182 -0.702
(0.102) (0.101) (5.202) (1.576) (0.339) (1.067) 20 0.449*** 0.5*** 0.835 -0.045 0 -0.025
(0.064) (0.062) (1.657) (0.738) (0.201) (0.573) 25 0.468*** 0.523*** -0.117 -0.438 -0.049 -0.315
(0.054) (0.054) (1.251) (0.798) (0.182) (0.531) 30 0.406*** 0.454*** -0.625 -0.221 -0.031 -0.167
(0.044) (0.044) (1.008) (0.542) (0.151) (0.384) 40 0.298*** 0.328*** -0.555 -0.124 0.028 -0.088
(0.035) (0.038) (0.667) (0.428) (0.105) (0.323) 75 0.116*** 0.115** 0.058 0.848 0.171** 0.627** (0.04) (0.046) (0.402) (0.585) (0.071) (0.308) 90 0.176** 0.172* 1.086 0.672 0.243 0.478
(0.089) (0.09) (1.412) (0.819) (0.221) (0.516) 95 0.128 0.097 2.782 1.015 0.441 0.742
(0.108) (0.104) (2.716) (1.117) (0.298) (0.68) F-test (weak IV) 0.828 2.362
2. Minimum Wage and Wage Inequality in Thailand 34 could not induce the results with more robust data from these 32 provinces19. Thus,
wage compression effects of the minimum wage law among these large firms could be stronger than what table 2.4 suggests.
2.6 Discussion
The evidence for the impacts of minimum wages on wage inequality in Thailand sug-gests that wage compression effect is confined to only low paid workers in the formal sector of the labour market (as classified by firm size). Although increases in the min-imum wage did not fully compensate for the rise in inflation after the Asian financial crisis, it is shown that this is unlikely to be the major force behind the result. Specif-ically, even in the years with significant increase in real minimum wage, the impact of minimum wage is still determined by market segmentation. Therefore, imperfect com-pliance with minimum wage law (not the non-coverage20), especially in the informal sector, is the most plausible factor driving this pattern.
One explanation of the high non-compliance rates could be the relatively low ex-pected loss from such illicit act. In terms of penalty, according to Labour Protection Act 199821, any employers paying wages lower than the legislative minimum are
li-able for a fine not exceeding 100,000 baht or up to 6-month imprisonment or both. Based on minimum wages in 2001, the upper limit of this fine is worth more than 600 worker-days for every province, which is a high penalty for employers in smaller firms. However, the probability of being caught and severely punished is another factor forming employers’ expectation of the cost of non-compliance. To assess the effec-tiveness of minimum wage law enforcement, I explore the data on labour inspection conducted by Department of Labour Protection and Welfare from 2006 to 2010 as shown in table 2.17. Although the inspection rate is 12-13 % of all establishments each year, more than 94% of firms violating any labour law receive only a warning. Less than 0.3% of all wrong-doing establishments are fined or prosecuted. Such a small probability of being severely penalized should lower the employers’ expected loss from paying sub-minimum wage. Thus, this weak law enforcement is in line with the ineffective minimum wage policy observed22.
19
However, insignificant Kleibergen-Paap rk Wald F-statistic for all 2SLS in table 2.7 - 2.9 does raise a concern on weak identification of instrumental variables. This might be a result of restricting the sample to just 32 out of 76 provinces. All in all, the weak identification problem does not invalidate the whole results because models based on predicted median still consistently provide supporting evidence for the same conclusion.
20
Unlike developed countries where non-coverage can be one of the major concerns, developing countries seems to suffer more from non-compliance even in the covered sector (Strobl and Walsh, 2003)
21
Such law dates back to the period before the first minimum wage law. However, this one is still enforced up to present
22
Another explanation for higher compliance among larger firms is the efficiency wage theory. Rebitzer and Taylor (1995) set up a simple efficiency wage model where employers use dismissal as a disciplinary device to prevent shirking. Further, they assume that the supervisory resources of firms are fixed and the firms capacity to closely supervise is decreasing with number of employees23. So, an increase in minimum wages raises the cost of dismissal and induces workers in large firms to assert higher effort. Using the survey data from the UK residential care homes industry after the introduction of National Minimum Wage in 1999, Georgiadis (2013) finds the evidence that supports this efficiency wage hypothesis.
Interestingly, table 2.17 shows that the non-compliance rate had been decreasing from 4.7% in 2006 (2,100 out of 44,658 establishments) to 1.26% in 2010 (625 out of 49,463 establishments). This improvement in compliance can be depicted from the data through Kernel density and Cumulative distribution plots of log hourly wage in figure 2.3 - 2.6. The comparison between wage distribution in 1994/95 and 2007/08 shows a strong surge in compliance rates of both the formal and informal sectors. While the peak of wage distribution in the formal sector is around the highest provincial minimum wage in 1995 and 2008, the peak does not prevail among informal workers until recently.
It is worth noting that our discussion on compliance problem and ineffectiveness of minimum wage policy is consistent with the segmented labour market (or two-sector) models such as Lewis (1954), Harris and Todaro (1970), Gramlich (1976), Mincer (1974a) and Welch (1974). Although the Lewis model, which comprises of backward agricultural sector in rural area and modern urban (manufacturing and service) sector, seems to be plausible framework for a country with large agricultural sector, the effects of minimum wage do not differ pointedly between urban and rural nor the covered industrial and uncovered agricultural sector. It is divided by formal (compliance) sector and informal (non-compliance) sector. Hence, if the formal sector is treated as covered sector, the Welch-Gramlich-Mincer two-sector model can be adopted to analyse the results.
Firstly, wage compression effects happen only in the formal sector with a single peak of wage distribution around the legislative minimum wage. Second, those informal workers in covered sector do not appear to experience any wage compression effects. Moreover, the legislative minimum wage does not generate any spikes in informal wage distribution except for periods of expansion in compliance. These observations are in
an equilibrium phenomenon for a government with a credibility problem.
23