The London School of Economics and
Political Science
E
SSAYS ON VIOLENT CONFLICT
IN DEVELOPING COUNTRIES
:
C
AUSES AND CONSEQUENCES
Anouk Sarie Rigterink
A thesis submitted to the Department of International
Development of the London School of Economics and
Political Science for the degree of Doctor of Philosophy,
London.
Declaration
I certify that the thesis I have presented for examination for the MPhil/PhD degree of the London School of Economics and Political Science is solely my own work other than where I have clearly indicated that it is the work of others (in which case the extent of any work carried out jointly by me and any other person is clearly identified in it).
The copyright of this thesis rests with the author. Quotation from it is permitted, provided that full acknowledgement is made. This thesis may not be reproduced without my prior written consent.
I warrant that this authorisation does not, to the best of my belief, infringe the rights of any third party.
I declare that my thesis consists of 51,266 words.
Statement of conjoint work
I confirm that Chapter 3 of this thesis was co-authored with Dr. Mareike Schomerus. The overall argument of this Chapter, and the data gathering tool was developed jointly. I contributed the analysis of the survey data and wrote the full first draft of this chapter, Dr. Schomerus contributed the analysis of the interviews and added to and corrected subsequent versions. I estimate that I contributed 75 per cent of the total work.
Statement of inclusion of previous work
I confirm that some results of previous study (for the degree of Master of Science at the London School of Economics and Political Science) have been significantly expanded, and folded into the second section of Chapter 1 of this thesis.
Statement of use of third party for editorial help
Abstract
This thesis consists of three essays, on the causes and consequences of violent conflict. It focuses on two factors that are thought to play a role in violent conflict, natural resource abundance and the media.
The thesis exploits quasi-experimental variation to investigate whether natural resources and violent conflict are related, and if so, through which mechanism. It finds that evidence from cross-country studies indicating that natural resources (as a single category) cause violent conflict is not as robust as popularly believed. Proxies for natural resource abundance used are potentially endogenous to conflict, and addressing this issue changes the results obtained radically. Agricultural resources are found to be negatively related to civil war onset. In the case of diamonds specifically, evidence is found that primary diamonds, but not secondary diamonds, are related to violence. Both results provide support for income (or opportunity cost) as mechanism connecting natural resources and violent conflict.
Table of contents
Acknowledgements
7
Introduction
9
CHAPTER
1
14
Natural Resources and Violent Conflict
14
Introduction 14
Cross-country empirical studies: are resources and civil war related? 16 Investigating endogeneity: is the relationship robust? 22
Measuring natural resources: natural and subsoil capital 22
Empirical strategy 31
Results 32
Theoretical models and mechanisms: the ‘how’ of this relationship 41 More empirics: which mechanism(s) do the data support? 43
The opportunity cost of conflict versus the returns to conflict mechanism 44
Quality of government mechanism 46
The credit constraint mechanism 48
Conclusion and Policy Implications 49
CHAPTER 2
52
Diamonds and violent activity in Africa
52
Uncovering relationships and mechanisms 52
Introduction 52
Theoretical models 56
Garfinkel, Skaperdas and Syropoulos: property rights and returns to conflict 56
Dal Bó and Dal Bó: wages and the opportunity cost of conflict 58
Besley and Persson: the ‘prize’ of government and the returns to conflict 60
The case of diamonds 61
Existing country case studies on diamond mining, wages and conflict 61
Data and methodology 64
Diamonds: some geology 64
An alternative measure of diamond abundance: diamond propensity 68
Methodology 73
Data 74
Results 75
Robustness 78
Endogeneity of diamond price 78
Cyclical effects and other resources 82
Mechanisms: wage rate versus the ‘prize’ of government 85
Conclusion and policy implications 87
CHAPTER 3
90
Information is liberating?
90
Results from a natural experiment on the impact of radio on anxiety, and anxiety on
Introduction 90
Theory and Literature 92
Media information and anxiety 93
Anxiety and political attitudes 95
Media and state-building 96
Background and context 96
LRA and fear 97
Arrow Boys and other armed actors 97
Attitudes towards the central government and the SPLA 98
Media and Information 99
Data and methods 99
Data 99
Natural experiment: Yambio FM 101
Hypotheses and models estimated 109
Results 115
Yambio FM and fear of the LRA 115
Robustness: radio and fear 118
Mechanisms: Yambio FM and fear 123
Impact of anxiety: the Arrow Boys and the SPLA 127
Impact of anxiety: mechanisms 130
Conclusion and discussion 132
Conclusion
135
References
137
Appendix A
148
List of tables
Table 1: Summary of findings of various cross-country empirical studies ... 18
Table 2: Correlation between measures of resource abundance, over time ... 30
Table 3: Replacing natural resource abundance in Collier and Hoeffler (2004) ... 33
Table 4: Using different years of measurement ... 34
Table 5: Instrumental variable models ... 36
Table 6: Cross-country models of natural resouce abundance and violent conflict ... 37
Table 7: Replacing natural resource abundance in Collier, Hoeffler and Rohner (2009) ... 39
Table 8: Opportunity cost of conflict mechanism ... 46
Table 9: Quality of government mechanism ... 48
Table 10: Diamond propensity versus diamond occurrence and production... 70
Table 11: Correlation coefficients for various measures of diamond abundance ... 72
Table 12: Diamonds and violence. Baseline results ... 76
Table 13: Different diamond prices ... 77
Table 14: First stage IV model ... 80
Table 15: Instrumenting for diamond price ... 81
Table 16: Controlling for cyclical effects and the presence of other resources ... 84
Table 17: Diamonds and Violence. Mechanisms ... 86
Table 18: Correlation between residual radio reception and various boma, individual and household level characteristics ... 105
Table 19: Yambio FM and fear. Baseline results ... 116
Table 20: Controlling for LRA activity ... 119
Table 21: Controlling for presence of other armed forces ... 121
Table 22: Controlling for various other factors ... 122
Table 23: Yambio FM and fear. Mechanisms ... 124
Table 24: Fear and political authority ... 128
Table 25: Reception of Yambio FM and political authority. ... 129
List of figures
Figure 1: World distribution of natural resources according to different measures ... 25Figure 2: Primary diamond propensity ... 66
Figure 3: Secondary diamond propensity ... 67
Acknowledgements
I would like to thank a number of people for supporting me in various ways, academically and personally, during all years of my PhD.
Dr. Diana Weinhold, my supervisor, for her sharp insights and helpful comments throughout, and her encouragement during all phases of my PhD, from application to submission.
Dr. Mareike Schomerus, my colleague, co-author and friend, for making our work together so inspiring and pleasant, and for offering so many good pieces of advice and words of encouragement.
My colleagues at the Security in Transition Research Programme for many productive discussions, and Prof. Mary Kaldor, Dr. Iavor Rangelov and Dr. Sabine Selchow in particular for comments on the first, and last two chapters of this thesis.
My colleagues at the Justice and Security Research Programme, for the many discussions and insights that led to the third chapter of this thesis.
John J. Kenyi and Andrew Takoyo, Archangelo Rangabia, Justin Boroberani, Mark Michael, Morris Santo, Moses John K. and Rose Dunguyo, for their work executing the survey resulting in the data for the third chapter of this thesis.
Dr. Ha-Joon Chang for going above and beyond by commenting extensively on the first chapter of this thesis.
My fellow PhD students at the Department of International Development, too many to name here, for so many conversations, in the office or in the White Horse, that made the process that much more pleasant.
Akanksha Awal, Sam Vincent and Wendy Foulds, for each proofreading a chapter of this thesis.
Lastly, but most importantly, Arne T. Wolters, my partner, for his unwavering faith in me and for being deeply supportive in so many ways. Just mentioning his copy-editing skills or expertise in the field of data would not do his support justice.
Furthermore:
for Policy Dialogue Advanced Graduate Workshop on Poverty, Development and Globalization, the German Institute for Economic Research, the Stockholm International Peace Research Institute, the Uppsala Conflict Data Programme and the Conflict Research Group at the University of Ghent, for insightful feedback and comments on the various papers that became this thesis.
With gratitude, I acknowledge financial support from the following. Prins Bernhard Cultuurfonds and Fundatie van de Vrijvrouwe van Renswoude, The Netherlands, supported me financially in the second and first year of my PhD research respectively. The UK Department for International Development (DfID), through the Justice and Security Research Programme, has funded the research that led to the third chapter of this thesis. I am also grateful to have received a scholarship from the Security in Transition Programme, funded by the European Research Council in the third, fourth and fifth year of my PhD.
Introduction
This thesis consists of three essays, on the overarching theme of violent conflict and insecurity. It empirically investigates two factors that are thought to be related to violent conflict: natural resources and media. Specifically, this thesis explores the relationship between violent conflict and natural resources in general and diamonds in particular, and the role of the media in contributing to feelings of (in)security and in promoting state-building in conflict-affected situations.
Given the common theme of causes of violent conflict, this thesis contributes to a rapidly expanding literature in economics and political science. Blattman and Miguel (2009) give a comprehensive overview. According to these authors, the past ten years have seen an “explosion” in research on violent conflict, especially in economics, a field that until twenty years ago largely ignored the topic. They divide the existing literature in three categories - theoretical models of violent conflict, empirical research into its causes, and consequences of violent conflict - and provide recommendations for future research for each. The authors conclude for example that too little empirical work is informed by a formal theoretical model, that many works are subject to econometric identification problems - especially those that investigate the relationship between violent conflict and natural resources, social divisions and political grievances respectively - and that evidence is weakest on the effect of violent conflict on the institutions, technology, social norms and culture (Blattman and Miguel 2009).
This thesis contributes to the literature in Blattman and Miguel’s last two categories: empirical research into the causes and consequences of violent conflict. Following the recommendations for future research by these authors, this thesis places particular emphasis on econometric identification, exploiting various quasi-experimental sources of variation. Furthermore, when a relationship between violent conflict and a particular cause is identified, it investigates the mechanism underpinning this relationship, where possible employing a formal theoretical model. Lastly, the third chapter on media and violent conflict investigates the impact of fear of violence on specific social norms and institutions: trust in various forms of authority, and the authorities that people turn to in case of trouble. It thereby contributes to a topic that Blattman and Miguel identify as particularly under-researched.
resources as a percentage of GDP may increase in anticipation of conflict (if GDP declines more strongly than natural resource exports in anticipation of conflict), may increase as a result of conflict (various theoretical models suggest that conflict increases the pace of natural resource extraction), or may be correlated to a third factor related to conflict (natural resource extraction may be correlated to the government’s discount rate). This may seriously impede the ability of studies using this measure to demonstrate a causal relationship between natural resource abundance and war.
The chapter investigates to what extent results of cross-country studies on natural resources and war are driven by endogeneity, by testing whether results from a number of these studies are robust to (a) replacing the original, arguably endogenous, proxy for natural resource abundance with two arguably more exogenous measures; and (b) instrumenting for the original proxy using the latter two measures. The exogenous measures used are subsoil capital and natural capital; measures of the net present value of the stock of natural resources in the economy. Chapter one replicates the results from two studies that find the strongest effect of natural resources on civil war (Collier and Hoeffler 2004; Collier, Hoeffler, and Rohner 2009), and replaces the original proxy for natural resource abundance with natural and subsoil capital. Furthermore, it uses natural and subsoil capital as instruments for the original proxy. Since these studies find the strongest relationship initially, these constitute the ‘toughest test’ if one wants to prove that the results are spurious. The chapter concludes that results from these studies are not robust to changing the measure of natural resource abundance, nor to instrumenting for it: the relationship between natural resources and civil war onset disappears when doing either.
This, combined with results from other cross-country studies, leads the chapter to conclude that evidence that natural resources as a single category cause civil war onset is not as robust as is popularly believed, especially where it stems from cross-country studies.
The second chapter also investigates the relationship between natural resources and violent conflict, focussing on one specific resource: diamonds. Diamonds mined in conflict areas, sometimes dubbed ‘blood diamonds’, have received particular attention from activist campaigns, were the subject of a popular movie, and are the focus of the Kimberly Process Certification Scheme. Mirroring the previous chapter, chapter two is particularly concerned with identifying an exogenous source of variation in diamond abundance, and with the mechanism(s) connecting diamonds to violence.
The chapter focuses on two mechanisms introduced earlier, the returns to conflict mechanism (Garfinkel, Skaperdas, and Syropoulos 2008) and the opportunity cost of conflict mechanism (Dal Bó and Dal Bó 2004). These mechanisms make opposite predictions for two types of diamonds: primary and secondary diamonds. Primary diamonds are mined in capital-intensive mines for which property rights can be clearly established. Secondary diamonds are extracted from long stretches of river, making it difficult to establish property rights, and production requires little more capital than shovels, buckets etc. The returns to conflict mechanism would suggest that secondary diamonds, lacking clear property rights, would be connected to violent conflict. By contrast, the opportunity cost mechanism predicts that the capital-intensive primary diamonds would be related to violence. The chapter also considers a third theoretical model by Besley and Persson (2008).
All models suggest that natural resource production increases as a response to conflict. Hence, existing data on diamond production is potentially endogenous to conflict, and production data is likely unreliable, especially where it stems from conflict zones. Therefore, the chapter constructs an indicator for the geographic propensity of an area to hold diamonds, using geological factors. The occurrence of diamond follows a number of geological regularities. For example, primary diamonds are found in areas where the bedrock is a particular age, and secondary diamonds are transported away from this original source up to a known distance, through rivers.
prices and controlling for cyclical effects. Similar results supporting the opportunity cost mechanism are found for other resources, notably primary and secondary gold.
Taking these results at face value, they could have implications for policy, especially for the Kimberley Process Certification Scheme (KPCS). This scheme attempts to exclude illegally mined diamonds from the market, essentially driving their price down to zero. Case studies of countries producing secondary diamonds indicate that the KPCS is most likely to affect informally mined secondary diamonds, because obtaining a licence to formalize diamond production is prohibitively expensive for artisanal miners. These case studies also suggest that diamonds mined using artisanal methods contribute to the livelihoods of individuals. The analysis in this thesis however, finds no support for a link between secondary diamonds and conflict. The opportunity cost mechanism even suggests that decreasing the price of a labour-intensive resource providing people with a wage may increase violence, although this supposition is not supported by the data analysed.
Natural resources are one factor though to play a role in violent conflict. Media is another. Policy documents assert that media, especially radio, contribute to peace building and state building. Establishing a national radio station appears to have become a standard component in UN peace missions (Orme 2010). Alternatively, it has been suggested that ‘hate speech’ spread by the media spurs violence (Straus 2007; Yanagizawa-Drott 2012). On the other hand, it has been suggested that exposure to media increases fear of victimization, although this literature is focussed on established democracies, and frequently fails to identify a causal relationship between media and fear (Dowler 2003; Eschholz 1997; Heath and Gilbert 1996). Furthermore, there has been increasing interest in the role of emotions, specifically fear or anxiety, in the formation of political attitudes (Neuman et al. 2007). The third chapter of this thesis investigates the impact of exposure to radio broadcasts on anxiety and the impact of anxiety on political preferences, using a natural experiment in South Sudan. This chapter is co-authored by Mareike Schomerus.
Specifically, this chapter investigates whether exogenous variation in signal strength of a particular radio station broadcasting about the Lord’s Resistance Army (LRA) affects individuals’ level of fear of being victimized by the LRA. Furthermore, it investigates the impact of increased anxiety on political attitudes. It concludes that people living in areas with better radio reception fear the LRA more and that fear of the LRA, as instrumented by radio reception, is positively related to support for a civilian protection militia, The Arrow Boys, and negatively related to support for the government army. This result is robust to controlling for actual LRA activity, presence of other armed forces, distance to the CAR or DRC border, phone coverage, displacement and date-of-enumeration.
portrayed by the media. Two main theories that describe the relationship between anxiety and political attitudes are Affective Intelligence and Affect Transfer. The chapter considers those mechanisms that provide testable implications, and finds suggestive evidence in favour of availability and Affective Intelligence.
CHAPTER
1
Natural Resources and Violent Conflict
Abstract
This chapter argues that evidence that natural resources cause civil war onset is not as robust as popularly believed, especially where it stems from cross-country studies. The idea that natural resources spur conflict has reached a certain degree of acceptance among scholars and policy makers with a number of influential cross-country studies finding a positive relationship between natural resource abundance and civil war. This chapter argues that the proxy for natural resources abundance used in a number of these studies is endogenous to the models estimated, seriously undermining the ability of these studies to demonstrate a causal relationship between resources and conflict. In this chapter, I adopt two plausibly more exogenous measures of natural resource abundance. When replicating those studies that find the strongest effect of natural resources on civil war (Collier and Hoeffler 2004; Collier, Hoeffler, and Rohner 2009), using these more exogenous measures of resource abundance, no evidence is found that natural resource abundance leads to higher civil war risk. The chapter further assesses empirical support for theoretical models detailing the mechanisms connecting natural resources and violent conflict. The mechanism that has received the most empirical support, hypothesizing that the price of natural resources influences wages or income and thereby the opportunity cost of conflict, has not been widely translated into policy.
Introduction
The literature on this topic is extensive and ‘natural resources’ is potentially a wide category. Hence, setting some boundaries and definitions is in order. For the purpose of this chapter, the term ‘natural resources’ refers to tradable primary commodities, including agricultural products, timber, narcotics, fossil fuels, metals and gemstones. Natural resource abundance refers to the quantity of natural resources present in a country, and is conceptually distinct from natural resource production or export. This chapter does not engage with the effect of scarcity, degradation or depletion of stocks of renewable resources on violent conflict. A flourishing literature surrounding this topic exists (a good starting point for the interested reader is the theme number of Political Geography, volume 26 issue 6). The literature on scarcity seems, at least on the surface, at odds with literature on primary commodities and conflict: the former argues that scarcity of resources leads to violence, the latter that an abundance of resources leads to violence.
Furthermore, the chapter will focus almost exclusively on quantitative literature. This is not to say that this is the only field in which interesting research on natural resources and violent conflict is being done. However, quantitative research on resources and war has been very prominent in influencing policy makers and popular perceptions: the most-cited article on this topic (Collier and Hoeffler 2004) uses quantitative methods, an early version of which was published under auspices of the World Bank, whilst its popular translation, the Bottom Billion, made the bestseller lists in 2007. As the idea that natural resources and violence are connected has definitely conquered a place in the public consciousness, it is interesting to examine more closely how rigorous the analyses that form the foundation of this belief are.
This chapter will argue that the link between natural resources and civil war onset, as apparent from studies exploiting cross-country variation is not as strong as popularly believed. Over the recent years, evidence that these studies fail to identify a causal relationship between natural resources and violence has been piling up.
2006). I then reproduce the exact models estimated by Collier and Hoeffler (2004) and Collier, Hoeffler and Rohner (2009), replacing the original proxy for natural resource abundance with the plausibly more exogenous measures. When doing this, the relationship between natural resources and conflict becomes insignificant or negative. Furthermore, I use natural and subsoil capital as instruments for natural resource exports, and oil production. Instrumental variable models also fail to find a positive relationship between civil conflict and predicted natural resource exports or oil production respectively.
The chapter then critically assesses empirical support for a number of theoretical models detailing potential mechanisms connecting natural resources and conflict. This question is important from a policy point of view, as some policies would seem effective if we have one mechanism in mind, but would be ineffectual, or even have adverse effect, from the perspective of another. This topic has been reviewed before (e.g. (Humphreys 2005; Ross 2004)). However, as this particular field has evolved rapidly over the last ten years, and numerous new theoretical models have been proposed and empirical studies done, an updated investigation of evidence regarding the mechanisms connecting natural resources and violent conflict appears to be in order. Furthermore, this chapter will investigate these mechanisms using data from Collier and Hoeffler (2004) and Collier, Hoeffler and Rohner (2009).
Although not all mechanisms have been tested empirically at the time of writing, the chapter concludes that the opportunity cost of conflict mechanism has received the most support, both from existing literature and from the analysis presented. However, this mechanism does not appear to have been translated widely into policy.
The remainder of this chapter is organized as follows. The first section reviews studies using cross-country variation, considers a number of reasons for why conclusions differ markedly between studies and relates some critiques of this particular research design. The second section investigates the robustness of the conclusions from Collier and Hoeffler (2004) and Collier, Hoeffler and Rohner (2009) to replacing, or instrumenting for, the original proxy of natural resources abundance. The third section provides the intuition behind several theoretical models on mechanisms connecting resources and conflict. The fourth section tests these theoretical models empirically, and reviews other studies investigating the same question. The final section concludes and highlights some policy implications.
Cross-country empirical studies: are resources and civil war related?
country or area experience more violence at a time when it has or produces more resources?). This section will focus on studies that rely at least partially on cross-country variation, which I will refer to as ‘cross-country studies’ for ease of reference. It should be noted that most studies discussed use panel data and base their conclusions on variation over time as well as comparisons between countries.
The basic set-up of cross-country studies is similar. They attempt to explain the onset of civil war, using a range of economic, social, political and geographical factors as explanatory variables, of which the production, rents, exports or stocks of natural resources is one. The period under study starts at either 1945 or 1960 and extents as far as data availability allows, and all the world’s countries for which data is available are included in the sample. Civil war onset measured as a one or a zero, where one means that a civil war started in a particular country in a particular year and zero means no such war started. For violence to constitute a civil war, it has to have some political motivation, the government needs to be party to it and it has to have resulted in at least 1000 ‘battle-related deaths’. In practice, the last criterion is usually the hardest to satisfy, so whether violence gets coded as a civil war depends heavily on the number of battle-related deaths recorded. In addition to natural resources, factors hypothesized to influence the chance of a civil war onset may include GDP, the size of the population, level of ethno-linguistic or religious fractionalization/polarization, levels of democracy and inequality, years since the last civil war, an indicator for how mountainous a country is and an indicator for non-contiguous territory.
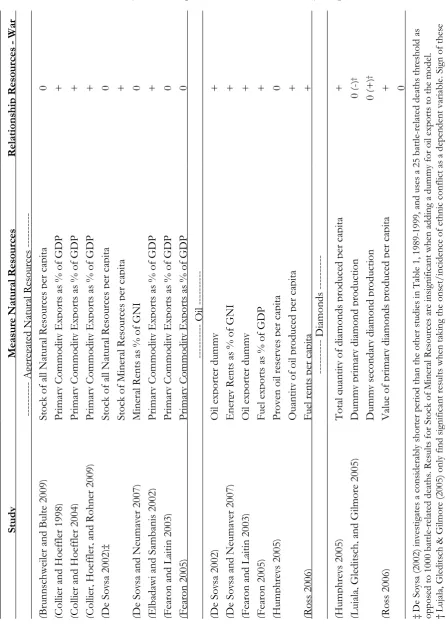
Despite the similarities in set-up, conclusions from cross-country studies differ markedly, as Table 1 illustrates. The table shows how various studies measure natural resource abundance and whether the study finds a positive (+), negative (-) or no statistically significant relationship (0) between natural resources and civil war onset. From the top panel, we can see that there is no consensus on whether natural resources as a single category increase the chance of violent conflict, with roughly half of the studies finding a positive relationship between the two and the other half concluding that no relationship exists. Most studies that do find that natural resources increase war risk use primary commodity exports as a percentage of GDP as an independent variable, although Fearon and Laitin (2003) and Fearon (2005) do not support this conclusion even though they use the same measure. Studies using stocks of natural resources generally fail to find a connection between resources and violent conflict onset.
A more clear-cut picture emerges from investigations into oil or fossil fuels specifically: all studies conclude that oil is associated with civil war onset and results are similar for virtually all measures of oil abundance. The only notable exception is oil reserves, again a measure of resource stocks (Humphreys 2005).
Table 1: Summary of findings of various cross-country empirical studies
R el at io ns hi p R es ou rc es - Wa r ---- Ag gr eg at ed N at ur al R es ou rc es -- ---
0 + + + 0 + 0 + 0 0
---- O il ----
+ + + + 0 + +
---- Di amon ds -- ---
+ †0 (-)
that can be mined using artisanal techniques and are considered easily ‘lootable’. Humphreys (2005) concludes total diamond production is positively related to civil war onset, whilst Lujala, Gleditch and Gilmore (2005) find that both primary and secondary diamond production are unrelated to war onset in general. The latter continue to conclude that primary diamonds are negatively, and secondary diamonds positively related to ethnic war onset, whilst Ross (2006) finds the exact opposite concluding that primary diamonds are positively, and secondary diamonds negatively related to both civil war onset in general and ethnic war onset. Given that results on the relationship between diamonds and violent conflict differ strongly between studies, diamonds as a specific natural resource merit further investigation. This will be the subject of the next chapter.
What explains this lack of agreement (with the exception of results on oil)? It is likely that many reasons exist, but a number have been systematically explored. Fearon (2005) investigates why Collier and Hoeffler (2004) and Fearon and Laitin (2003) do not come to the same conclusion, despite using the same measure of natural resource abundance. He concludes that Collier and Hoeffler’s results are an artefact of how they split up the research period (in intervals of five, rather than one year), their decision to drop observations for which no data is available rather than to impute the missing data and keep them in the sample, and their specific set of control variables. When Fearon changes some combination of these relatively arbitrary decisions, he is no longer able to find a positive and significant relationship between natural resource exports as a percentage of GDP and civil war onset.
Another potential reason for the lack of consensus may be that various studies use different datasets on civil war onset (Sambanis 2004). Although these datasets have very similar definitions of war as noted above, Sambanis shows that seemingly minor differences in coding rules can have substantial consequences for how many wars are included and in what year the start of a war is recorded. Some examples of these differences are: is the 1000 battle-related deaths threshold cumulative over the entire duration of the conflict or per year? When is a conflict first recorded: in the year the first violence takes place or the first year the conflict crosses the deaths threshold? What to do with a conflict that slowly accumulates deaths over time until it exceeds the threshold, whilst we would intuitively not characterize it as a civil war? What to do when violence ‘dips’ below the casualty threshold for one or more years – when would we code this as a continuation of an old conflict and when would we code a new war start? Sambanis shows that very few variables that supposedly explain civil war onset consistently do so across all war databases. Even the dummy for oil exporters, a measure that has given consistent results across all studies in Table 1, is sometimes positively and sometimes unrelated to war, depending on the database chosen.
these 88 variables and look at the distribution of the coefficients for each variable. None of the five measures for natural resources, including two measuring oil exports, makes their cut-off for variables that are systematically related to civil war onset.1
Does it matter that results are not the same across studies? It matters if we think that all studies are equally credible, and had they all come up with the same conclusions, we would have believed that natural resources cause civil war. It matters less if we think that not all of these studies credibly identified a causal relationship to begin with, so we would not trust their conclusions even if they had all drawn the same one, or if we are more inclined to believe certain studies over others.
Do cross-country empirical studies succeed in showing that natural resources cause civil war? A major problem in identifying a causal relationship is that natural resource exports or production may be endogenous. In other words: certain countries may export or produce a large amount of natural resources for a reason, and that reason may not be independent of violence. Natural resource exports as a percentage of GDP is most suspicious in this regard. This indicator does not measure resource abundance, but rather resource dependence (Brunnschweiler 2008). Countries that are resource dependent usually display a number of other characteristics, such as poverty, ‘bad’ governance and ‘bad’ institutions, any one of which can make a country more likely to experience a civil war. So if we observe a positive relationship between natural resource exports as a percentage of GDP and civil war start, it is impossible to tell whether this means that natural resources cause war or that any of these other characteristics cause both natural resource dependence and war risk. Expressing natural resource exports as a percentage of GDP is a further source of endogeneity. It is plausible that productive activity, and with that GDP, will decline in anticipation of civil war. Natural resource exports will likely not decline as steeply, as these industries are location-specific and hence harder to move out of the country. Thus, the ratio of natural resource exports as a percentage of GDP may increase in anticipation of civil war, rather than the civil war breaking out in response to natural resource exports (Ross 2004).
It has been argued that the production, rents (the value of production net of extraction costs) or exports of natural resources per capita are free of these endogeneity problems (Ross 2006). However, over the last years, numerous theoretical models have suggested that they are not. A main argument for this is that the pace at which a country extracts natural resources is a choice: a choice that is influenced by the country’s institutions and often made by its government. Chichilinsky (1993) originally modelled this in the case of renewable resources. Her model features two otherwise identical countries with a different level of property rights, and predicts that the country with the poorer property rights exploits resources at a higher pace and thereby appears more resource abundant (Chichilnisky 1993). One of the theoretical models presented in the third section of this chapter similarly predicts that countries in conflict export more natural resources if the property rights to that resource are insecure (Garfinkel, Skaperdas, and Syropoulos 2008). Hence,
we may observe that natural resource production or exports and violent conflict correlate not because they are causally related, but because they are both a consequence of a poor institutional environment.
A variation of this argument is that the pace of natural resource extraction may be an indicator of the government’s discount rate, and that this in turn is related to conflict risk. The government’s discount rate can be taken as given: a government that intrinsically cares more for the future will choose a slower pace of natural resource extraction and better overall policies, and will therefore be less at risk of civil war. Alternatively, the government’s discount rate can be a function of the probability of it being overthrown: a government that chooses poor policies will be at higher risk of being ousted, either violently or otherwise, and therefore will care less about its country’s future stock of resources and more about grabbing what it can now. Indeed, a theoretical model by Robinson, Torvik and Verdier predicts that governments will over-extract resources compared to the efficient extraction path, especially when their political position is insecure (Robinson, Torvik, and Verdier 2006). Relatedly, if the government foresees a violent conflict, it may speed up the pace of natural resource extraction to finance military expenditure, although this argument relies on the absence of other cost-effective ways of raising war finance.
Another theoretical model presented in the third section of this chapter predicts that the production of capital intensive natural resources increases with conflict (Dal Bó and Dal Bó 2004). Thus, the model expects exports and production of resources to increase in response to conflict as well as the other way around, and this two-way causation poses a further challenge for studies using export or production numbers.
From the measures of natural resource abundance in Table 1, the stocks of natural resources per capita are plausibly the least endogenous, as the amount of oil a country possesses is a geological fact. It is not entirely free from suspicion though, as the present stock of natural resources is a result of past extraction decisions and we may simply not have discovered natural resource deposits in the world’s most unstable areas yet. However, it seems harder for a government to meaningfully influence future resource stocks than present resource extraction, and it seems doubtful that resources nobody knows about will affect politics at all. If we believe that resource stocks are more exogenous, we would put most faith in the conclusions of studies using stock measures. From Table 1, we can see that virtually all of these conclude that there is no causal relationship between natural resources and the onset of civil war.
Investigating endogeneity: is the relationship robust?
Although the argument that natural resource exports as a percentage of GDP is endogenous has been made by numerous authors (Besley and Persson 2008; Blattman and Miguel 2009; Brunnschweiler and Bulte 2009; Humphreys 2005; Ross 2006), the extent to which conclusions from studies using this measure are driven by endogeneity is a matter for empirical investigation. This section investigates this. To do so, I select the two studies that find the strongest relationship between natural resources and civil war, those by Collier and Hoeffler (2004) and Collier, Hoeffler and Rohner (2009). Because these studies find the strongest relationship initially, they provide the ‘toughest test’ when one wants to show that these results are in fact spurious. Both studies use natural resource exports as a percentage of GDP as a proxy for resource abundance. As the previous section has illustrated, this particular measure is subject to serious endogeneity problems. I replace this proxy for natural resource abundance with a number of plausibly more exogenous measures and assess to what extent this affects the results obtained. In addition, I use the arguably exogenous variables as instruments for potentially endogenous measures of natural resource abundance.
Within the framework of the ‘resource curse’ literature, it has been established that the measure of natural resource abundance used can have substantial impact on the conclusions drawn. The ‘resource curse’ literature attempts to establish whether there is a negative relationship between natural resource abundance and economic growth. Using natural resource exports as a percentage of GDP as a measure of natural resource abundance, one would arrive at this conclusion (Sachs and Warner 1995, 2001). However, Brunnschweiler (2008) argues that this is due to the endogeneity problems described above. When she uses natural and subsoil capital (measures of the value of the stock of natural resources per capita explained in more detail below), the observed relationship between natural resource abundance and growth becomes either insignificant or positive (Brunnschweiler 2008). It would thus be interesting to see if a similar radical change would result from using these measures in the context of conflict.
Measuring natural resources: natural and subsoil capital
Subsoil capital consists of the net present value (NPV) of the flow of rents from exploitation of stocks of four fossil fuels2 and ten metals and minerals3, over an assumed lifespan.
The World Bank constructs this measure as follows (World Bank 2006). It estimates for each country the size of the stock of each resource that can be economically extracted and the country-specific rents derived from a unit produced (the unit price minus extraction costs). It assumes that the stock of resources will be exploited within a time span of twenty years in each country. This roughly corresponds to the world average reserve-to-production ratio for most of the resources included in the measure. Furthermore, it assumes that extraction occurs along an optimal path, given a fixed growth rate of resources rents, and a fixed discount rate. The discount rate is set at four per cent, which is the upper bound of estimated social return on investment for industrialized countries.4
Note that the World Bank estimates of subsoil capital for 1995 and 2000 (World Bank 1997, 2006) artificially impose the same discount rate and time horizon for extraction on all countries in the sample. These are exactly the factors that we would like to hold constant because they are a potential source of endogeneity.
To arrive at a measure of natural capital, the World Bank adds the NPV of the flow of income derived from cropland, timber, non-timber forest resources, pastureland and protected areas to the value of subsoil capital for each country. To calculate the NPV of rents from cropland, ten representative crops are identified.5 For each of these crops and each country, the NPV of
cropland is the product of the total area of cropland, country-specific yield per acre, world price and a fixed rental rate (one minus the ratio of costs to revenue per acre, assuming the product is sold at world prices), over an assumed lifespan of 25 years, discounted using a fixed four per cent discount rate. Yields are assumed to increase at a fixed rate, which is different for developing and developed countries.6 A similar method is used to determine the NPV of pastureland. The
representative products in this case are beef, lamb, wool and milk. The NPV of standing timber is calculated using a similar method to subsoil capital, where the area of forest within 50 kilometres of infrastructure equals the stock of timber. The assumed lifespan of extraction is 25 years, or the estimated time to exhaustion of timber resources given current country-specific production and timber growth, whichever is smaller.7
2 Oil, natural gas, hard coal and lignite (soft coal)
The NPV of non-timber forest resources is 0.1 times the size of forested areas (the share of forests assumed accessible) multiplied by an assumed revenue per acre, which is different for developing and developed countries, over a 25 year life span, discounted. Finally, protected areas are a natural resource in the sense that they can bring income from tourism. Its
3 Bauxite, copper, gold, iron, lead, nickel, phosphate, silver, tin and zinc
4 Later estimates of subsoil capital (World Bank 2011) are calculated using an extraction time-span of 25
years, a zero growth rate of resource rents and a country-specific discount rate based on the annual growth rate of per capita consumption.
5 Maize, rice, wheat, bananas, grapes, apples oranges, soybeans coffee and a residual category which includes
roots and pulses.
NPV per acre is set at a rate lower than the country-specific NPV of crop and pastureland (reflecting the opportunity cost of designating some land as a protected area). The life span is 25 years and the discount rate is four per cent (World Bank 2006).
As is clear from the above, when calculating the value of natural capital for 1995 and 2005, the World Bank also imposes the same discount rate on all countries. However, unlike subsoil capital, the way in which natural capital is measured introduces other potential sources of endogeneity. Cropping patterns, patterns in the use of pastureland and yields per acre are likely partially determined by a country’s political and economic conditions. Furthermore, the World Bank assumes different parameters for developed and developing countries when calculating the NPV of non-timber forest resources and the growth rate of rents to cropland and pastureland. Lastly, the life span of standing timber is potentially dependent on the pace of extraction. For these reasons, natural capital is not the preferred measure of natural resources in this chapter. However, in aggregating all natural resources, including agricultural products, into a single measure, it is conceptually most similar to the original measure employed by Collier and Hoeffler (2004) and Collier, Hoeffler and Rohner (2009). When we wish to examine the impact of natural resources as a single category on conflict, natural capital is the best alternative measure available.
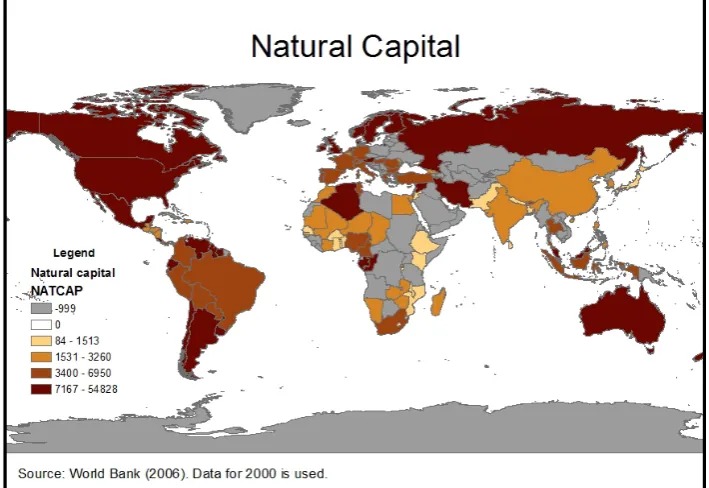
Figure 1 gives a sense of the global distribution of natural resources according to various measures. It displays countries with missing data (-999) in grey, countries without resources in white, and classifies the remaining countries according to quartile.8 Panel A compares natural capital, natural
resource exports as a percentage of GDP and natural resource exports per capita. The latter is constructed by multiplying Collier and Hoeffler’s (2004) original measure by total GDP at current prices and dividing this by the size of the population.9 When focussing on natural resource exports
as a percentage of GDP, countries rich in natural resources are predominantly found in Africa and the Middle-East, and to a lesser extent in Middle-America. However, weighting natural resource exports by population rather than GDP shows an extremely different picture: Africa appears particularly resource-poor according to this metric, and Europe, North America and South America appear particularly rich in resources. Natural capital has considerable overlap with resource exports per capita: Europe, North America and South America also appear resource-rich by this measure, and variation within Africa is similar, to the extent that data on Africa is not missing.10
8 For oil reserves per capita, the quartile ranges are calculated excluding Saudi Arabia and the United Arab
Emirates. These countries have extremely large oil reserves and including them would mean that only these two countries fall in the fourth quartile.
Natural capital has little visual overlap with natural resource exports as a percentage of GDP. This illustrates the argument that natural resource exports as a percentage of GDP reflect resource dependency rather than the presence of resources: both natural capital and the reweighted measure
9 Both additional variables are obtained from the World Bank World Development Indicators
10 Although it would appear that missing data on Africa is a downside of the natural capital measure, many
Figure 1: World distribution of natural resources according to different measures
suggest that it may not be the case that the more developed areas of the world have fewer resources, but rather that they are less dependent on them.
Panel B of Figure 1 compares subsoil capital, Collier and Hoeffler’s oil exports as percentage of GDP11
Natural and subsoil capital measure stocks of natural resources, but not initial stocks, rather stocks in 1995, 2000 and 2005. The main analysis uses data from 2000, because the 1995 measures are only available for a reduced sample of countries, and the 2005 data is calculated using country-specific discount rates. Using natural and subsoil capital implies explaining past conflict (going back to 1960) using stocks of natural capital in 2000 (or predicting past resource exports using stocks of natural resources in 2000 - when using natural and subsoil capital as instruments). For this to be meaningful, natural and subsoil capital should capture a country’s underlying predisposition to possess natural resources, and thus be correlated to natural resource exports and production throughout the time period under research.
, this measure reweighted by population, and Humphreys (2005) indicators for oil production and oil reserves. A somewhat similar, but less pronounced picture emerges. Oil exports over GDP depict Africa as most oil-rich, whereas oil exports per capita indicate that the Middle East has most oil. Subsoil capital visually overlaps more with the latter than the former, although it includes more types of exhaustible resources and hence has fewer countries with zero resources. The global distribution of resources looks broadly similar when taking either oil reserves or oil production per capita taken from Humphreys (2005) as a measure. Subsoil capital visually overlaps with both these measures.
Table 2 displays the correlation between natural and subsoil capital respectively, and alternative measures of natural resource abundance. As expected from observing Figure 1, the correlation between natural resource exports as a percentage of GDP and natural and subsoil capital respectively, is very low. Correlation coefficients do not exceed 0.3 and are insignificant in a number of cases. The correlation between subsoil capital and oil exports as a percentage of GDP is much stronger; coefficients range from 0.46 to 0.55. Correlation coefficients increase in size substantially when weighting natural resource exports by population rather than GDP; coefficients obtained for natural capital and natural resource exports per capita, and subsoil capital and oil exports per capita are of respectable size, ranging from 0.53 to 0.65. Correlations do not appear to become meaningfully stronger over time. In fact the correlation coefficient for 1995 is the lowest in both sets. This mitigates the concern that natural and subsoil capital in 2000 are poor predictors of past natural resource exports.
natural and subsoil capital in 2000 better predict later oil production or reserves: the coefficient on oil reserves for 1999 is the lowest in the series, and the size of the coefficient on oil production for 1999 is roughly similar to that for 1975.
[image:30.595.47.560.281.491.2]Another concern is that the year of measurement of natural and subsoil capital is a source of endogeneity. One could argue that present stocks of natural resources reflect past exploitation rates. Furthermore, natural and subsoil capital are constructed using known stocks, and resource discovery might be endogenous to conflict. World Bank (2011) investigates the changes in natural and subsoil capital from 1995 to 2005. It concludes that variation is mainly due to changes in world prices of resources (which are the same for all countries in a given year). Where stocks have changed, they have increased most strongly in Sub-Saharan Africa and the Middle East and North Africa. These are two regions we would most strongly associate with violent conflict. Extrapolating this backwards, 2000 levels of natural and subsoil capital are thus likely to overestimate past levels of natural resource abundance in conflict-prone regions, biasing the relationship between natural
Table 2: Correlation between measures of resource abundance, over time
Panel A: correlation coefficient between natural capital (2000) and…
YEAR 1960 1965 1970 1975 1980 1985 1990 1995
Resource
exports / GDP 0.1021 0.1047 0.1157 0.1148 0.2279 * 0.1848 * 0.2289 ** 0.2371 ** Resource
exports p.c. 0.6470 *** 0.6418 *** 0.5838 *** 0.5655 *** 0.6232 *** 0.6079 *** *** 0.5383 0.5330 ***
Panel B: correlation coefficient between subsoil capital (2000) and…
YEAR 1960 1965 1970 1975 1980 1985 1990 1995 1999
Resource
exports / GDP 0.1730 * 0.1750 * 0.1682 * 0.1798 * 0.2963 ** ** 0.2252 0.2722 *** *** 0.2637 - Resource
exports p.c. 0.4677 *** 0.5027 *** 0.4554 *** 0.5596 *** 0.6419 *** *** 0.5934 0.5158 *** *** 0.4673 - Resource
exports/ GDP * oil dummy
0.5514 0.5519 0.5425 0.5629 0.5184 0.4602 0.4699 0.4643 -
*** *** *** *** *** *** *** ***
Resource exports p.c. * oil dummy
0.5713 0.6030 0.6085 0.6048 0.6008 0.5874 0.5512 0.5350 -
*** *** *** *** *** *** *** ***
Oil production 0.3506 0.4720 0.5762 0.6193 0.7888 0.9399 0.9317 0.8735 0.6762
*** *** *** *** *** *** *** *** ***
Oil reserves - 0.3703 0.3802 0.3857 0.3836 0.8244 0.6137 0.5716 0.2928
*** *** *** *** *** *** *** ***
resource and conflict upward. This would make it more, not less challenging to prove that earlier obtained results are due to endogeneity.
Empirical strategy
This section will investigate to what extent results obtained by Collier and Hoeffler (2004) and Collier, Hoeffler and Rohner (2009) are driven by endogeneity, by replacing the proxy for natural resource abundance, with subsoil capital and natural capital. Furthermore, it will use natural and subsoil capital as instruments for natural resources exports as a percentage of GDP, natural resource exports per capita and oil production.
It is important to keep in mind which question(s) these analyses address. We may want to know whether countries that are rich or abundant in natural resources are more likely to experience civil conflict. Collier and Hoeffler (2004) and Collier, Hoeffler and Rohner (2009) appear to want to address this question, when they state that natural resources exports as a percentage of GDP is a proxy for natural resource abundance (see (Collier and Hoeffler 2004; Collier, Hoeffler, and Rohner 2009), Appendix A and Appendix B). Conceptually, this question calls for a cross-country set-up and a measure of the amount of natural resources present. Stocks appear to be an adequate measure of this. Replacing the original proxy for natural resource abundance with natural and subsoil capital, and converting this to a cross-country set-up aims to provide an answer this question.
Alternatively, we may be interested in whether resource production, exports, or resource-dependence increases the likelihood of civil war. This question calls for a time-series or panel data analysis, and is subject to problems of endogeneity described above. Instrumenting for natural resource production, exports and dependence with natural and subsoil capital is one strategy to mitigate these endogeneity problems and arrive at a credible causal answer to this question.
institutions (Rodrik, Subramanian, and Trebbi 2004)), percentage of land area in the tropics (potentially correlated to malaria risk and long-term economic development (McArthur and Sachs 2001)) and distance to the nearest coast or navigable river (potentially correlated to economic development). Hence, these instruments are plausibly correlated to violent conflict via a mechanism other than natural resource abundance.
Results
Table 3 presents the model employed by Collier and Hoeffler (2004). Column (1) replicates the logit regression presented in Collier and Hoeffler (2004) Table 5 column 3. A detailed description of the control variables and data sources is provided by Collier and Hoeffler (2004) and reproduced in Appendix A of this thesis. The only difference between the original analysis and the one presented here is that I use robust standard errors, taking into account possible heteroscedasticity and/or autocorrelation within panel data. As we can see from column (1), natural resource exports as percentage of GDP and its square are significant at 1 per cent in the original analysis, suggesting an inverse U-shaped relationship between natural resources and war.
In column (2), the original measures of natural resource abundance are replaced with natural capital and its squared term. The relationship observed earlier loses its significance, and the coefficient now carries a negative sign. Entering subsoil capital as a measure of natural resource abundance similarly shows no significant relationship between resource and war onset (column (3)). Using the natural logarithm of either two variables equally gives similar results (not shown).
Although replacing the original variable only results in a marginal loss of observations, one might be concerned that this loss of significance is an artefact of a different sample composition. Therefore, I run the original regression on the same sample as used in columns (2) and (3). As shown in column (4), this does not cause the coefficient on natural resource exports as a percentage of GDP to lose significance. In fact, the size of its coefficient increases somewhat. Sample composition does not seem to drive the loss of significance. Experimenting with dropping various control variables or step-wise deletion of insignificant controls equally does not cause either subsoil or natural capital to become significant at any conventional level.
Table 3: Replacing natural resource abundance in Collier and Hoeffler (2004)
(1) (2) (3) (4)
CIVIL WAR ONSET Natural resource exports /
GDP 37.0716*** (10.565) 42.6033*** (11.093)
Natural resource exports
/GDP² -69.2696*** (22.323) -78.0838*** (23.576)
Natural capital -0.3480
(1.057)
Natural capital² -0.0334
(0.288)
Subsoil capital 0.4971
(1.327)
Subsoil capital² -0.3262
(0.534)
Post cold war dummy -0.8730 -0.9217 -0.8860 -1.2948
(0.822) (0.759) (0.749) (0.951)
Male secondary schooling -0.2878** -0.0862 -0.1324 -0.2286
(0.136) (0.166) (0.164) (0.168)
GDP growth (t-1) -0.0455 -0.0390 -0.0396 -0.0192
(0.053) (0.064) (0.062) (0.064)
Peace duration -0.3446 -2.3094* -2.1904 -0.3577
(1.328) (1.326) (1.357) (1.516)
Mountainous terrain 0.5436 0.4086 0.3272 1.1019
(1.044) (1.035) (1.047) (1.183)
Geographic dispersion -4.0317*** -2.7158* -2.8384** -4.9182***
(1.450) (1.423) (1.375) (1.544)
ln Population 0.9272*** 0.4013*** 0.3993*** 1.1295***
(0.256) (0.144) (0.150) (0.254)
Social fractionalization -0.8450** -0.1008 -0.1242 -0.8121**
(0.341) (0.355) (0.346) (0.377)
Ethnic fractionalization 0.0412** 0.0170 0.0172 0.0397*
(0.019) (0.017) (0.017) (0.022)
Religious 0.1479 -0.1886 -0.1541 0.0515
fractionalization (0.185) (0.208) (0.200) (0.214)
Polarization -25.2763 -0.6202 -1.9408 -27.5817
(15.855) (13.487) (13.928) (17.779)
Ethnic dominance 2.0202* 0.2982 0.4458 2.3759*
(1.125) (0.914) (0.942) (1.281)
Democracy -1.7692 -2.5802 -1.4184 0.0723
(6.041) (7.318) (7.478) (6.478)
Income inequality 0.0252 0.0397 0.0362 0.0397
(0.029) (0.027) (0.027) (0.034)
Observations 479 450 450 450
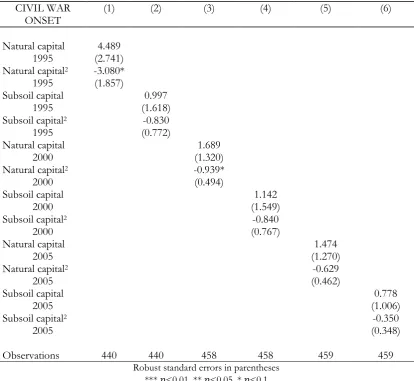
One may be concerned that these results are sensitive to the year of measurement of natural and subsoil capital, even though these measures have been shown to correlate systematically to past resource exports in an earlier section. Therefore, Table 4 shows the results of replicating the regressions in columns (2) and (3) of Table 3 using data on natural and subsoil capital for different years, published by the World Bank in 2011. As highlighted earlier, these measurements are slightly suspect, since they use a country-specific discount rate. Coefficients on the control variables are omitted for brevity. For none of the alternative years of measurement, does natural or subsoil capital enter the regression significantly. No significant relationship between natural resource abundance and conflict is found for any of the years of measurement. The coefficient on natural capital squared is significant at the ten per cent level in two instances (columns (1) and (3)), but this result is difficult to interpret given the lack of significance of the main variable. Table 4, thus provides no evidence that results are sensitive to the year of measurement.
[image:34.595.113.528.79.460.2]With Table 5, I turn to the question whether natural resource dependence, natural resource exports, and oil production are related to violent civil conflict. In this case, I use subsoil capital, natural
Table 4: Using different years of measurement
CIVIL WAR (1) (2) (3) (4) (5) (6)
ONSET
Natural capital 4.489 1995 (2.741) Natural capital2 -3.080*
1995 (1.857)
Subsoil capital 0.997
1995 (1.618)
Subsoil capital2 -0.830
1995 (0.772)
Natural capital 1.689
2000 (1.320)
Natural capital2 -0.939*
2000 (0.494)
Subsoil capital 1.142
2000 (1.549)
Subsoil capital2 -0.840
2000 (0.767)
Natural capital 1.474
2005 (1.270)
Natural capital2 -0.629
2005 (0.462)
Subsoil capital 0.778
2005 (1.006)
Subsoil capital2 -0.350
2005 (0.348)
Observations 440 440 458 458 459 459
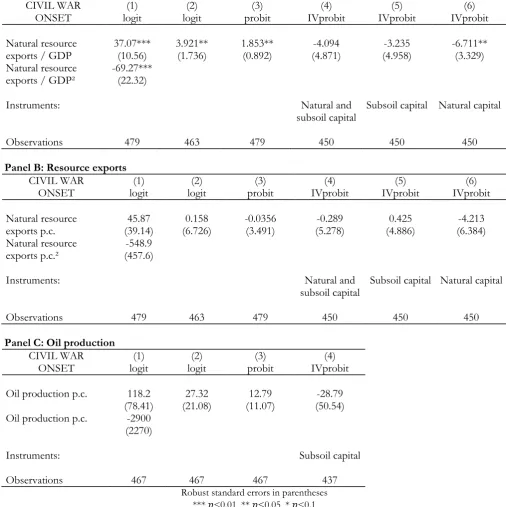
IV probit, since IV logit does not exist. In the IV models, I drop the quadratic term, both because its use has been sharply criticized (see for example (Fearon 2005)) and because keeping the quadratic endogenous variable and instrument introduces multicollinearity, which causes the IV probit model to fail to achieve convergence. For comparison, logit and probit models omitting the quadratic terms are also given. In all models, the same control variables as in Table 3 are included, but coefficients are omitted from the table.
Panel A of Table 5 again reproduces the original model from Collier and Hoeffler (2004) (column (1)), and shows that the relationship between natural resource dependence and civil war is robust to omitting the quadratic term and to shifting the method of estimation to probit (columns (2) and (3)). It is not, however, robust to instrumenting for natural resource exports over GDP using any combination of instruments. All coefficients in the IV models carry a negative sign, and the coefficient in column (6), using only natural capital as instrument, is even significant at the ten per cent level. Again, the relationship between natural resources and conflict, more specifically the relationship between natural resource dependence and civil war onset, turns insignificant when addressing potential endogeneity.
In Panel B, natural resource exports weighted by population rather than GDP is used as the independent variable of interest. Resulting coefficients in column (1) of panel B still carry similar signs to those in panel A, but they are no longer significant. Instrumenting for natural resource exports per capita again results in coefficients that are insignificant, of smaller size, and in two cases negative. However, as columns (2) and (3) show, this may also be due to dropping the quadratic term, or change in estimation method respectively.
Finally, panel C uses Humphreys (2000) measure of oil production. This is positively, yet not significantly related to civil war onset in columns (1), (2) and (3). However, when instrumenting for oil production using subsoil capital, the coefficient on oil production is negative, though again insignificant.
In sum, results on natural resource dependence are similar to the ones obtained earlier this section. I generally fail to find a significant positive relationship between civil war onset, and natural resource exports and oil production respectively, using data from Collier and Hoeffler (2004). Results obtained provide some suggestive evidence that addressing endogeneity problems can change the size and sign of the coefficients, and thus the relationship observed, for these variables.
income inequality was dropped, allowing more countries in the sample. Including it would lead to a radical loss of observations, while not changing the coefficients of interest meaningfully.
[image:36.595.65.572.114.622.2]An advantage of the cross-section analysis is that I can construct multiple dependent variables. This allows me to investigate the effect of natural resource abundance on various indicators for civil war. One possible dependent variable is a dummy indicating whether a war started in a given country at any time between 1960 and 1999. Alternatively, the number of wars occurring in the same period could be used. I construct both variables twice, once using the list of
Table 5: Instrumental variable models
Panel A: Resource dependence
CIVIL WAR (1) (2) (3) (4) (5) (6)
ONSET logit logit probit IVprobit IVprobit IVprobit
Natural resource 37.07*** 3.921** 1.853** -4.094 -3.235 -6.711**
exports / GDP (10.56) (1.736) (0.892) (4.871) (4.958) (3.329)
Natural resource -69.27*** exports / GDP² (22.32)
Instruments: Natural and
subsoil capital Subsoil capital Natural capital
Observations 479 463 479 450 450 450
Panel B: Resource exports
CIVIL WAR (1) (2) (3) (4) (5) (6)
ONSET logit logit probit IVprobit IVprobit IVprobit
Natural resource 45.87 0.158 -0.0356 -0.289 0.425 -4.213
exports p.c. (39.14) (6.726) (3.491) (5.278) (4.886) (6.384)
Natural resource -548.9 exports p.c.² (457.6)
Instruments: Natural and
subsoil capital Subsoil capital Natural capital
Observations 479 463 479 450 450 450
Panel C: Oil production
CIVIL WAR (1) (2) (3) (4)
ONSET logit logit probit IVprobit
Oil production p.c. 118.2 27.32 12.79 -28.79
(78.41) (21.08) (11.07) (50.54) Oil production p.c. -2900
(2270)
Instruments: Subsoil capital
Observations 467 467 467 437
Table 6: Cross-country models of natural resouce abundance and violent conflict
A vg c as ua ltie s (8 ) 28 ,1 96 .2 5 (-1 14 ,5 93 .9 9) -3 9, 22 7. 09 (-2 13 ,3 97 .6 3) 11 6 0. 16 3 -9 ,0 49 .0 4 -1 1, 99 6. 98 2, 04 8. 20 -2 ,4 79 .0 895 0.192
-9 ,0 67 .9 7 -1 2, 94 7. 07 2, 54 9. 84 -3 ,2 31 .7 8
95 0.191
St an dard e rro rs in p are nt he se s. D epe nd ent v ar iabl es: (a ) w ar o cc urr en ce 1960 -1999 ( Sa rke es 2000) (b ) w ar o ccu rr en ce 1 96 0-199 9 ( Co lli er a nd H oe ff le r 2004) (c ): nu m be r of w ar s 1960 -1999 (S ar ke es 2000) (d ) nu m be r of w ar s 1 96 0-1999 ( Co lli er a nd H oe ff le r 2004) (e ) t ot al n um be r o f d ay s a t w ar 1 96 0-1999 ( f) a ver ag e nu m be r of d ay s pe r wa r ( g) tot al nu m be r o f w ar c as ua lti es 1 96 0-1999 ( h) a ve ra ge nu m be r c asu alt ie s pe r wa r. C on trol s f or m al e se cond ar y sc hool ing , G D P gr owt h, m ou nt ai no us t er ra in, g eog ra phi c d ispe rsi on, ln po pu lat ion , soc ial , e thni c a nd re lig iou s f ra ct iona liz at ion , p ol ar iz at ion, e thni c d om ina nce a nd d em ocr acy ar e i nc lu de d. * ** 𝑝 < 0. 01, * * 𝑝 < 0. 05, * 𝑝 <0 .1 Ca sua ltie s (7 ) 51 ,4 85 .5 3 (-2 32 ,4 63 .3 1) 9, 31 8. 43 (-4 30 ,9 63 .0 1) 10 9 0. 16 4 -1 1, 73 8. 55 -3 0, 11 8. 58 3, 15 7. 34 -6 ,1 66 .2 8
91 0.214
-1 6, 74 6. 48 -3 2, 89 2. 87 4, 95 7. 05 -8 ,1 04 .7 5
91 0.215
A vg d ur at io n (6 ) 1, 12 7. 13 (-3 ,3 88 .2 4) -4 ,5 70 .2 2 (-6 ,3 10 .2 0) 11 5 0. 18 8 -9 03 .3 77 4* * -4 17 .1 09 15 7. 41 69 * -8 6. 31 6
94 0.22
-6 76 .6 15 -4 58 .5 2 14 8. 74 6 -1 14 .6 9
94 0.194
W ar d ur at io n (5 ) 3, 50 6. 67 (-5 ,9 89 .3 3) -8 ,7 42 .2 0 (-1 1, 10 4. 34 ) 10 8 0. 19 8 -1 ,3 21 .4 11 2* -7 74 .3 27 22 7. 40 73 -1 58 .7 42
90 0.232
-9 69 .6 28 -8 58 .1 24 21 1. 62 85 -2 11 .8 64
90 0.215
# Wa rs (4 ) 4. 42 97 ** (-2 .1 03 3) -8 .7 51 6* * (-3 .8 97 8) 11 8 0. 28 2 0. 18 66 -0 .2 63 -0 .0 29 -0 .0 54
97 0.279 0.42
-0 .2 81 -0 .0 87 -0 .0 7
97 0.294
# Wa rs (3 ) 4. 37 89 * (-2 .5 08 9) -8 .7 14 4* (-4 .6 49 6) 11 8 0. 25 8 0. 03 44 -0 .3 1 -0 .0 04 -0 .0 64
97 0.263
0. 27 16 -0 .3 34 -0 .0 56 -0 .0 83
97 0.269
W
ar
d
ummy (2)
9. 50 83 (-7 .5 88 4) -2 3. 75 69 (-1 6. 17 45 ) 11 8 -1 .1 09 -1 .2 47 0. 14 94 -0 .3 32 97 0. 78 85 -1 .9 35 -0 .4 19 -0 .9 95 97 W ar d
ummy (1)
8. 43 55 (-7 .4 26 3) -2 1. 55 1 (-1 5. 68 65 ) 11 8 -0 .6 21 -1 .2 61 0. 05 36 -0 .3 69
97 1.57
wars printed in Collier and Hoeffler’s article and once using an updated version of the Singer and Small dataset they use (Sarkees 2000). The variables differ considerably, both because the set-up of the dataset has been changed (see Sarkees 2000 for details) and because Collier and Hoeffler seem to have made additions to the original dataset (Elbadawi and Sambanis 2002). Using the updated Singer and Small dataset, I can also obtain the number of days a country was at war between 1960-1999, the average number of days per war, the total number of casualties and the average number of casualties per war. As most of these dependent variables are no longer dichotomous I use linear regression instead of logit regression, except in the case of both dummy variables corresponding to war starts.
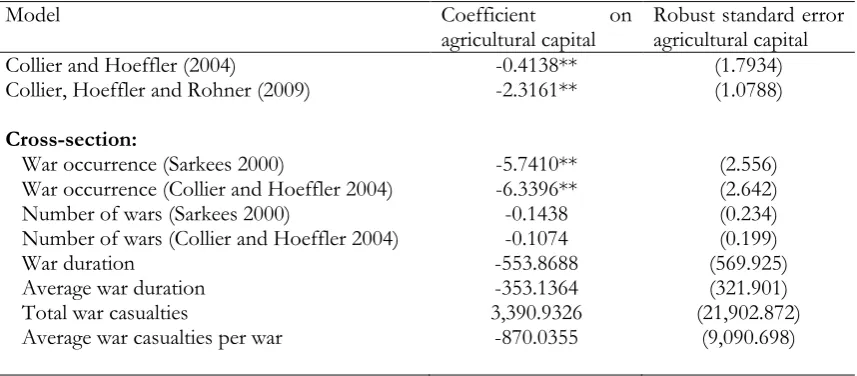
Table 6 summarizes the results from running a similar specification as in Table 3 on the thus created cross-sectional data. Subsoil capital is not significantly related to any of the eight dependent variables (panel C). Natural capital is equally unrelated to all aspects of civil war, except the total and average number of days at war. It is significant and negatively related to the latter two variables (panel B). This suggests that natural resource abundance actually shortens civil war duration, a result that has been obtained before by Humphreys (2005). He argues that natural resource abundance can facilitate military victory if the benefits accrue to the strongest party to a conflict. However, the same pattern cannot be found using subsoil capital, so this resul