Accepted Manuscript
Study of the yielding of sand under generalized stress conditions using a versatile hollow cylinder torsional apparatus
Brendan C. O’Kelly, Patrick J. Naughton PII: S0167-6636(08)00155-5
DOI: 10.1016/j.mechmat.2008.11.002
Reference: MECMAT 1644
To appear in: Mechanics of Materials Received Date: 15 June 2007
Revised Date: 8 October 2008 Accepted Date: 11 November 2008
Please cite this article as: O’Kelly, B.C., Naughton, P.J., Study of the yielding of sand under generalized stress conditions using a versatile hollow cylinder torsional apparatus, Mechanics of Materials (2008), doi: 10.1016/ j.mechmat.2008.11.002
ACCEPTED MANUSCRIPT
Study of the yielding of sand under generalized stress conditions using a
versatile hollow cylinder torsional apparatus
Brendan C. O’Kelly(corresponding author)
Lecturer,
Department of Civil, Structural and Environmental Engineering,
Museum Building, Trinity College Dublin, Dublin 2, Ireland.
Tel. +353 18962387 Fax. +353 16773072 E-mail: bokelly@tcd.ie
Patrick J. Naughton
Lecturer in Civil Engineering,
School of Engineering,
Institute of Technology, Sligo,
Ballinode, Sligo, Ireland.
Tel. +353 719155489 Fax. + 353 719155390 E-mail: naughton.patrick@itsligo.ie
First submission: 15th June 2007
ACCEPTED MANUSCRIPT
Abstract
The hollow cylinder torsional apparatus (HCTA) is particularly suited to studying the
mechanical behavior of cross-anisotropic test specimens since the magnitudes of the three
principal stresses and the orientation of the major-minor principal stress axes can be
independently controlled. Novel features of the University College Dublin HCTA,
particularly the instrumentation and calibration procedures necessary to achieve accurate
generalized stress path testing, are presented. The plastic yield behavior of fully saturated
Leighton Buzzard sand was studied under generalized stress conditions. Physically
identical test-specimens (35.5 mm inner radius, 50.0 mm outer radius and 200 mm in
length) were prepared using a water-pluviation technique that reproduces the inherent
cross-anisotropic fabric of many natural sand deposits. A series of stress path tests
systematically probed the stress space to locate segments of yield loci. The deviator stress
at yield was found to vary in a well-defined pattern that depended on the magnitude of the
intermediate principal stress parameter. However, the deviator stress at yield was largely
independent of reorientations of the major principal stress that had occurred during the
initial anisotropic consolidation stage of the tests. The experimental yield data was used to
show that the Matsuoka-Nakai and Lade yield criteria provide satisfactory predictions of
the onset of plastic yielding in sand deposits under generalized stress conditions for routine
geotechnical engineering design.
ACCEPTED MANUSCRIPT
Nomenclature
b intermediate principal stress parameter
H specimen length
HCTA hollow cylinder torsional apparatus
J1, J2and J3 first, second and third effective stress invariants
p mean confining stress
p’ mean effective confining stress
piand pe inner and outer confining pressures, respectively
riand re inner and outer specimen radii, respectively
R major-to-minor principal stress ratio
R’ major-to-minor effective principal stress ratio
T torque
q deviator stress
u pore water pressure
v axial displacement
wiand we radial displacements of inner and outer specimen wall surfaces,
respectively
W axial load
inclination of the major principal stress to the vertical direction
z, r, axial, radial and circumferential normal strains
ACCEPTED MANUSCRIPT
total normal stress
’ effective normal stress
z, r, axial, radial and circumferential total normal stresses
1, 2, major, intermediate and minor total principal stresses
1’, 2’, ’ major, intermediate and minor effective principal stresses
ACCEPTED MANUSCRIPT
1. Introduction
Geomaterials behave pseudo-elastically up to about 10-3strain. In elastic-plastic modeling, the transition with increasing stress from pseudo-elastic to elastoplastic behavior occurs at
the yield point. Hence, the estimation of the yield stress is important in engineering design
since it defines the onset of larger plastic deformations with further increases in applied
stress. In most ground engineering problems, the principal stresses rotate as the foundation
load is applied. For example, Fig. 1 shows the stress conditions at five points (labeled A to
E) along a potential rupture surface in the ground. Since most sedimentary deposits are
inherently anisotropic, the stiffness and strength responses of the ground foundation will
vary from point to point along the rupture surface and are functions of the stress history and
both the magnitudes and the directions of the principal stresses. At point D, the major
principal stress (1) has rotated through an angle () to the vertical direction.
Fig. 1. Stress states along rupture surface.
The hollow cylinder torsional apparatus (HCTA) is uniquely capable of independently
controlling the magnitudes of the three principal stresses and the orientation of the
major-minor principal stress axes. Hight et al. (1983) and Saada and Townsend (1981)
ACCEPTED MANUSCRIPT
This paper describes the use of a state-of-the-art HCTA developed at University College
Dublin (UCD) to study the plastic yield behavior of a Leighton Buzzard sand under
generalized stress conditions. The development of the apparatus has been reported in detail
by O’Kelly and Naughton (2003, 2005a, 2008a). Additional information is presented in this
paper on its novel features, in particular the instrumentation, automation and calibration
procedures necessary to achieve accurate generalized stress path testing. A series of stress
paths were targeted to locate segments of yield loci for the Leighton Buzzard sand in
generalized stress space.
The experimental yield data was then compared with the values predicted by two existing
yield criteria, namely Matsuoka-Nakai and Lade, in order to assess their accuracy in
predicting the onset of plastic yielding in the sand specimens. The two yield criteria are
particularly suited to soil mechanics and have been shown by Pradel et al. (1990),
Matsuoka et al. (1990) and Lade and Duncan (1976) to provide reasonable predictions for a
range of foundation loading conditions. For example, Matsuoka and Nakai (1985) have
shown that the Matsuokai-Nakai yield criterion had the effect of averaging the Mohr
Coloumb criterion which is widely used in soil mechanics. In contrast, isotropic-kinematic
hardening formulations distinguish between primary and secondary yield whereas the
bounding surface is allowed to shrink and dilate during cyclic loading in models using
bounding surface theory (Pradel et al, 1990). Hence, a direct comparison of the
ACCEPTED MANUSCRIPT
difficult to establish and in any event would have had to be examined on a case by case
basis.
The Matsuoka-Nakai yield criterion (Matsuoka and Nakai, 1985), which is a theoretical
development of the concepts of compoundedly mobilized and spatially mobilized planes,
can be expressed in terms of the effective stress invariants, Eq. (1). The Lade yield criterion
(Lade and Duncan, 1975), which was developed from analysis of cubical-triaxial test data
assuming isotropic behavior, can be best expressed in terms of the first and third effective
stress invariants, Eq. (2).
3 2 1
J J J
= Matsuoka-Nakai constant (1)
3 3 1
J J
= Lade constant (2)
3 2 1
1
J (3a)
1 3 3 2 2 1
2
J (3b)
3 2 1 3
J (3c)
where J1, J2and J3are the first, second and third effective stress invariants,
ACCEPTED MANUSCRIPT
Previous studies, most notably by Pradel et al. (1990), have used HCTA devices to study
the effects of a reorientation of the major principal stress on the yield behavior of sand, but
only for limited regions of stress space, and with the experimental data reflecting the
combined effects of changes in both and the intermediate principal stress parameter (b):
3 1
3 2
b = Sin2 (4)
The b parameter is a sizing ratio that relates the magnitude of the intermediate principal
stress to the magnitudes of the major and minor principal stresses (0b 1). In this paper,
the UCD HCTA was used to study the effects of different orientations of the major
principal stress and different magnitudes of the b parameter on the yield behavior of the
sand separately.
2. Principle of hollow cylinder torsional testing
An axial compressive load (W) and a torque (T) are applied across the length of the
thick-walled, hollow-cylindrical test specimen while independently-controlled confining
pressures (piand pe) are applied over the inner and outer specimen wall surfaces, Fig. 2(a).
The normal stresses acting on an element of the ground foundation are invariably
compressive and are simulated in the HCTA by applying the compressive load and
ACCEPTED MANUSCRIPT
test specimen (overall length H and inner and outer radii, riand re, respectively) may
deform axially, radially and twist under the applied surface tractions. A polar coordinate
system is appropriate with the z-axis coincident with the specimen axis.
(a) Surface tractions.
(b) Stress components.
[image:10.595.79.495.206.413.2](c) Principal stresses.
Fig. 2. Stress state in hollow cylindrical specimen.
Figures 2(b, c) show the non-zero stress components (z, r, , z) and the resolved
principal stresses (1, 2, 3) that are induced in an element of the specimen wall. The
complementary shear stress (z) that acts on the vertical plane automatically develops in
response to the shear stress zinduced by the applied torque. The Lamé equations for
calculating the mean values of the non-zero stress components (Table 1) induced across the
specimen wall thickness were derived from equilibrium considerations assuming an
isotropic, linear-elastic response (Naughton and O’Kelly, 2007). The stress components
were integrated over the full specimen volume in order to account for the effects of the
specimen wall curvature. From numerical analysis of the test specimen, Wijewickreme
ACCEPTED MANUSCRIPT
Table 1. Equations for stress and strain components.
Axis direction Mean stress Mean strain
Axial normal 2 i 2 e 2 i i 2 e e 2 i 2 e z r r r p r p ) r r ( W H v z
Radial normal
2
2 i 2 e i e i e 2 e 2 i 2 i 2 e 2 i i 2 e e r r r r r ln p p r r 2 r r r p r p i e i e r r r w w Circumferential normal
2
2 i 2 e i e i e 2 e 2 i 2 i 2 e 2 i i 2 e e r r r r ln p p r r 2 r r r p r p i e i e r r w w Circumferentialshear 3 (r r )(r r )
) r r ( T 4 2 i 2 e 4 i 4 e 3 i 3 e z ) r r ( H 3 ) r r ( 2 2 i 2 e 3 i 3 e z
The stress components (z, , z) are resolved to determine the magnitudes of the major
and minor principal stresses and the orientation () of the major principal stress to the
vertical direction. The intermediate principal stress equals the radial normal stress (r).
Hence, the magnitudes of the three principal stresses and the orientation of the major
principal stress can be independently controlled by varying the applied surface tractions.
The non-zero strain components (z, r, , z) are computed from the measured axial (v)
and twist () deformations and the radial displacements of the inner and outer specimen
ACCEPTED MANUSCRIPT
resolved to determine the magnitudes of the three principal strains and the orientation of the
major principal strain to the vertical direction. The HCTA is particularly suited to studying
the constitutive behavior of cross-anisotropic test specimens since the major-minor
principal stress axes can be rotated relative to the cross-anisotropic plane.
Geomaterials generally comprise three phases, namely: the solid particles; a liquid phase,
usually water, and a gaseous phase, usually air (partially saturated conditions). However,
the stiffness and strength responses of the test specimen are customarily measured in the
fully saturated condition in the geotechnical laboratory, in which case the mechanical
response is governed by the effective normal stress () that acts across the contacts
between the constituent solid particles. Hence, the stress state must be expressed in terms of
the effective stress condition in geotechnical analysis:
u
(Terzaghi, 1943) (5)
where is the applied or total normal stress;
and u is the pressure in the pore water that fills the saturated voids.
ACCEPTED MANUSCRIPT
3.1. Overview of apparatus
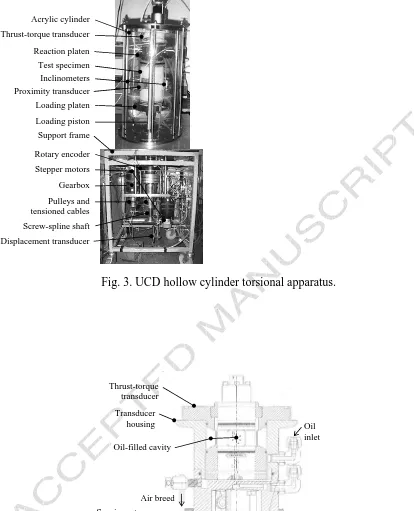
The development of the UCD HCTA (Fig. 3) has been reported in detail by O’Kelly and
Naughton (2003, 2005a, 2008a). Additional information on its novel features, particularly
the instrumentation, automation and calibration procedures necessary to achieve accurate
generalized stress path testing, is presented in this paper.
Fig. 3. UCD hollow cylinder torsional apparatus.
The ends of the test specimen are in contact with annular platens inside an acrylic pressure
cell. Hydrostatic confining pressures are applied to the inner and outer specimen wall
surfaces using two screw-driven, pressure actuators (each 2.0 MPa and 200 ml in capacity).
The inner and outer specimen wall surfaces are enclosed by rubber membranes, typically
0.38-mm in thickness. The outer cell chamber and the specimen inner bore cavity are
independently sealed and both chambers are completely filled with water. The rated
capacity of the acrylic cylinder limits the confining pressure that can be applied to the outer
cell chamber to a maximum of 1.0 MPa. The back pressure applied to the pore water in the
specimen and the volume change of the specimen itself (drained test) are controlled by a
third pressure actuator.
An axial load and a torque are applied to the bottom end of the specimen via a loading
ACCEPTED MANUSCRIPT
restrained under torsional loading conditions by ribbed, sintered bronze discs that are
secured to both the loading and reaction platens. Rotation of the lightly-preloaded screw
and spline ball bearings, which were secured to the reaction frame located beneath the
pressure cell, can produce smooth vertical, rotary and spiral motions of the loading piston,
and hence the loading platen. The top end of the specimen is restrained by a load reaction
cage which is located inside the acrylic cylinder in the UCD set up. Under quasi-static
loading conditions, the loading mechanisms can apply an axial tension or compression
force of up to 19.3 kN and a torque of up to ±103 N.m.
Practical considerations, including the necessary control sensitivity for the applied surface
tractions, the strain measurement accuracy and the convenient deployment of
instrumentation, particularly in the specimen inner bore cavity, were considered in arriving
at the UCD test specimen dimensions of 35.5-mm inner radius, 50.0-mm outer radius and
200-mm in length. Numerical analysis by Naughton and O’Kelly (2007) indicated that the
stress non-uniformity that may develop across the thickness of the UCD specimen due to its
wall curvature increased in proportion to the major-to-minor principal stress ratio (R),
although the level of stress non-uniformity was generally acceptable throughout the stress
space for R 1.5. The specimen wall thickness of 14.5 mm was also sufficiently large in
relation to the grain size of the sand so that a uniform densification of the specimen could
be achieved during specimen preparation and potential failure mechanisms were free to
ACCEPTED MANUSCRIPT
Based on the capacities of the loading mechanisms and pressure actuators, an axial total
normal stress of up to ±5.0 MPa; a radial total normal stress of up to 2.0 MPa and a
circumferential shear stress of up to ±0.6 MPa can be induced in the UCD specimen, which
is more than adequate to study the stress-strain-strength behavior of geomaterials.
Specimens having smaller cross-section areas can be tested by fitting different annular
platens in the pressure cell when higher operating stress levels are required.
Stepper-motors drive the mechanisms that actuate the loading piston and pressure actuators
to apply small axial and twist boundary displacements and confining pressures to the outer
cell chamber and the specimen inner bore cavity. Submersible, high-resolution
instrumentation measures the axial load and torque that develop across the specimen length,
the applied confining pressures and the axial, radial and twist deformations of the
specimen. When the apparatus is operating in precision mode, one step motion by the drive
motors displaces or rotates the loading piston by 1x10⁻⁴mm or 0.8 arc-seconds, corresponding to a control resolution of about 7x10⁻⁵strain. Errors due to apparatus
compliance and specimen end-restraint and bedding effects (Baldi et al., 1988) are excluded
by measuring the specimen deformations over a central gauge length using instruments
attached or in close proximity to the specimen wall surfaces. The apparatus is located in a
temperature-controlled environment at 202oC.
ACCEPTED MANUSCRIPT
3.2.1. Applied load, torque and confining pressures
A combined thrust-torque transducer (4.0 kN and 50 N.m in capacity) measures the axial
and torsional loads that develop across the specimen length. The transducer is located
inside the pressure-cell, next to the restrained end of the specimen, so that measurement
errors due to frictional resistance (for example, along the loading piston) do not arise. The
thrust-torque transducer was electrically insulated inside a saturated, oil-filled housing that
formed part of the reaction platen assembly, Fig. 4.
Fig. 4. Pressure compensation system for thrust-torque transducer.
The transducer readings are unaffected by changes in the confining pressures applied
during a test since the confining pressure to the outer cell chamber also acts on the oil
contained inside the transducer housing, via a water-oil interface. The transducer was
calibrated in-place by applying axial load and torque increments using a system of levers,
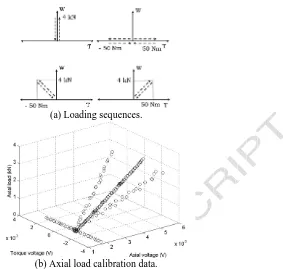
pulleys and dead weights. The calibration procedure involved the application of an axial
load alone, torque alone and combined axial and torsional loading, Fig. 5(a). Typical
calibration data for the case of axial loading alone are shown in Fig. 5(b). The coupling
between the axial load and torque signals was analyzed using multiple-linear regression
ACCEPTED MANUSCRIPT
Fig. 5. Calibration of thrust-torque transducer.
The two pressure actuators independently control the applied confining pressures to within
0.25 kPa and can target a specified pressure at up to 15 kPa/s. The pressure actuators also
measure the volume change of the outer cell chamber and the specimen inner bore cavity. A
400-kPa differential pressure transducer measures the difference in the confining pressures
acting across the specimen wall-thickness.
3.2.2. Specimen deformations
The polar deformation response of the test specimen is measured locally using inclinometer
gauges and proximity transducers (Figs. 6 and 7) so that the deformation measurements are
free from errors associated with apparatus compliance and specimen end-restraint and
bedding effects (Baldi et al., 1988). The apparatus is supported entirely on pneumatic
mounts which prevent any external vibrations from interfering with the instrument
measurements (particularly important at small strain levels).
Fig. 6. Inclinometer gauges: double-axes (left); single-axis (right).
ACCEPTED MANUSCRIPT
The axial and twist specimen deformations are measured over a central 45-mm gauge
length using three inclinometer gauges (O’Kelly and Naughton, 2008a,b) that are glued to
the outer specimen membrane. Two axial and three twist deformation measurements of up
to 20 mm and ±30oare measured over the outer specimen wall surface using one single-axis and two double-axes inclinometer gauges, Fig. 6. The radial displacements of the inner
and outer wall surfaces are measured near the specimen mid-height using two proximity
transducers (O’Kelly and Naughton, 2008c); one transducer is located in the outer cell
chamber and the second is located directly opposite in the specimen inner bore cavity.
A micro-seal waterproofing treatment was applied to the face of the proximity transducers.
Prior to the assembly of the pressure cell, aluminum foil targets are attached by a smear of
silicone grease to the rubber membranes that enclose the specimen wall surfaces,
preventing any specimen reinforcement effect. Tatsuoka et al. (1983) reported that the
displacement of the rubber membranes, and hence the foil targets, matched that of the
specimen wall surfaces. Each foil target is made large enough to accommodate the
anticipated relative movements between the proximity transducers and the specimen wall
surfaces during the course of a test.
The inclinometer gauges and proximity transducers were calibrated using an optical table
ACCEPTED MANUSCRIPT
The proximity transducers were calibrated while fully submerged under water since the
transducer response is sensitive to its operating environment. The gap between the
transducer face and the targets (two plastic discs covered with aluminum foil that had the
same curvatures as the inner and outer specimen wall surfaces) were measured using a laser
distance-measurement system that had resolution and accuracy values of the order of 10-12 and 10-11m, respectively. The data curves for calibration in air and fully submerged in water were found to differ by between 0.07 and 0.09 mm over the measurement range of
0.5 to 5.0 mm. The local instrumentation had a measurement range of between 10-5and 10-1 strain (i.e. pseudo-elastic to failure strain levels for geomaterials), covering the full strain
range of engineering interest. Existing HCTA devices have had to incorporate dynamic
measurement techniques, including shear wave velocity and resonant column tests
(Connolly and Kuwano, 1999; Drnevich, 1985), in order to extend the strain measurement
capability into the pseudo-elastic range. The output signals from the different instruments
were recorded at 5 min intervals over the 24 hour period proceeding each stress path test
and the electrical stability of the outputs was found to be satisfactory (standard deviation
from the mean output voltage was generally significantly less than 0.5%). Longer-term
checks were periodically carried out and again the stability of the outputs was found to be
satisfactory.
ACCEPTED MANUSCRIPT
Figure 8 shows a schematic of the data acquisition and control systems for the UCD
HCTA. The drive units and the pressure actuators interface with a personal computer via
Compumotorinterconnect cards and a general-purpose interface bus. The apparatus was
closed-loop controlled to target a user-defined stress path using a suite of LabVIEW
[image:20.595.81.499.201.440.2]programs, Fig. 9.
Fig. 8. Schematic of data acquisition and control systems.
Fig. 9. Flow chart for control algorithms.
Firstly, the prescribed stress path is read from a data file. The load, pressure and
deformation instruments are simultaneously scanned to determine their initial reference
outputs. The target values of the surface tractions are computed from the mean effective
stress components that correspond to a series of transition stress points located along the
stress path. The loading mechanisms and pressure actuators apply small axial and twist
displacements and confining pressures to the specimen surfaces by independently
controlling the direction and step rate of the motor drives. The axial load and torque that are
induced across the specimen length are controlled by the thrust-torque transducer in a
ACCEPTED MANUSCRIPT
and the specimen deformations. The actual state of effective stress and the strain response
are computed in real time using the equations in Table 1. The two axial and three twist
deformations measured by the inclinometer gauges are used to compute the specimen axial
normal and circumferential shear strain values, respectively. The radial displacements of
the specimen wall surfaces recorded by the proximity transducers are used to calculate the
radial and circumferential normal strain values. The stress path is followed by sequentially
stepping between transition target stress-points located along the prescribed stress path.
The stiffness and strength of sand and gravel deposits (frictional materials) are directly
related to the major-to-minor effective principal stress ratio, R’. Hence, it is preferable to
express the stress path in terms of an alternative but equivalent set of control parameters,
namely: the mean effective confining stress (p’); b parameter; R’ and (Table 2).
Table 2. Control parameters used in the algorithms.
Stress parameter Equation Max difference
between
target stress points
Mean effective confining
stress 3
ACCEPTED MANUSCRIPT
Intermediate principal stress
parameter 1 3
3 2 ' ' ' ' b 0.1 Major-to-minor effective
principal stress ratio 3
1 ' ' ' R 0.1 Major-to-minor principal stress difference
t = '1–'3 5.0 kPa
Angle of major principal
stress to vertical direction
' ' 2 Tan 2 1 z z 1 5.0 degree
The key change points along the stress path, as well as the transition target stress points, are
expressed in terms of the set of control parameters. The control algorithm loops and the
loading mechanisms and pressure actuators are simultaneously adjusted to bring all of the
effective stress components within specified tolerances for the target values (default set at
0.25 kPa). The algorithm considers the impact that a change in the value of one control
parameter would have on the other parameters in determining step size taken by the drive
motors. The specimen deformations are allowed to equilibrate at each target point along the
stress path. Equilibrium is deemed to have been achieved when the rate of change in the
strain components are all within the limits specified in Table 3. The equilibrium check is
bypassed if the specimen has not achieved equilibrium within a specified number of loops
ACCEPTED MANUSCRIPT
prescribed stress path as closely as possible. The control algorithm includes calibration
equations for the different instruments and automatically corrects the specimen stresses for
the restraining effects of the rubber membranes that enclose the outer and inner specimen
[image:23.595.76.493.238.600.2]wall surfaces (Sivathayalan and Vaid, 1998; Tatsuoka et al., 1986).
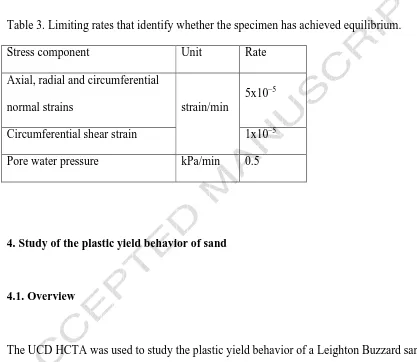
Table 3. Limiting rates that identify whether the specimen has achieved equilibrium.
Stress component Unit Rate
Axial, radial and circumferential
normal strains strain/min
5x10⁻⁵
Circumferential shear strain 1x10⁻⁵
Pore water pressure kPa/min 0.5
4. Study of the plastic yield behavior of sand
4.1. Overview
The UCD HCTA was used to study the plastic yield behavior of a Leighton Buzzard sand
under generalized stress conditions, and in particular the effects of a reorientation of the
major principal stress and changes in the magnitude of the b parameter. The stress paths
systematically probed generalized stress space using the methodology of Tatsuoka and
ACCEPTED MANUSCRIPT
developing yield loci to be identified for the sand. After isotropically consolidating the test
specimens to the same mean effective confining stress, new fabrics were induced in the
specimens by following prescribed anisotropic consolidation stages that targeted different
values, and with the intermediate principal stress parameter b = 0 or 0.5. Yield points
were then identified for prescribed b parameter values in the range 0 ≤ b ≤ 1.0by increasing
the R’ value until plastic straining commenced. This systematic approach allowed the
effects of the reorientation of the major principal stress and the changes in the magnitude of
the b parameter to be independently studied. The accuracy of the Matsuoka-Nakai and Lade
yield criteria (Eqs. (1) and (2)) in predicting the onset of plastic yielding in the sand
specimens was assessed by comparing the predicted and experimental yield values.
4.2. Materials and specimen preparation method
The test material was a white, clean, fine-to-medium Leighton Buzzard sand that comprised
sub-angular grains, about 0.5-mm in size (Table 4). The sand in its loosest state had a
maximum void ratio (defined as the volume of the void space to the volume of the sand
grains) of 0.80. In its densest state, the sand had a minimum void ratio of 0.53. Eight,
physically identical test-specimens were prepared using a water-pluviation technique
(O’Kelly and Naughton, 2005b), which mimicked the sedimentation process, producing
ACCEPTED MANUSCRIPT
were set up on the specimen loading platen. The test specimens were prepared to an initial
target void ratio of 0.73 by slowly depositing the saturated sand into the annular,
water-filled cavity between the cylindrical moulds. The eight test specimens were densified to a
medium dense state (target void ratio of 0.60) by uniformly tapping around the outer mould
using a mallet. The local instrumentation was set up after removing the preparation moulds.
Next, the pressure cell was fitted and secured to the support frame. The outer cell chamber
and the specimen inner bore cavity were simultaneously flooded with water and
pressurizing to 150 kPa, and with a backpressure of 100 kPa applied to the specimen (p’ =
[image:25.595.78.439.304.644.2]50 kPa). Full saturation of the sand was achieved in this manner.
Table 4. Physical properties of Leighton Buzzard sand.
Coefficient of uniformity, CU 1.32
Coefficient of curvature, CZ 0.96
Effective grain size, D10(mm) 0.44
Specific gravity of solids 2.64
Maximum void ratio 0.80
Minimum void ratio 0.53
ACCEPTED MANUSCRIPT
The stress path tests comprised four stages, as follows, with Fig. 10 showing a
characteristic stress path plotted in terms of R’ versus the b parameter:
Stage 1: The inner and outer confining pressures were simultaneously increased from 150
to 200 kPa and the specimen was allowed to drain overnight against the applied
specimen back pressure which was continuously adjusted in order to maintain the
mean effective confining stress p’ = 100 kPa (point A).
Stage 2: Next the specimen was consolidated anisotropically by increasing the effective
principal stress ratio R’ from 1.0 to 1.5 and re-orientating the major principal
stress to an angle of = 0, 30, 60 or 90 degrees from the vertical direction,
which induced a in the specimens. During this stage, the b parameter value was
either maintained constant at b = 0 or increased from b = 0 to 0.5. The values of
p’ and were then held constant along the remaining stages of the stress path.
Stage 3: A yield point (point B) was established by increasing the R’ value until plastic
straining of the specimen commenced, which was characterized by a marked
change in its stiffness response. An initial yield point was established at R’ = 2.1
for the eight specimens tested in this study.
ACCEPTED MANUSCRIPT
With the b parameter value set, the R’ value was increased again to search for a
second yield point (point E). This allowed a yield locus to be established between
points B and E. The procedure was repeated to establish segments of yield loci for
[image:27.595.309.495.213.355.2]different stress states in the specimens.
Fig. 10. Stress probing to identify yield loci.
The test program identified 16 segments of yield loci distributed throughout the stress
space. Care was taken to limit the development of plastic straining during the
reconsolidation stages of the stress paths. Significant plastic straining would have increased
the transition zone between pseudo-elastic and post-yield behavior making it more difficult
to accurately define the yield point value.
4.4. Experimental results and analysis
The eight test-specimens had been prepared to similar initial void ratio values of between
0.59 and 0.61 using a wet-pluviation technique, and hence had similar cross-anisotropic
fabrics initially. Naughton and O’Kelly (2003) have shown experimentally that the
stress-strain response of the Leighton Buzzard sand was not significantly affected by this level of
ACCEPTED MANUSCRIPT
A typical data set, including the actual and target stress paths and the measured strain
responses, is shown in Fig. 11 for the case of p’ = 100 kPa,= 30o, and with the b parameter value being increased in 0.25 steps from b = 0.5 at the end of the anisotropic
consolidation stage 2 to b = 1.0 by the end of the stress path test. The prescribed stress path
is defined by the continuous line segments in Fig. 11(a). The key change points on the
stress path and the corresponding strain values are also labeled alphabetically, namely
points A to K. Figure 11(b) shows the manner in which the four stress components (z’, r’,
’, z) were continuously adjusted by the control program in order to follow the
prescribed stress path to within 2% of the target values. Figures 11(c, d) show the strain
responses recorded during the load-unload and reconsolidation stages of the stress path (i.e.
changes in the R’ and b parameter values, respectively). The stress-strain responses in Fig.
11(c) were approximately linear-elastic along the unload paths and along the initial phase
of the reload paths. Furthermore, the strains during the reconsolidation stages were
negligible. Hence, the soil fabric induced in the specimens by the end of the anisotropic
consolidation stage 2 would have remained largely intact for the remainder of the stress
path.
ACCEPTED MANUSCRIPT
However, the stress-strain responses became increasingly non-linear on nearing a yield
point. Pradel et al. (1990) suggested that the yield points derived from the intersection of
the best-fit lines to the initial pseudo-elastic and post-yield slopes provided the most
appropriate estimate of the yield loci for the Matsuokai-Nakai and Lade yield criteria.
Hence, the yield point was identified by curve-fitting the experimental plots. A segment of
the yield locus was defined by joining the yield point established for higher values of the b
parameter back to the initial yield point. Minor discrepancies arose in the experimental
values determined for a specific yield point identified by curve-fitting analysis of the
different stress-strain responses (coefficient of variation in the R’ value of between 0.2%
and 10.9%). Similar differences were also reported in the experimental study by Pradel et
al. (1990). Hence, the stress state corresponding to a specific yield point in this study was
calculated as the mean value from curve-fitting analysis of a minimum of four experimental
stress-strain curves.
Figure 12 shows the experimental yield data plotted in terms of , the b parameter and the
deviator stress (q), given by:
'
23 ' 2 2 ' 2 ' 1 2 ' 3 '
1
q (6)
ACCEPTED MANUSCRIPT
The experimental data suggests that the magnitude of the deviator stress corresponding to
the yield loci varies continuously, although in a well-defined pattern, namely: the deviator
stress at yield was dependent on the initial value of the b parameter but was largely
independent of the rotation that had occurred during the anisotropic consolidation stage
of the stress path. It is plausible that the densification of the specimens by tapping around
the cylindrical moulds during specimen preparation had significantly reduced the initial
level of cross-anisotropy that had been created by the wet-pluviation technique. Two trends
are observed with respect to the b parameter, namely:
(i) Stress paths that had re-orientated the major principal stress, and with the
intermediate principal stress parameter value initially set at b = 0: the deviator stress
at yield decreased by typically 15% to 20% due to the increase in the b parameter
value from b = 0 to 0.5;
(ii) Stress paths that had re-orientated the major principal stress, and with the b
parameter value initially set at 0.5: the magnitude of the deviator stress at yield
either remained constant or increased marginally due to the increase in the b
parameter value from to b = 0.5 to 1.0.
The experimental yield loci are compared with the predictions given by the
ACCEPTED MANUSCRIPT
the respective yield constants (Eqs. (1) and (2)), and normalized to allow direct
comparisons with the theoretical values predicted by the two yield criteria.
(a) Matsuoka-Nakai criterion.
(b) Lade criterion.
Fig. 13. Experimental and theoretical values of points on yield loci.
The two yield criteria were found to slightly underestimate the onset of yielding for 0b
0.5 and slightly overestimate the onset of yielding for 0.5< b 1.0. However, given the
approximate nature of the curve-fitting analysis that had been used in determining the
experimental yield values, it is concluded that both yield criteria provide satisfactory
predictions of the onset of plastic yielding in sand under generalized stress conditions. The
margin of error in the experimental yield loci from the curve-fitting analysis (coefficient of
variation in the R’ value of between 0.2% and 10.9%) prohibits the identification of the
specific mechanism(s) that give rise to the minor discrepancies with the two yield criteria
studied since several mechanisms may be simultaneously mobilized. The experimental
yield loci may also resemble inflated balloons in principal stress space rather than the
conical shapes with smooth triangular cross-sections given by the theoretical models.
ACCEPTED MANUSCRIPT
intermediate principal stress parameter in the prediction of the onset of plastic yielding in
sand deposits for routine geotechnical engineering design.
5. Summary and conclusions
A versatile hollow cylinder torsional apparatus (HCTA) was used to systematically probe
generalized stress space in order to locate segments of yield loci for a fully saturated
Leighton Buzzard sand. Eight, physically identical test-specimens (35.5-mm inner radius,
50.0-mm outer radius and 200-mm in length) were prepared using a water-pluviation
technique that mimicked the sedimentation process, and hence the inherent
cross-anisotropic fabric of many natural sand deposits. The stresses induced in the test specimens
were continually adjusted to within 2% of the target values on the prescribed stress paths,
which comprised in sequence: an isotropic consolidation stage to the same mean effective
confining stress; an anisotropic consolidation stage that produced different reorientations of
the major principal stress and finally probing of the stress space to locate segments of
developing yield loci. The specimen deformation response was measured to a resolution of
10-5strain over its central gauge length. Novel features of the HCTA, particularly the instrumentation, automation and calibration procedures that were necessary to achieve
ACCEPTED MANUSCRIPT
on the initial value of the intermediate principal stress parameter but was largely
independent of the stress reorientation that occurred during the anisotropic consolidation
stage of the stress path. The Matsuoka-Nakai and Lade yield criteria were both found to
provide satisfactory predictions of the onset of plastic yielding in the sand under
generalized stress conditions for routine geotechnical engineering design.
Acknowledgements
The authors would like to acknowledge the support of Dr. Tom Widdis and Professor
Eugene O’Brien during the course of the research, which was carried out at the Department
of Civil Engineering, University College Dublin (UCD). The paper was written by the lead
author while on sabbatical leave at the Urban Institute Ireland, UCD. The lead author is
also grateful for funding received through the Pierse-Newman Scholarship in Civil
Engineering from UCD.
References
Baldi, G., Hight, D.W., Thomas, G.E., 1988. A reevaluation of conventional triaxial test
ACCEPTED MANUSCRIPT
Connolly, T.M., Kuwano, R., 1999. The measurement of Gmaxin a resonant column, bender
elements, torsional shear apparatus. In: Proceedings Second International Symposium on
Pre-failure Deformation Characteristics of Geomaterials, Torino, Italy, 1, 73–80.
Drnevich, V.P., 1985. Recent developments in resonant column testing. In: Proceedings
Richart Commemorative Lectures, ASTM Specialty Session, Detroit, pp. 79–107.
Hight, D.W., Gens, A., Symes, M.J., 1983. The development of a new hollow cylinder
apparatus for investigating the effects of principal stress rotation in soils. Géotechnique
33(4), 355–383.
Lade, P.V., Duncan, J.M., 1975. Elastoplastic stress strain theory for cohesionless soil.
ASCE Geotechnical Engineering J. 101(GT10), 1037–1053.
Matsuoka, H., Nakai, T., 1985. Relationship among Tresca, Mises, Mohr-Coulomb and
Matsuoka-Nakai failure criteria. Soils and Foundations 25(4),123–128.
Matsuoka, H., Suzuki, Y., Murata, T., 1990. A constitutive model for soils evaluating
principal stress rotation and its application to some deformation problems. Soils and
ACCEPTED MANUSCRIPT
Naughton, P.J., O’Kelly, B.C., 2003. The anisotropy of Leighton Buzzard sand under
general stress conditions. In: Proceedings Third International Symposium on Deformation
Characteristics of Geomaterials, Lyon, France, 1, 285–291.
Naughton, P.J., O'Kelly, B.C., 2007. Stress non-uniformity in a hollow cylinder torsional
sand specimen. Geomechanics and Geoengineering 2(2), 117–122.
O’Kelly, B.C., Naughton, P.J., 2003. Development of the University College Dublin
hollow cylinder apparatus. In: Proceedings 56th Canadian Geotechnical Conference,
Winnipeg, Ontario.
O’Kelly, B.C., Naughton, P.J., 2005a. Development of a new hollow cylinder apparatus for
stress path measurements over a wide strain range. ASTM Geotechnical Testing J. 28(4),
345–354.
O’Kelly, B.C., Naughton, P.J., 2005b. Engineering properties of wet-pluviated hollow
cylindrical specimens. ASTM Geotechnical Testing J. 28(6), 570–576.
O'Kelly B.C.; Naughton P.J., 2008a. Local measurements of the polar deformation response
ACCEPTED MANUSCRIPT
O’Kelly B.C.; Naughton P.J., 2008b. Measuring shear strain in a hollow cylinder apparatus
using electrolevel-inclinometer gages. In: Proceedings Fourth International Symposium on
Pre-Failure Deformation Characteristics of Geomaterials, Atlanta, Georgia, USA.
O’Kelly B.C.; Naughton P.J., 2008c. Use of proximity transducers for local radial strain
measurements in a hollow cylinder apparatus. In: Proceedings Fourth International
Symposium on Pre-Failure Deformation Characteristics of Geomaterials, Atlanta, Georgia,
USA.
Pradel, D., Ishihara, K., Gutierrez, M., 1990. Yielding and flow of sand under principal
stress axes rotation. Soils and Foundations 30(1), 87–99.
Saada, A.S., Townsend, F.C., 1981. State of the art: laboratory strength testing of soils. In:
Laboratory Shear Strength of Soils, ASTM STP740, Philadelphia, pp. 7–77.
Sivathayalan, S., Vaid, Y.P., 1998. Truly undrained response of granular soils with no
membrane penetration effects. Canadian Geotechnical J. 35, 730–739.
Tatsuoka, F., Ishihara, K., 1974. Yielding of sand in triaxial compression. Soils and
ACCEPTED MANUSCRIPT
Tatsuoka, F., Muramatsu, M., Saski, T., 1983.Closure toCyclic undrained stress-strain
behavior of dense sands by torsional simple shear tests. Soils and Foundations 23(3), 142–
145.
Tatsuoka, F., Sonoda, M., Hara, K., Fukushima, S., Pradhan, T.B.S., 1986. Failure and
deformation of sand in torsional shear. Soils and Foundations 26(4), 79–97.
Terzaghi, K., 1943. Theoretical Soil Mechanics. John Wiley and Sons, New York.
Wijewickreme, D., 1990. Behavior of sand under simultaneous increase in stress ratio and
ACCEPTED MANUSCRIPT
Figure captions
Fig. 1. Stress states along rupture surface.
(a) Surface tractions.
(b) Stress components.
(c) Principal stresses.
Fig. 2. Stress state in hollow cylinder torsional specimen.
Fig. 3. UCD hollow cylinder torsional apparatus.
Fig. 4. Pressure compensation system for thrust-torque transducer.
[image:38.595.75.501.167.726.2]ACCEPTED MANUSCRIPT
Fig. 6. Inclinometer gauges: double-axes (left); single-axis (right).
Fig. 7. Specimen set up inside the pressure cell.
Fig. 8. Schematic of data acquisition and control systems.
Fig. 9. Flow chart for control algorithms.
Fig. 10. Stress probing to identify yield loci.
ACCEPTED MANUSCRIPT
Fig. 12. Variation of deviator stress on yield loci.
(a) Matsuoka-Nakai criterion.
(b) Lade criterion.
ACCEPTED MANUSCRIPT
Table captions
Table 1. Equations for stress and strain components.
Table 2. Control parameters used in the algorithms.
Table 3. Limiting rates that identify whether the specimen has achieved equilibrium.
ACCEPTED MANUSCRIPT
Study of the yielding of sand under generalized stress conditions using a
versatile hollow cylinder torsional apparatus
[image:42.595.72.503.194.722.2]Brendan C. O’Kelly and Patrick J. Naughton
Fig. 1. Stress states along rupture surface.
(b) Stress components. (c) Principal stresses.
ACCEPTED MANUSCRIPT
[image:43.595.94.402.384.713.2]Fig. 3. UCD hollow cylinder torsional apparatus.
Fig. 4. Pressure compensation system for thrust-torque transducer.
Inclinometers Proximity transducer Thrust-torque transducer
Test specimen
Stepper motors
Gearbox
Screw-spline shaft Pulleys and tensioned cables
Displacement transducer Rotary encoder Support frame Acrylic cylinder
Loading piston Loading platen Reaction platen
Thrust-torque transducer
Reaction platen
Test specimen Oil-filled cavity
Oil inlet
Specimen inner
bore cavity Specimen top cap
Air breed Transducer
housing
ACCEPTED MANUSCRIPT
[image:44.595.97.376.393.617.2]Fig. 5. Calibration of thrust-torque transducer.
Fig. 6. Inclinometer gauges: double-axes (left); single-axis (right).
25 mm
(a) Loading sequences.
ACCEPTED MANUSCRIPT
Fig. 7. Specimen set up inside the pressure cell.
Thrust-torque
transducer
Reaction platen
Proximity transducer Test specimen Annular, porous disc with protruding ribs
Specimen inner
bore cavity
Loading platen Locating dowels
Loading piston Outer
ACCEPTED MANUSCRIPT
[image:46.595.96.393.380.699.2]ACCEPTED MANUSCRIPT
Fig. 10. Stress probing to identify yield loci.
BE and FK are segments of developing yield loci
ACCEPTED MANUSCRIPT
(a)
(b)
(c)
[image:48.595.94.501.72.739.2]ACCEPTED MANUSCRIPT
Fig. 12. Variation of deviator stress on yield loci.
0.8 0.9 1 1.1 1.2
0 0.25 0.5 0.75 1
Intermediate principal stress parameter, b
M a ts u o k a -N a k a i N o rm a liz e d C o n s ta n t
= 300
= 600
= 00
= 900
(a) Matsuoka-Nakai criterion.
0.8 0.9 1 1.1 1.2
0 0.25 0.5 0.75 1
Intermediate principal stress parameter, b
L a d e N o rm a liz e d C o n s ta n
t = 300
= 600
= 00
= 900
ACCEPTED MANUSCRIPT
Study of the yielding of sand under generalized stress conditions using a
versatile hollow cylinder torsional apparatus
[image:50.595.80.515.224.699.2]Brendan C. O’Kelly and Patrick J. Naughton
Table 1. Equations for stress and strain components.
Axis direction Mean stress Mean strain
Axial normal 2 i 2 e 2 i i 2 e e 2 i 2 e z r r r p r p ) r r ( W
z Hv
Radial normal
2
2i 2 e i e i e 2 e 2 i 2 i 2 e 2 i i 2 e e r r r r r ln p p r r 2 r r r p r p i e i e r r r w w Circumferential
normal
2
2 [image:50.595.82.517.521.725.2]i 2 e i e i e 2 e 2 i 2 i 2 e 2 i i 2 e e r r r r ln p p r r 2 r r r p r p i e i e r r w w Circumferential shear ) r r )( r r ( 3 ) r r ( T 4 2 i 2 e 4 i 4 e 3 i 3 e z ) r r ( H 3 ) r r ( 2 2 i 2 e 3 i 3 e z
Table 2. Control parameters used in the algorithms.
Stress parameter Equation Max difference between
target stress points
Mean effective confining
stress p 1 32 3
5.0 kPa
Intermediate principal stress parameter 3 1 3 2 ' ' ' ' b 0.1 Major-to-minor effective principal stress ratio
3 1 ' ' ' R 0.1 Major-to-minor principal stress difference
t = '1–'3 5.0 kPa
ACCEPTED MANUSCRIPT
Table 3. Limiting rates that identify whether the specimen has achieved equilibrium.
Stress component Unit Rate
Axial, radial and circumferential normal strains
strain/min
5x10⁻⁵
Circumferential shear strain 1x10⁻⁵
Pore water pressure kPa/min 0.5
Table 4. Physical properties of Leighton Buzzard sand.
Coefficient of uniformity, CU 1.32
Coefficient of curvature, CZ 0.96
Effective grain size, D10(mm) 0.44
Specific gravity of solids 2.64
Maximum void ratio 0.80