Journal of Chemical and Pharmaceutical Research, 2013, 5(11):244-249
Research Article
CODEN(USA) : JCPRC5
ISSN : 0975-7384
Thermal stability study and microcapsule preparation of argan oil
Zhao Xi*1, Yang Dong-sheng1, Wu Xiao-li2, Wu Li-yan1, Jin Yuan-bao1 and Zhao Cheng-guo1
1
Department of Chemistry and Pharmacy, Zhuhai College of Jilin University, Zhuhai, China 2
School of Chinese Materia Medica, Guangzhou University of Chinese Medicine, Guangzhou, China _____________________________________________________________________________________________
ABSTRACT
To study the oxidative stability of argan oil, and to optimize parameters for preparing argan oil microcapsule. Schall oven test that measured peroxide values and acid values of samples of different storage durations (at 2-day intervals over a 22-day storage period) at 62±1°C was conducted to determine index factors of oxidative stability and to evaluate the length of shelf life. Microcapsules of argan oil (core structure)-chitosan crosslinked with gelatin (shell structure) were prepared by complex coacervation method. And the effects of various processing parameters were preliminary investigated by using statistical analysis. Experimental data showed that the optimum parameters were that presetting pH at 6.0-6.4, controlling crosslinking time and complex coacervation at 70min and 15min, respectively. Under these conditions, microcapsules were uniform spherical particles with smooth surface and good dispersibility. Microcapsules products containing argan oil developed by a simple complex coacervation approach were spherical and smooth with good dispersibility, which deserves further researches and developments.
Key words: Argan oil, Microcapsule, Chitosan, Complex coacervation, Statistic analysis.
_____________________________________________________________________________________________
INTRODUCTION
Argan oil with remarkable antioxidant activities is produced from the fruits of the Argan, a species of tree endemic to southwestern Morocco[1, 2]. The phytochemical profiles of this oil showed that consists a plenty of polyphenol, sterol, squalene, triterpene alcohol and other phenolic compounds [3]. Previous studies have reported that argan oil possessed diverse pharmacological activity including anti-proliferation, antidiabetic effect, anti-hypertension and cardiovascular protection by using human and animal models [2, 3]. Microcapsules provides an effective method in protection of active ingredients against products deterioration and volatile constituent loss or controlled release for maximizing utilization of substances and minimizing toxic and side effect [4-7]. Also, it can mask or preserve odour and transform liquids into easily handled solid ingredients, which is also valuable in formulation preparing of oils, such as vanilla oil.Therefore, in the present study, microemulsion of argan oil was firstly prepared and then applicated to a model system, argan oil-chitosan crosslinked with gelatin. Simplified and optimum method was provided and subjected to microcapsule preparation of argan oil.
EXPERIMENTAL SECTION
(YiKen machine Co. Ltd., Shanghai, CHN ) were all provided by chemistry and pharmacy laboratory, college of Zhuhai, university of Jilin.
Thermal stability study
Schall oven test was conducted to evaluate the thermal stability of argan oil. Briefly, precisely measured oil samples were storied in brown conical flasks and conducted to a Schall Oven at 62±1°C. Once the desired duration was reached, the oxidation stability of each sample was measured by determining peroxide value and acid value.
Determination of peroxide value(GB/T 5538—2005)
Oil sample (3.0 ~ 4.0g) was weighed and transferred into a conical flask, and 9.6 mL of acetic acid / isooctane solution was added in and mixed. The mixture was then reacted with a saturated potassium iodide solution (0.5mL) in darkness, for 60±1s with shakes (at least 3 times). After that, distilled water (30.0 mL) was added in and the mixture was shaken. The free iodine released was titrated with a 0.01mol/L sodium thiosulfate solution. The volumes of 0.01mol/L sodium thiosulfate solution of oil sample was measured against a reagent blank and the peroxide value was expressed as milliequivalents of active oxygen per kilogram of oil (mequiv/kg).When the volume of 0.01mol/L sodium thiosulfate solution of blank mixture reacting in the titration exceeded 0.1mL, all reagents should be re-prepared for further analysis.
Determination of acid value(GB/T 5538—2005)
Oils ample (3.0 ~ 5.0g) was accurately measured into a conical flask, and 50.0 mL of diethyl ether/ethanol solution was added in and shaken. The acid value was evaluated by titrating 0.1N KOH into the mixture using phenothalin as an indicator. The volumes of 0.1N KOH was recorded when the reddish color was kept for more than 30s and the peroxide value was expressed as milliequivalent of KOH per kilogram of oil (mequiv/kg).
Determination of cellulase activity
The ability of cellulase was determined by using the hydrolysis reaction of carboxymethyl cellulose (CMC). In a brief, cellulase was mixed with CMC substrate solution and then they generated reducing sugars such as fiber polysaccharides, disaccharide, and glucose. The ability of cellulase was determined via the measurement of reducing sugars’ yields by using the dinitrosalicylic (DNS) reagent method that reacted and generated colored compounds which could be measured by a spectrophotometer.
Preparation of calibration curves The stock standard glucose solution (500µg/mL) was then diluted into 160µg/ml、200µg/ml、240µg/ml、280µg/ml、320µg/ml by metered volume into 25mL volumetric flask with appropriate volumes of deionized water. All solutions were stored at 4℃.A series of standard glucose solutions and a reagent blank solution consisting no glucose were numbered. 2.5 mL of each solution was accurately measured into a test tube and added with 2.5mL of deionized water followed by an addition of 2.5 mL of DNS solution, after that the mixture was boiled at a 100℃ water bath for 5min. After cooled down, the absorption value (A) at 540nm of each standard solution against a reagent blank (2.5 mL deionized water only) was measured by an ultraviolet spectrophotometer. Calibration curve was generated by plotting absorption value (A) versus the concentrations of each standard solution (X).
Preparation of chitosan by cellulase-hydrogen peroxide degradation combining ultrasonic degradation
In this part, 3g of chitosan was accurately measured into a 100mL beaker, added in appropriate amount of cellulase and dissolved with appropriate volume of acetic/sodium acetate solution (pH=5.6). Then the mixture reacted in a ultrasonic cleaner (100W) with a water bath of 50℃ for 3h. After reaction, the chitosan solution was taken out and kept at 60℃ for a while, then added in 10% hydrogen peroxide and subjected to viscosity measurement.
Preparation of microcapsules by complex coacervation Preparation of O/W emulsion
Firstly, 10 mL of argan oil was accurately measured into a 50 mL beaker, added in 0.4mL of Tween 20/n-butanol solution (3:1,v/v), and dissolved completely in a water bath of 40℃. Then 30 mL of 2% NaCl solution was preheated in a water bath at 40℃. When temperatures of oil solution and NaCl solution reached an equal, 2% NaCl solution was swiftly poured into the oil solution and generated a system. Then the system was kept stirring at 5000 rpm for 5 min to form O/W emulsion. The obtained emulsion was then diluted with deionized water and subjected to the microscope for emulsion observation.
Preparation of microcapsules and morphology observation
microcapsule, emulsion was added into chitosan solution and gelatin solution, and the pH value of the mixture was adjusted from 6.0 to 6.4 with10%NaOH solution. After stirring for 15 min, the mixture solution was cooled at 4℃ by ice bath and added in 2.5 mL of glutaraldehyde solution for crosslinking reaction for 75min.
RESULTS AND DISCUSSION
[image:3.595.133.473.171.509.2]Results of storage stability study
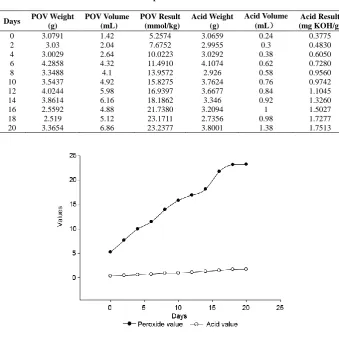
Table 1 Results of peroxide value and acid value
Days POV Weight (g)
POV Volume (mL)
POV Result (mmol/kg)
Acid Weight (g)
Acid Volume (mL)
Acid Result (mg KOH/g)
0 3.0791 1.42 5.2574 3.0659 0.24 0.3775
2 3.03 2.04 7.6752 2.9955 0.3 0.4830
4 3.0029 2.64 10.0223 3.0292 0.38 0.6050 6 4.2858 4.32 11.4910 4.1074 0.62 0.7280 8 3.3488 4.1 13.9572 2.926 0.58 0.9560 10 3.5437 4.92 15.8275 3.7624 0.76 0.9742 12 4.0244 5.98 16.9397 3.6677 0.84 1.1045 14 3.8614 6.16 18.1862 3.346 0.92 1.3260 16 2.5592 4.88 21.7380 3.2094 1 1.5027 18 2.519 5.12 23.1711 2.7356 0.98 1.7277 20 3.3654 6.86 23.2377 3.8001 1.38 1.7513
Figure 1 Trend graph of peroxide value and acid value
In this paper, storage stability study indicated that with the increase of storage time, peroxide value of argan oil rose significantly. Although acid value was also increased, there existed no correlation between acid value and storage time. In summary, acid value was not a sensitive indicator for evaluating the storage stability of argan oil.
Results of cellulase activity determination Calibration curve of glucose
Absorbance of each standard solution against a reagent blank at 540 nm was measured and listed in table 1. The detailed of regression curve and range are presented in figure2. Good linearity (R2 > 0.9999) was achieved within the investigated ranges for all the analytes.
Table 2 Concentration and absorbance value of glucose
[image:3.595.135.478.664.689.2]Figure 2 Regression curve of glucose
Activity of cellulase
According to the regression curve, y=440.97x+50.826 presented in figure2 and the absorbance of reducing sugars, the glucose concentration of crude celluloses was 241.33µg/mL. The activity of cellulase was calculated via the formula as 27666.
Results of viscosity determination
r,
[image:4.595.139.461.364.582.2]sp and sp/C values of different concentration solutions were calculate based on the concentration of chitosan that was measured according to the method in 1.3.2 and the value of “t” that determined by the Ubbelohde viscometer, respectively. The results were listed below in table 2.
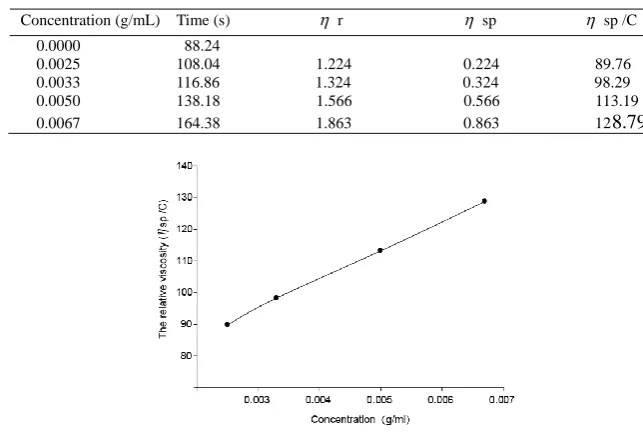
Table 3 Results of viscosity determinations of chitosan
Concentration (g/mL) Time (s) r sp sp /C 0.0000 88.24
0.0025 108.04 1.224 0.224 89.76 0.0033 116.86 1.324 0.324 98.29 0.0050 138.18 1.566 0.566 113.19 0.0067 164.38 1.863 0.863 128.79
Figure 3 The relationship between solution viscosity and the relative viscosity
According to the regression curve in figure2, the value of intrinsic viscosity was calculated to be 67.286mL/g. By using the Mark-Houwink’s empirical formula, M can be presented as M=1.03×10⁵ .
Results of O/W emulsion preparation
Fig.3 SEM picture of emulsion
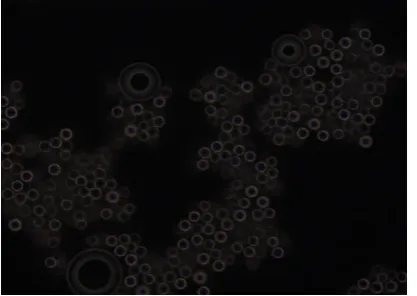
Results of microcapsule preparation and morphology observation
[image:5.595.217.426.72.220.2]In this study, microcapsule of argan oil was prepared by a complex coacervation method. The mathematical statistical analysis of the complex coacervation system showed that the concentration of system was the most important factor of microcapsule embedding rate. With the increases of concentrations, the embedding rate rose in the initial phase but gradually declined, which principally was due to the sharp reaction between most gelatin molecules possessing negatively charged and chitosan molecular possessing positively charged that generated a large amount floccules. And the optimum system concentration was 1%-2%. Secondly, the increases of pH values could decrease the film-forming ability of chitosan, which then activated the polyreaction with gelatin and restrained embedding proesses. In our study, the pH value was optimized to be 6.0~6.4. Another factor was the relative ratio of content of core to shell. In a certain range, when the ratio core rouse, the amount of core that per unit shell embed was increasing leading to ascending embedding rate. However, when the content of core went beyond a certain range, the leakage phenomenon would aggravate. In this part of study, the optimum coagulation and crosslinking times were 15min and 60~90min, respectively. In summary, experimental data showed that the optimum parameters were that presetting pH at 6.0-6.4, controlling crosslinking time and complex coacervation at 70min and 15min, respectively. Under these conditions, microcapsules were uniform spherical particles with smooth surface and good dispersibility.
Figure 4 microencapsulation
CONCLUSION
In this paper, storage stability study indicated that with the increase of storage time, peroxide value of argan oil rose significantly. Although acid value was also increased, there existed no correlation between acid value and storage time. In summary, acid value was not a sensitive indicator for evaluating the storage stability of argan oil.
To prepare the emulsion of argan oil, Tween 20/n-Butanol (1:1) was optimized to be an emulsifier/auxiliary emulsifier system, and the stirring speed, time and temperature were set at 1500r/min, 5min and 40℃, respectively. Results showed that the emulsion was consisted of spherical O/W emulsion droplets, and the average diameter was 60~90μm with uniform sizes. The optimal diameter was 80~90μm with the relative highest embedding rate.
70min, respectively. Under these conditions, microcapsules were uniform spherical particles with smooth surface and good dispersibility.
REFERENCES
[1] M Cherki; H Berrougui; A Drissi; A Adlouni; A Khalil. Pharmacol. Res.,2006, 54, 1-5.
[2]C Venegas; C Cabrera-Vique; L García-Corzo; G Escames; D Acuña-Castroviejo; LC López. J Agr. Food Chem., 2011, 59(22), 12102-8.
[3]HE Monfalouti. J Pharma. Pharmacol., 2010, 62(12), 1669-75.
[4]J Zhang; WQi; ZH Han. Technology of microcapsules and superfine grinding of food, Chemical Industry and Engineering, Beijing, 2005; 171-211.
[5]MH Gaucho. Microcapsules and microencapsulation Techniques, Noyes Date Corp Press, New York, 1976; 15-18.
[6]ZQ Liang. Microencapsulation technology and application, China Light Industry Press, Beijing, 1999; 30-32. [7]SX Tian. Microencapsulated technology, Light Industry Press, Beijing, 1989; 23-26.