
Prediction of accident trend at two lane federal highways using statistical approach
13
0
0
Full text
(2) ‘hazardous location’ and ‘high accident location’ often used as a synonym to blackspot. A blackspot was originally a road location of limited area with a high concentration of accidents. This definition has progressively evolved as several researches now recommend including the concept of potential for improvement (McGuigan, 1981; Elvik, 1988; Hauer, 1996). An Accident Prediction Model (APM) is a mathematical equation that expresses the average accident frequency of an entity as a function of traffic flow and other road characteristics. It is important to examine the nature of relationships between roadway, environmental and operational factors and, accidents to understand the causal mechanisms involved in accidents on the one hand and to better predict their occurrence on the other hand. APMs are one path of inquiry often used to gain these insights (Reurings et al., 2005). The Multiple Linear Regression is a statistical methodology describing relationships between a continuous outcome and a set of explanatory variables (Kutner et al., 2005). This technique is appropriate to describe relationships between continuous accident outcomes and explanatory variables.. A comprehensive. study of road safety (Treat et al., 1977) found that human error was the sole cause in 57% of all accidents and was a contributing factor in over 90%. In contrast, only 2.4% were due solely to vehicle and only 4.7% were caused only by road and environment factor. Based on categorical representation of lane width, for two-lane rural, two-lane urban, four lane urban undivided, and urban freeways, widening lane width up to 4.0m, 3.7m, 4.0m and 4.0m respectively could be expected to decrease crash rates (Hadi et al., 1995). In Australia, excessive speed is an important factor in approximately 20 percent of fatal crashes (Haworth et al., 1993) and speed is a probable or possible cause in 25 percent of rural crashes (Armour et al., 1990). Meanwhile, roads with higher ADT and pedestrian traffic are associated with higher accident frequencies for all highway types (Berhanu, 2004). 2. METHODOLOGY Four main stages in the methodology are data collection, analysis of accident data and identification of blackspot location, field work, and the development of an accident prediction model.. 179.
(3) B.6. Data Collection In this study, data collection involves two types of data namely primary data and secondary data. Secondary data are accident data obtained from the Royal Malaysian Police (RMP). Accident data was collected from the Batu Pahat Traffic Police Station, Batu Pahat Public Work Department, Bukit Aman RMP Headquater and Jabatan Keselamatan dan Jalan Raya (JKJR). The accident database is extracted from the POL27 and the accident record collected from the year 2007 until May 2010.. Meanwhile, primary data. includes geometrical data and field work data, specifically from field observation and Metrocount data. B.7. Analysis of Accident Data The purpose of preliminary analysis of the traffic accident data is to determine the broad nature of the accident problem.. At this stage, the. general patterns and trend of accident are established. Types of trend and statistics that take into account for the Federal Route 1 Johor Bahru – Labis (FT001), Federal Route 5 Johor Bahru – Melaka (FT005) and Federal Route 24 Yong Peng – Muar (FT024) are as follow: j.. Road accident statistics for year 2007 to May 2010. k. Accident and casualties for year 2007 to May 2010 l.. Accident by hours of the day for year 2007 to May 2010 (every two hours). B.8. Identification of Blackspot Location Identification and prioritization of accident blackspot location is carried out through ranking by accident point weightage.. B.9. Field Work The purpose of field work is to collect primary data at selected 8 locations from all route. Furthermore, the field works also important to document the site findings and photographs taking as evidence.. The road sections. selected for data collection are Km88, Km106 and Km112 at FT001, Km93 and Km122 at FT005 and Km5, Km11 and Km27 at FT024. These locations are selected based on the ranking of the Accident Point Weightage (APW). The Metrocount equipments are installed for 12 hours at each location in order to obtain data such as traffic volume and 85th percentile speed. Figure 180.
(4) 1 depicts the Metrocount equipment used in the field work.. The. measurements of lane width, shoulder with and number of access point are carried out manually at the study locations. Figure 2 shows the odometer used to measure the road geometry.. Figure 1. Metrocount. Figure 2. Odometer. 181.
(5) B.10. Accident Prediction Model and Sensitivity Analysis In this study, Microsoft Excel and Minitab statistical software are used in analyzing all data and developing an APM, furthermore to validate the coefficients and the model. The dependent variable for this model is the APW and the explanatory variables are the 85th percentile speed, hourly traffic volume, lane width, shoulder width, total number of access point, and type of road geometric (straight, hilly, curvy). Later, the sensitivity analysis is carried out on the model to determine the effect of each independent variable on the dependent variable; for instance, the effect that changes in speed will have on the APW.. 3. RESULTS AND DATA ANALYSIS The blackspot locations are determined with the ranking of the APW. The data obtained from 9 selected locations which have been installed with the Metrocount equipment are analyzed using the Microsoft Excel before preceded with the development of the APM by using multiple regression method. Furthermore, sensitivity analyses based on the developed model is carried out to check the differences if changes in value made on the independent variables. 3.1. Road Accident Statistics at FT001, FT005 and FT024 Figure 3 shows the accident statistics at the FT001 (Km85-130), FT005 (Km88-151) and FT024 (Km1-36) from year 2007 until May 2010. Referring to the figure, the highest number of total accidents is recorded at the FT005 with 2774 cases followed by FT001 with 1033 cases and FT024 with 925 cases. Of these, 179 fatalities are recorded at all 3 routes in this period of time. The most frequent accident is the damage only cases.. 182.
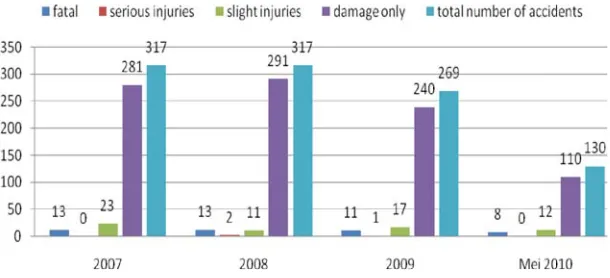
(6) Figure 3. Accident Statistic for 2007-May 2010. 3.2. Accident and Casualty a) Accident and Casualty at FT001 In this study, records of FT001 involve Km85 to Km130 which is about 45 kilometers stretches.. Figure 4 shows that in 2007 and 2008, the total. number of accidents recorded along FT001 is the highest with 317 cases in each year. However, the total number of cases reduces in 2009 until May 2010. The total number of accidents recorded from 2007 until May 2010 at the route is 1033 cases. Of these, 45 cases are fatal, 3 cases are serious injuries, 63 cases are slight injuries and 922 are damage only cases.. Figure 4. Accident and Casualty at FT001 (2007-May 2010). 183.
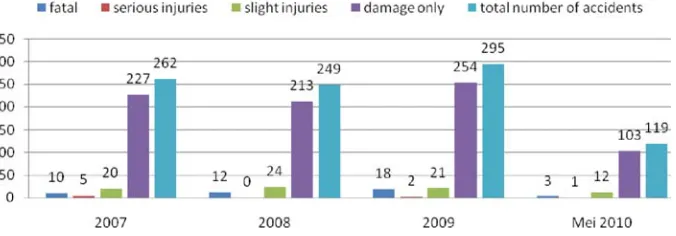
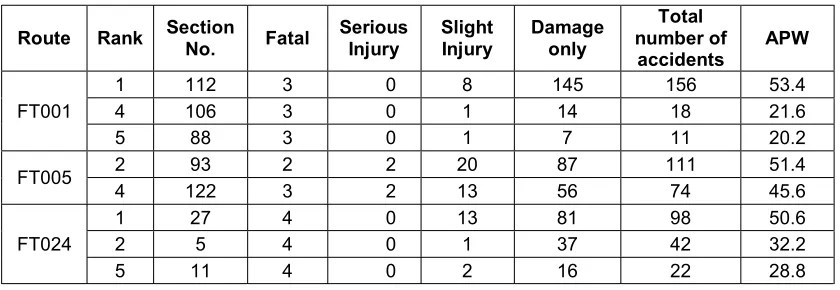
(7) b) Accident and Casualty at FT005 Records of FT005 involve Km88 to Km151 which is about 63 kilometers stretches.. Figure 5 shows that in 2009 the total number of accidents. recorded along FT005 are the highest with 844 cases. The total number of cases increased every year. The total number of accidents recorded from 2007 until May 2010 at this route is 2774 cases. Of these, 91 cases are fatal, 31 cases are serious injuries, 357 cases are slight injuries and 2295 cases are damage only.. Figure 5. Accident and Casualty at FT005 (2007-May 2010). c) Accident and Casualty at FT024 In this study, records of FT024 involve Km1 to Km36 which is about 36 kilometers stretches.. Figure 6 shows that in 2009 the total number of. accidents recorded along FT024 are the highest with 295 cases. The total number of accidents recorded from 2007 until May 2010 at the\is route is 925 cases. Of these, 43 cases are fatal, 8 cases are serious injuries, 77 cases are slight injuries and 797 cases are damage only.. Figure 6. Accident and Casualty at FT024 (2007-May 2010). 184.
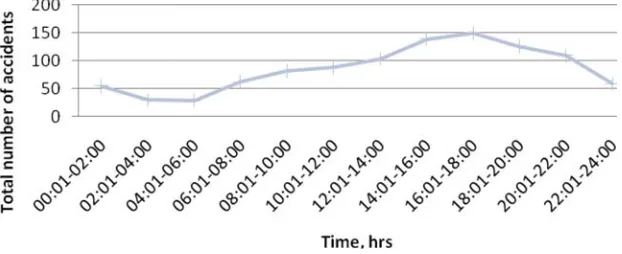
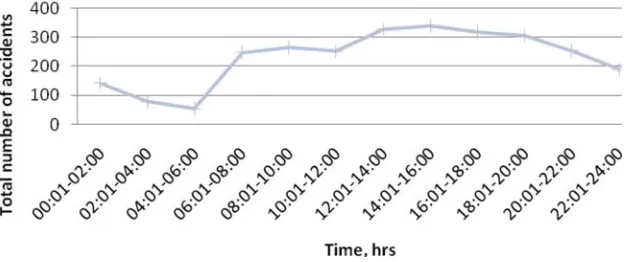
(8) 3.3. Accident Data by Hours of the Day Figure 7 through 9 show the total number of accident for every 2 hours beginning midday to midnight throughout the year from 2007 to May 2010. The analyses are carried out for every route and the largest number of accidents recorded at 14:01 to 18:00 or 2:01 to 6:00 p.m. This pattern might happened because the period especially 4:01 to 6:00 p.m. is the peak hours where the density of traffic is high on roads and since the federal roads are at the rural area, speeding may also being a factor contributes to accident occurrence. a) Accidents by Hours of the Day at FT001 Figure 7 shows that the highest number of accidents occurred at FT001 recorded from 16:01 to 18:00 with 150 cases followed by 139 cases at 14:01-16:00. The least number of accidents happened is at 04:01 to 06:00 with 29 cases are recorded.. Figure 7. Accident by Hours of the day at FT001. b) Accidents by Hours of the Day at FT005 Figure 8 shows that the highest number of accidents occurred at FT005 recorded from 14:01 to 16:00 with 339 cases followed by 328 cases at 12:01-14:00. The least number of accidents recorded is at 04:01 to 06:00 with 54 cases are recorded.. 185.
(9) Figure 8. Accident by Hours of the day at FT005. c) Accidents by Hours of the Day at FT024 Figure 9 shows the highest number of accidents occurred at FT024 recorded from 16:01 to 18:00 with 130 cases followed by 123 cases at 14:01-16:00. The least number of accidents recorded is at 04:01 to 06:00 with 26 cases are recorded.. Figure 9. Accident by Hours of the day at FT024. 3.4. Accident Point Weightage Ranking The calculation for APW is carried out using Equation (1) and ranked using the Microsoft Excel. APW = X1(6.0) + X2(3.0) + X3(0.8) + X4(0.2). (1). Where, X1, X2, X3 and X4 are the number of fatal, serious Injury, slight injury and damage only, respectively. 186.
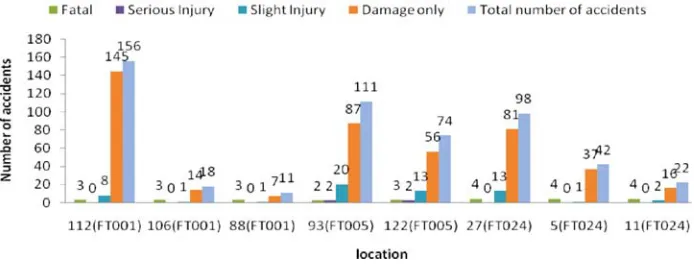
(10) 3.5. Selected Study Location Using Equation (1), APW for every kilometer in a route is calculated and the sections are accordingly ranked. From rank 1 to 5 of every route, 8 sections have been selected for further investigation.. Table 1 shows the list of. selected sections in every route with regards to type of accident and APW values. Table 1. 8 selected sections for FT001, FT005 and FT024. Route. FT001. FT005. FT024. 3.6. Rank. Section No.. Fatal. 1 4 5 2 4 1 2 5. 112 106 88 93 122 27 5 11. 3 3 3 2 3 4 4 4. Serious Injury 0 0 0 2 2 0 0 0. Slight Injury. Damage only. 8 1 1 20 13 13 1 2. 145 14 7 87 56 81 37 16. Total number of accidents 156 18 11 111 74 98 42 22. APW 53.4 21.6 20.2 51.4 45.6 50.6 32.2 28.8. Number of Accidents at Study Locations Figure 10 depicts the accident data at every selected section. Referring to the figure, for the fatal accident, Km 5, Km 11 and Km27 from FT024 recorded the highest number with 4 cases at each location while the lowest is recorded with 2 cases at Km93 (FT005). Furthermore, for the serious injury accident, Km93 (FT005) and Km122 (FT005) record 2 cases at each location while the other locations record none. Km93 (FT005) records the highest number of slight injury accident with 20 cases while Km106 (FT001), Km88 (FT001) and Km5 (FT024) record the lowest number with 1 case at each location. The highest number of damage only accident is at Km112 (FT001) with 145 cases and the lowest is at Km88 (FT001) with 7 cases. For overall, the location with highest total number of accidents is Km112 (FT001) with 156 cases while the lowest is Km88 (FT001) with 11 cases.. 187.
(11) Figure 10. Accident statistic at study locations. 3.7. Model Development In this study, multiple regression analysis is conducted using the Minitab. After considering the best fitted model and with transformation of level-level linear regression to log-level linear regression, the APM that has been developed is as follows: ln (APW) = 0.000098(HTV) + 0.00469(85th PS) + 0.0476(AP) + 0.137(ST) – 0.4386(HI) – 0.170(LW) – 0.0602(SW) + 3.49 (2) Where, APW = accident point weightage HTV = hourly traffic volume 85th PS = 85th percentile speed AP = number of access points per kilometer ST = straight road geometry HI = hilly road geometry LW = lane width SW = shoulder width a) From the analysis, the developed model has an R-squared of 0.994 and adjusted R-squared of 0.993, which means 99.4% and 99.3% of the variation in the number of accidents has been explained the regression line. Table 2 shows the range of explanatory variables values can be used for this model.. 188.
(12) Table 2. Range of values for independent variables in Accident Prediction Model developed Factor Hourly Traffic Volume (HTV) 85th Percentile Speed (85th PS) Number of access points (AP) Lane width (LW) Shoulder width (SW). Range of Values 494 - 2415veh/hr 60.8 – 98.3 km/hr 0 – 14 3.4 – 4.2 m 0.35 – 2.8 m. 4. CONCLUSION This study used the APW from the HPU to determine the black spot locations before ranking them in one kilometer at each location. Further analysis of this study is to develop predictive model relating accident weighting point with the selected independent variables has been achieved. Multiple regression techniques are used to build the model. The model is as shown in Section 3.8. The result of the sensitivity analysis provide sufficient evidence to support the hypothesis that the independent variables include Hourly Traffic Volume, 85th Percentile Speed, total number of access points, lane width and shoulder width are related to the accident weighting point. It can be conclude that for instance: x. Doubling the hourly traffic volume is expected to cause a 26.7% increase in percentage of the predicted APW.. x. A 10% increment of 85th percentile speed is expected to cause a 4.7% increase in percentage of the predicted APW.. x. Widening to lane by 10% increment from the existing width is expected to reduce the percentage of the predicted APW for about 6.9%.. x. Widening to shoulder by 10% increment from the existing width is expected to reduce the percentage of the predicted APW for about 1.7%.. x. An increase of 5 point in approach number of access point is expected to cause a 26.9% increase in the percentage of the predicted APW.. Finally, the developed Accident Prediction Model in this study is expected to be applicable in road safety improvement especially to reduce the number of accidents at two-lane federal roads by emphasizing into consideration the factors that predict the model at the design and planning stages.. 189.
(13) 5. ACKNOWLEDGEMENT We would like to thanks the Batu Pahat Police Station and the Jabatan Kerja Raya, Batu Pahat Branch for their cooperation in getting the data. 6. REFERENCES Armour, M. & Cinquegrana, C. (1990). Victorian study of single vehicle rural accidents. Proceedings of the 15th Australian Road Research Board Conference, Part 7. pp 79-91. Australian Road Research Board.Melbourne Berhanu, G. (2004). Model relating traffic safety with road environment and traffic flow on arterial roads in Addis Ababa. pp 697-704. Adis Ababa University Elvik, R. (1998). Some Difficulties in Defining Populations of ‘entities’ for Estimating the Expected Number of Accidents. Accident Analysis and Prevention. V20, N4, pp 261-275 Hadi Mohammed A., Jacob Aruldhas, Lee-Fang Chow, and Joseph A. Wattleworth (1995). Estimating Safety of Cross-Section Design for Various Highway Types Using Negative Binomial Regression. Transportation Research Record, 1500, 169-177 Hauer, E. (1996). Identification of Sites with Promise. Transportation Research Record 1542. pp 54-60 Kutner M.H., Nachtsheim C.J., Neter J. & Li W. (2005). Applied Linear Statistical Models. 5th edition McGuigan D.R.D. (1981). The Use of Relationship between Road Accidents and Traffic Flow in ‘blackspot’ Identification. Traffic Engineering. V12, N1, pp 448453 Mohd Shafii, Subiah Sulaiman, Norliah Saidin, PM Radin Umar, R.S, P/PPP Ruslan Khalid, PPP Ooi I.B, Ir Sabudin Mohd. Salleh, Sanusi Ismail (1995). Interim Guide on Identifying, Prioritizing and Treating Hazardous Locations on Roads in Malaysia. Kuala Lumpur: Percetakan Ibu Pejabat JKR Malaysia Murray, C. & Lopez, A.D. (1996). The Global Burden of Disease. World Health Organization, Harvard School of Public Health: World Bank, Boston. Reurings M., Janssen T., Eenink R., (SWOV), Elvik R., (TOI), Cardoso J., (LNEC), and Christian S., (KfV), (2005). Accident Prediction Models and Road safety Impact Assessment. RI-SWOVWP23- R1-V2 Ross Silcock Partnership (1991). Towards Safer Road in Developing Countries, a Guide for Planner and Engineers. TRRL: First Edition Treat, J.R., Tumbas, N.S., McDonald, S.T., Shinar, D., Hume, R.D., Mayer, R.E., Stanisfer, R.L. & Castellan, N.J. (1997). Tri-level Study of the Causes of Traffic Accidents. Report No. DOT-HS-034-3-535-77 (TAC) World Road Association- PIARC (2003). Road Safety Manual. Quebec. 190.
(14)
Figure

+5

Related documents
4.1 The Select Committee is asked to consider the proposed development of the Customer Service Function, the recommended service delivery option and the investment required8. It
• Follow up with your employer each reporting period to ensure your hours are reported on a regular basis?. • Discuss your progress with
Biological control is the use of living organisms, such as predators, parasitoids, and pathogens, to control pest insects, weeds, or diseases.. Other items addressed
National Conference on Technical Vocational Education, Training and Skills Development: A Roadmap for Empowerment (Dec. 2008): Ministry of Human Resource Development, Department
Company C will have to undertake a valuation exercise to determine the allocation of minimum lease payments between the land and building elements of the lease in order to
This method of determining the Final Price will apply only if Bank informs potentially interested parties (including, but not limited to, Parent) that Bank intends to enter into
