Effects of Salinity on Growth, Feeding and the mRNA
Expression of Na
+
/K
+
-ATPase and HSP 90 in
Liza haematocheila
Anglu Shen
1,2, Keji Jiang
1,2, Jing Wang
1,2, Xinqiang Shen
1,2,*1Key Laboratory of East China Sea & Oceanic Fishery Resources Exploitation and Utilization, Ministry of Agriculture, P.R.China; 2East China Sea Fisheries Research Institute, China
Copyright © 2015 Horizon Research Publishing All rights reserved.
Abstract
The effects of various salinities on growth, feeding and the mRNA expression of related genes in Liza haematocheilus were investigated. Fish were maintained at four salinities for 30 days to analyse the specific growth rate (SGR), the feeding rates (FR) of L. haematocheilus, and the mRNA expression of Na+/K+-ATPase (NKA) and Hsp 90 were measured at 0, 5, 10, 20 and 30 d, respectively. The results showed that the SGR of L. haematocheilus at 14 psu group was higher than the 2 and 42 psu group significantly; the FR of L. haematocheilus at 14 psu group was the highest and the 2 psu group was the lowest at 20 or 30 day; the NKA mRNA abundances in L. haematocheilus were increased significantly in the 2, 14 and 42 psu groups at 5 day (P < 0.05), and the lowest level emerged in the control group (28 psu), the same relationship was observed for Hsp 90 but the change scopes were smaller. The results indicate that the increased expression of NKA and Hsp 90 mRNA inL. haematocheilus is a part of the molecular responses to the osmotic stress of changes in salinity.
Keywords
Liza haematocheilus, Salinity, Specific Growth Rate, Feeding Rates, Na+/K+-ATPase, HSP 901. Introduction
Euryhaline teleosts present the capacity to tolerate the different environmental salinities by using efficient osmoregulatory mechanisms to maintain homeostasis [1]. Fish in an isotonic medium had the lowest standard metabolic rates and fish must impose energetic regulatory costs for active ion transport if environmental salinities are differ from the internal osmotic concentration [2-3]. Many species (early developmental stages) optimal for intermediary salinity conditions of brackish water (BW) and grow optimally in estuaries and coastal systems [2-5].
Na+/K+-ATPase (NKA) mediates the active secretory functions of chloride cells in fish by generating a chemical
gradient for ion transport [6-7], which is responsible for the active transport of Na+ out of and K+ into relative cells [8-10]. The functional pump is composed of a catalytic α (α1-4 isoforms) subunit and an accompanying glycosylated β (β1-3 isoforms) subunit and among these isoforms, α1 subunit that is predominantly expressed in the transporting epithelia in higher vertebrates functions primarily in a housekeeping capacity to maintain osmotic balance and cell volume regulation [11]. There are two NKA α1 isoforms in the fill of some fishes such as Oncorhynchus mykiss [12], Salmo salar
[13-17] and Oreochromis mossambicus [18], the mRNA level of NKA α1a isoform increases after transferred from freshwater (FW) to seawater (SW), and that of the α1b isoform increases after transferred from SW to FW [17-18]. NKA mRNA expression increased when the European sea bass Dicentrarchus labrax were transferred from 15 psu to 50 psu or FW [19]. The euryhaline killfish Fundulus heteroclitus often move between SW and FW environments and NKA expression also increased whether fish were transferred from BW to SW or FW [20]. Thus, there are many kinds of NKA change way in fish. Hsp 90 is active in supporting various components of the cytoskeleton and steroid hormone receptors [21]. It is now widely accepted that Hsp amounts in the cell, are not only altered upon exposure to temperature stress but also to a range of abiotic, biotic and chemical stressors [15]. Previous studies have reported that the relationship between Hsp 90 mRNA expression and environmental salinities in some species [22].
52 Effects of Salinity on Growth, Feeding and the mRNA Expression of Na+/K+-ATPase and HSP 90 in Liza haematocheila
process of salinity changes in Mugilidae [25-26]. Therefore, the aim of the present study was to assess the affection of salinity on the growth, feeding, NKA α1b subunit and Hsp 90 β mRNA expression patterns of L. haematocheilus.
2. Material and Methods
2.1. Animals
About 500 L. haematocheilus, with a mean body length of 2.08 ± 0.14 cm and wet weight of 0.126 ± 0.024 g (means ± standard deviation), were collected from the estuary in the Yangtze River, China. The young L. haematocheilus were acclimatised in a large aquarium (200 L) for one week before the beginning of the experiment. The salinity of the seawater in the aquarium was 28 psu, and the temperature was maintained at 15 ± 1 °C throughout the acclimatisation. Liza haematocheilus were fed on artemia nauplius daily at 7:00 and 16:00.
2.2. Experimental Design
Liza haematocheilus were subjected to four treatments in 50 L acrylic aquaria containing 40 L of water under various salinity of 2, 14, 28 (the control) and 42 psu at the room temperature. During all the experiments, L. haematocheilus
were fed on live enriched Artemia nauplius daily at 7:00 and 16:00 and about 50% treatment seawater was replaced every 3 d. In the experiment, the SGR of L. haematocheilus was determined at 0 d and 30 d, the method of SGR was previously described by Sampaio and Bianchini (2002). In short, 10 fishes were randomly sampled from each replicate tank when the experiment at beginning and end. SGR was calculated using the formula: SGR(%/d)=[( Wt/W0) 1/t -1]×100, where W0 was initial wet weight (g) and Wt was the wet weight at the end (g), t was experimental days (d). The FR of L. haematocheilus was determined at 10, 20 and 30d, respectively; the method of FR was previously described by Zhu et al. (2006) with minor revision. In short, 400 ml of seawater with artemia nauplius (about 70 ind./ml) in 500 ml beaker and 5 fishes in each beaker, the feeding time for 40 mins, 10 ml seawater with Artemia nauplius was fixed with formaldehyde and counting when the experiment at beginning and end. Each group with different salinity was replicated. FR was calculated using the formula: FR = V×(D0-Dt) /nt, where V was the volume of the seawater (ml), D0was the density of Artemia nauplius before the experiment (ind./ml), Dt was the density of Artemia nauplius after the experiment (ind/ml), n was the number of fishes in each group, t was time during the feeding (min). The mRNA expressions of NKA and Hsp 90 of L. haematocheilus were determined at 0, 5, 10, 20 and 30 d, respectively; three individuals were randomly sampled from each aquarium, and the fish was stored in RNAstore reagent (Tiangen) until use.
2.3. RNA Purification and cDNA Synthesis
Total RNA was purified from the samples using the TRIzol reagent (Invitrogen), genomic DNA was digested with Dnase I (Invitrogen), and the purified RNA was stored at -80°C after isolation. The first-strand cDNA synthesis was performed using M-MLV reverse transcriptase (Invitrogen) to transcribe the poly (A) mRNA with Oligo-dT and random 6-mer primers. The reaction conditions were those recommended by the manufacturer’s instructions. The cDNA was maintained at -20 °C until use as the template for the quantitative real-time PCR (qRT-PCR).
2.4. Quantification of mRNA Expression
The mRNA expression of the target genes was measured by qRT-PCR. Specific primers were designed based on L. haematocheilus mRNA sequences (GenBank accession no. JQ844546 and JX272925) using Primer Premier 5 (PREMIER Biosoft International, Palo Alto, CA). The primer sequences are shown in Table 1. The qRT-PCR amplifications were carried out with an ABI StepOnePlus Detection system (Applied Biosystems, Foster City, CA, USA). The amplifications were performed in a 96-well plate with a 20-μL reaction volume containing 10.0 μL of 25× SYBR Green I, 0.8 μL of PCR Forward Primer (10 μM), 0.8 μL of PCR Reverse Primer (10 μM), 0.4 μL of ROX Reference Dye‖ (50×), 2.0 μL of cDNA temple and 6.0 μL of diethylpyrocarbonate water (DEPC-water). The thermal profile for the SYBR Green qRT-PCR consisted of an initial step at 95 °C for 90 s, followed by 40 cycles of 95 °C for 5 s and 58 °C for 30 s. All samples were run in triplicate. In this experiment, a preliminary trial showed that the β-actin gene had a steady expression in this experimental species. Therefore, the β-actin gene was used as the housekeeping gene in all of the qRT-PCR assays, and the primers (Table 1) were designed based on the β-actin gene sequence (GenBank accession no. FL589653). The standard curve and the gene expression levels were analysed automatically, as was the setting of the base line. A melting curve analysis of the amplification products was performed at the end of each PCR reaction to confirm that only one product was amplified and detected. For the experimental results of the qRT-PCR, the observations at the beginning in the experiment of 28 psu group were initiated as “1.0”, and all the relative ratios of gene expression levels were then calculated to derive the means and standard deviation (SD).
2.5. Data Analysis
Table 1. Na+/K+-ATPase and Hsp 90 βgenes of L. haematocheilus and their specific PCR primers used for RT-PCR Target gene GenBank# Primer sequence (5′→3′) Product (bp) Na+/K+-ATPase Fr JQ844546 GAACCGTCACCATCCTCTGT 167 Na+/K+-ATPase Rr JQ844546 GCCGATTTGTCCGTATGCTA 167
HSP90Fr JX272925 CGCAAGAACATCGTCAAGAA 219
HSP90Rr JX272925 CTTCATGCGGGTCAGGTACT 219
β-actin Fr FL589653 GCCGTGACCTCACAGACTACCT 185
β-actin Rr FL589653 TTGATGTCTCGCACGATTTCTC 185
Figure 1. Effects of salinity on the SGR of L. haematocheilus, data are expressed as mean ± SD. Different letters indicate significant differences among groups (one way ANOVA, P<0.05).
3. Results
3.1. Effects of Salinity on the SGR
Figure 1 showed the SGR of L. haematocheilus stressed by the different salinity (2, 14, 28 and 42 psu) at 30 d. No significant differences was found between 2, 28 and 42 psu (P > 0.05), but the SGR of L. haematocheilus at 14 psu was higher than 2 and 42 psu groups (P < 0.05) and no significant difference with 28 psu group (P > 0.05).
3.2. Effects of Salinity on the FR
Figure 2 showed the FR of L. haematocheilus stressed by the different salinity at 10, 20 and 30 d, respectively. No significant correlation was found between the FR and salinity at 10 d (P > 0.05), but the FR of L. haematocheilus at 28 psu group (control group) was the highest and that of the 2 psu group was the lowest; the FR was significantly different between salinity groups at 20 d (P < 0.05), the FR of L. haematocheilus at 14 psu group was significantly higher than other groups, the FR of L. haematocheilus at 2 psu group was
significantly lower than those of other groups; The changes of the FR in different group at 30 d were similar with those changes at 20 d.
3.3. Effects of Salinity on the mRNA Expression of NKA and HSP 90
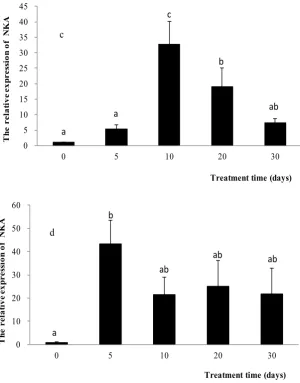
The mRNA expression of NKA α1b subunit in L. haematocheilus were increased significantly at 5 d stressed by 2, 14 and 42 psu groups (P < 0.05), especially in 42 psu group, the mRNA expression level of NKA α1b subunit was 8 times of that of 28 psu group. In the later days, the mRNA expression of NKA α1b subunit of 2 and 42 psu groups were decreased and there were high level in 14 psu group (Fig. 3A, B and D). However, in the control group, the mRNA expression of NKA α1b subunit was not significantly increased until 10 d and decreased significantly later (Fig. 3C).
The fluctuations of the mRNA expression of Hsp 90 β stressed by the different salinity were very similar with those of NKA α1b subunit, but the change scopes were different (Fig. 4).
0.0 0.1 0.2 0.3 0.4 0.5 0.6 0.7
2 14 28 42
SG
R
(%
/d
ay
)
salinity (psu)
a
b
ab
54 Effects of Salinity on Growth, Feeding and the mRNA Expression of Na+/K+-ATPase and HSP 90 in Liza haematocheila
Figure 2 . Effects of salinity on the FR of L. haematocheilus, the results are shown as the number of Artemia nauplius fed by one fish in one minute. The different superscripts of the same row values are significantly different (P < 0.05).
0 20 40 60 80 100 120 140
2 14 28 42
FR
(T
he
n
um
be
r o
f A
rte
m
ia
)
Salinity (PSU) 10
20 30
a a a a a
c
b
b a
c
b b
0
5 10 15 20 25 30 35
0 5 10 20 30
T
he
r
el
at
iv
e
ex
pre
ss
io
n o
f N
K
A
Treatment time (days)
a
ab ab
b c
a
0
5 10 15 20 25 30 35 40
0 5 10 20 30
T
he
r
el
at
iv
e
ex
pre
ss
io
n o
f N
K
A
Treatment time (days)
a
b
b b
b b
Environment and Ecology Research 3(3): 51-59, 2015 55
Figure 3. NKA mRNA expression in L. haematocheilus stressed by 2 psu (A), 14 psu (B), 28 psu (C) and 42 psu (D) at 0, 5, 10, 20 and 30 d, respectively. Data are expressed as mean ± SD. Different letters indicate significant differences among groups (one way ANOVA, P<0.05).
0 5 10 15 20 25 30 35 40 45
0 5 10 20 30
T
he
r
el
at
iv
e
ex
pr
es
si
on
o
f N
K
A
Treatment time (days)
a
a ab
b c
c
0 10 20 30 40 50 60
0 5 10 20 30
T
he
r
el
at
iv
e
ex
pre
ss
io
n o
f N
K
A
Treatment time (days)
a
b
ab
ab ab
d
0 0.5 1 1.5 2 2.5 3 3.5 4 4.5 5
0 5 10 20 30
T
he
r
el
at
iv
e e
xp
re
ss
io
n o
f H
SP
9
0
Treatment time (days)
a
ab ab
b
b a
56 Effects of Salinity on Growth, Feeding and the mRNA Expression of Na+/K+-ATPase and HSP 90 in Liza haematocheila
Figure 4. Hsp 90 mRNA expression in L. haematocheilus stressed by 2 psu (A), 14 psu (B), 28 psu (C) and 42 psu (D) at 0, 5, 10, 20 and 30 d, respectively. Data are expressed as mean ± SD. Different letters indicate significant differences among groups (one way ANOVA, P<0.05).
4. Discussion
Fish growth is affected by many ecological factors, such as salinity, temperature, light, etc. Among them, salinity is a key factor in controlling growth [2, 28]. The effects of salinity on the growing capacities in fishes have been studied widely, and most species grow optimally between 5 and 18 psu[2]. [4] found that the optimum range of salinity for
6-d-old to 20-d-old Argyrosomus japonicus larvae was 5-12.5 psu. [3] have reported that BW-acclimated fish (sea bream Sparus aurata, 20 g mean body weight) showed a better growth with respect to SW- or LSW-acclimated fish (12 psu > 38 psu > 6 psu). The similar results was found in the present study: SGR of L. haematocheilus was better in intermediate salinity (14 psu) than other groups (14 > 28 > 42 > 2 psu) during 30 days (Fig. 1). In contrast, other studies
0 1 2 3 4 5 6 7
0 5 10 20 30
T
he
r
el
at
iv
e e
xp
re
ss
io
n o
f H
SP
9
0
Treatment time (days) a
b b b b
b
0 1 2 3 4 5 6
0 5 10 20 30
T
he
r
el
at
iv
e e
xp
re
ss
io
n o
f H
SP
9
0
Treatment time (days) a
ab
b c
c c
0 1 2 3 4 5 6 7 8
0 5 10 20 30
T
he
r
el
at
iv
e e
xp
re
ss
io
n o
f H
SP
9
0
Treatment time (days) a
b
b b b
have shown that salinity did not affect fish growth significantly. [29] found that salinity did not affect the growth of A. japonicas juvenile, the size of individuals was 9.4 g weight and the salinity treatments was 5-45 psu. [30] have found that there were no differences in growth of rabbitfish Siganus rivulatus in all treatment (10-25 psu, the size of individuals were 7.4 g). [31] have reported that there were no significant differences in somatic growth rate in European flounder (Platichthys flesus) when stressed by the different salinities (0-30 psu, post larvae). The different SGR in fishes are related to duration of experiment and/or the developmental stage of the same fish [2]. The earlier developmental stage such as larvae which SGR was higher in brackish water and the larger fish (>6.0 g/fish) showed no significant difference in growth when exposed to the different salinities [4, 29]. Therefore, further experiment about osmotic analysis and a range of temperature regimes at different salinity exposure were needed to test this hypothesis in different developmental stages of L. haematocheilus.
In the present study, the effect of salinity on the FR was significantly different in each group at 20 d and 30 d (p < 0.05); the FR of 14 psu group was significant higher than those of other groups (Fig. 2). The FR was also significantly affected by salinity in gray snapper Lutjanus griseus (p < 0.05) [32]. Based on the results of the FR and SGR, the lowest and highest values of the FR and SGR were 2 and 14 psu respectively. Therefore, our results also support the hypothesis that the energy costs of osmoregulation were lowest in isotonic medium and that the energy savings were sufficient to result in increased growth from the index of the FR.
The gene expression of NKA α1b and Hsp 90 β in response to salinity changes was also studied in the present study. We used the juveniles in the salinity stressed experiments. During the life of L. haematocheilus in Yangtze River estuary, the natural high salinity usually occurs at April, and the fish size is small at this time. So we chose juvenile to do salinity experiment in order to make it more close to the actual situation. The different tissues of the fish such as the gill, heart, liver and kidney are difficult to isolate at this stage. The whole fish were used to extract RNA, so the detected expression can reflect the actual situation of the whole fish. In addition, some genes expression (Hsp 90 β mRNA transcript) was fund in the different tissues such as gill, heart, muscle, brain, liver and kidney [33].
Euryhaline fish have the capacity to adapt to different environmental salinities by activating their osmoregulatory system and some relative gene expression such as NKA [19-20, 34]. Previous papers described two major salinity-induced gill NKA responses: the “higher-NKA-in-hyperosmotic media” response, i.e., the NKA expression was increased after transfer to hyperosmotic environments, has been observed such as FW-residing euryhaline fishes and diadromous fishes. On the other hand, the “higher-NKA-in-hyposmotic media” response, the NKA expression were increased after transfer
to hyposmotic environments, has been observed such as BW- or SW-residing euryhaline fishes [1, 10]. For example, the NKA mRNA expression was increased in the gill of the euryhaline milkfish Chanos chanos from seawater transfer to freshwater after 24 h [10] and the similar result was observed in black porgy Acanthopagrus schelgeli [35]. In Oryzias latipes and O. dancena, whose primary natural habitats are FW and BW environments, respectively, the gill NKA mRNA abundance of the SW-acclimated O. latipes was significantly higher than FW- and BW- acclimated individuals. However, the gill NKA mRNA abundance of the FW-acclimated O. dancena was significantly higher than BW- and SW- acclimated individuals [1]. The two salinity-induced NKA responses are based on the fishes transfer from SW/BW to FW or transfer from FW to SW/BW. Nevertheless, in the present study, the control group salinity was 28 psu, because the test was in April and this season is the drought period in Yangtze River and the salinity is higher in estuary and adjacent waters, L. haematocheilus were transfered to the hyposaline groups (2 and 14 psu) and hypersaline group (42 psu). The mRNA expression of NKA α1b subunit were increased significantly at 5 d stressed in 2, 14 and 42 psu groups (P < 0.05), which “U-shaped” salinity dependence of the NKA expression was different from the above two major salinity-induced NKA responses. Teleosts with “U-shaped” regulation of gill NKA activity or mRNA have been observed in some other euryhaline species, such as,
Dicentrarchus labrax [19] and Fundulus heteroclitus[20]. A “U-shaped” salinity dependence of the NKA expression may be energetically favorable for the fishes, since they ensure that the fishes may maintain a relatively low NKA expression for most of the life stage [19]. In a word, the discrepancy in NKA responses upon salinity challenge between the hypo- or hyperosmotic environment may relate to suggestion that higher NKA mRNA expression may be required to maintain a favorable Na+ gradient across the apical membrane.
58 Effects of Salinity on Growth, Feeding and the mRNA Expression of Na+/K+-ATPase and HSP 90 in Liza haematocheila
were increased significantly at 5 d when L. haematocheilus
were transfered from SW (28 psu) to the BW (2 and 14 psu) or HSSW (42 psu) (P < 0.05). Therefore, whatever fishes were transferred from SW to FW (hypoosmotic stress) or FW to SW (hyperosmotic stress), for the majority of euryhaline teleosts, the relative gene expression (NKA α1b or Hsp 90 β) will be increased. Of course, in view of different experimental time, different fish size, and different species, there are different results, for instance, the abundance of Hsp 90 mRNA transcript remained unchanged in gill, heart, muscle, brain, liver and kidney of chinook salmon (Oncorhynchus tshawytscha) that were transferred from FW to SW[33].
Fish in an isotonic medium have the lowest standard metabolic rates and the energetic cost of osmoregulation is lower [2], which may be the result of natural selection. While the isosmotic point was not measured in the present study and the SGR was highest in 14 psu group, which may be isosmotic condition in L. haematocheilus. But the lowest gene expression level emerged in 28 psu at 5 d, so we could not make sure the lowest energetic cost of osmoregulation was at the isosmotic point or at control group (28 psu) of L. haematocheilus from gene expression levelperspective.
5. Conclusions
The results in the present study indicated that L. haematocheilus can survived in the different salinity environment. At the individual level, a better growth over a period of 30 d of young L. haematocheilus acclimated to 14 psu with respect to those acclimated to 2, 14, 28 and 42 psu (e.g. SGR and FR). At the gene expression level, the mRNA expression of NKA α1b subunit and Hsp 90 β in L. haematocheilus were increased significantly stressed by 2, 14 and 42 psu groups at 5 d (P < 0.05), and expression level in the control group (28 psu) was lower. Furthermore, according to the energetic cost theory, the lowest mRNA expressions of NKA α1b subunit and Hsp 90 β (at 28 psu) were not matched by the best SRG and FR (at 14 psu) in the present study. Therefore, further research is required to determine the effect of salinity on the relationship between growth and gene expression in the different domesticated salinity condition.
Acknowledgements
This research was supported by the National Basic Research Program of China (#2010CB429005). We thanked Houjian Huang for assistance with sample collection in this project.
REFERENCES
[1] C. K. Kang, S. C. Tsai, T. H. Lee, P. P. Hwang. Differential expression of branchial Na+/K+-ATPase of two medaka species, Oryzias latipes and Oryzias dancena, with different salinity tolerances acclimated to fresh water, brackish water and seawater. Comparative Biochemistry and Physiology Part A, Vol.151, 566-575, 2008.
[2] G. Boeuf, P. Payan. How should salinity influence fish growth? Comparative Biochemistry and Physiology Part C, Vol.130, 411-423, 2001.
[3] R. Laiz-Carrión, S. Sangiao-Alvarellos, J. M. Guzmán, M. P. Martín del Río, J. L. Soengas, M. Juan, J. M. Mancera. Growth performance of gilthead sea bream Sparus aurata in different osmotic conditions: Implications for osmoregulation and energy metabolism. Aquaculture, Vol.250, 849-861, 2005.
[4] D. S. Fielder, W. Bardsley. A preliminary study on the effects of salinity on growth and survival of mulloway Argyrosomus japonicus larvae and juveniles. Journal of the World Aquaculture Society, Vol.30, 380-387, 1999.
[5] L. A. Sampaio, A. Bianchini. Salinity effects on somoregulation and growth of the euryhaline flounder Paralichthys orbignyanus. Journal of Experimental Marine Biology and Ecology, Vol.269, 187-196, 2002.
[6] D. H. Evans, P. M. Piermarini, K. P. Choe. The multifunctional fish gill: dominant site of gas exchange, osmoregulation, acidbase regulation, and excretion of nitrogenous waste. Physiological Reviews, Vol.85,97-177, 2005.
[7] A. D. Ostrowski, W. O. Watanabe, F. P. Montgomery, T. C. Rezek, T. H. Shafer, J. A. Morris Jr. Effects of salinity and temperature on the growth, survival, whole body osmolality, and expression of Na+/K+ ATPase mRNA in red porgy (Pagrus pagrus) larvae. Aquaculture, Vol.314, 193-201,2011.
[8] W. S. Marshall, S. E. Bryson. Transport mechanisms of seawater teleost chloride cells: an inclusive model of a multifunctional cell. Comparative Biochemistry and Physiology Part A, Vol.119, 97-106, 1998.
[9] [9] W. S. Marshall. Na+, Cl- and Zn2+ Transport by Fish Gills: Retrospective Review and Prospective Synthesis. Journal of Experimental of Zoology, Vol.293, 264-283, 2002.
[10] Y. M. Lin, C. N. Chen, T. Yoshinaga, S. C. Tsai, I. D. Shen, T. H. Lee. Short-term effects of hyposmotic shock on Na+/K+-ATPase expression in gills of the euryhaline milkfish, Chanos chanos. Comparative Biochemistry and Physiology Part A Vol.143, 406-415, 2006.
[11] C. H. Lin, C. L. Huang, C. H. Yang, T. H. Lee., P. P. Hwang. Time-course changes in the expression of Na, K-ATPase and the morphometry of mitochondrion-rich cells in gills of euryhaline Tilapia (Oreochromis mossambicus) during freshwater acclimation.Journal of Experimental ZoologyPart A, Vol.301, 85-96, 2004.
[12] J. G. Richards, J. W. Semple, J. S. Bystriansky, P. M. Schulte. Na+/K+ ATPase α-isoform swithching in gills of rainbow trout (Oncorhychus mykiss) during salinity transfer. Journal of Experimental Biology, Vol.206, 4475-4486, 2003.
Osmoregulation and gene expression of Na+/K+ ATPase in families of Atlantic salmon (Salmo salar) smolts. Canadian journal of fisheries and aquatic sciences, Vol.62, 2661-2672, 2005.
[14] J. S. Bystriansky, J. G. Richards, P. M. Schulte, J. S. Ballantyne. Reciprocal expression of gill Na+/K+ ATPase α-subunit isoforms α1a and α1b during seawater acclimation of three salmonid fishes that vary in their salinity tolerance. Journal of Experimental Biology, Vol.209, 1848-1858, 2006. [15] T. O. Nilsen, L. O. E. Ebbesson, S. S. Madsen, S. D.
McCormick, E. Andersson, B. Th. Björnsson, P. Prunet, S. O. Stefansson. Differential expression of gill Na+, K+ -ATPase a- and b- subunits, Na+, K+ , 2Cl- cotransporter and CFTR anion channel in juvenile anadromous and landlocked Atlantic salmon Salmo salar. Journal of Experimental Biology, Vol.210, 2885-2896, 2007.
[16] S. S. Madsen, P. Kiilerich, C. K. Tipsmark. Multiplicity of expression of Na+, K+ -ATPase α-subunit isoforms in the gill of Atlantic salmon (Salmo salar): cellular localization and absolute quantification in response to salinity change. Journal of Experimental Biology, Vol.212, 78-88, 2009.
[17] S. D. McCormick, A. M. Regish, A. K. Christensen. Distinct freshwater and seawater isoforms of Na+/K+ ATPase in gill chloride cells of Atlantic salmon. Journal of Experimental Biology, Vol.212, 3994-4001, 2009.
[18] C. K. Tipsmark, J. P. Breves, A. P. Seale, D. T. Lerner, T. Hirano, E. G. Grau. Switching of Na+, K+ -ATPase isoforms by salinity and prolactin in the gill of a cichlid fish. Journal of Endocrinology, Vol. 209, 237-244, 2011.
[19] M. K. Jensen, S. S. Madsen, K. Kristiansen. Osmoregulation and salinity effects on the expression and activity of Na+, K+-ATPase in the gills of European sea bass, Dicentrarchus labrax (L.). Journal of Experimental of Zoology, Vol.282, 290-300, 1998.
[20] G. R. Scott, J. G. Richards, B. Forbush, P. Isenring, P. M. Schulte. Changes in gene expression in gills of the euryhaline killifish Fundulus heteroclitus after abrupt salinity transfer. American Journal of Physiology-Cell Physiology, Vol.287, C300-C309, 2004.
[21] N. Basu, A. E. Todgham, P. A. Ackerman, M. R. Bibeau, K. Nakano, P. M. Schulte, G. K. Iwama. Heat shock protein genes and their functional significance in fish. Gene, Vol.295, 173-183, 2002.
[22] E. E. Deane, N. Y. S. Woo. Advances and perspectives on the regulation and expression of piscine heat shock proteins. Reviews in Fish Biology and Fisheries, Vol.21, 153-185, 2002.
[23] C. W. Chang, C. S. Huang, W. N. Tzeng. Redescription of redlip mullet Chelon haematocheilus (Pisces: Mugilidae) with a key to mugilid fishes in Taiwan. Acta Zoologica Taiwanica, Vol.10, 35-40, 1999.
[24] B. S. Jin, C. Z. Fu, J. S. Zhong, B. Li, J. K. Chen, J. H. Wu. Fish utilization of a salt marsh intertidal creek in the Yangtze River estuary, China. Estuarine, Coastal and Shelf Science, Vol.73, 844-852, 2007.
[25] L. Cardona. Effects of salinity on the habitat selection and growth performance of Mediterranean flathead grey mullet Mugil cephalus (Osteichthyes, Mugilidae). Estuarine, Coastal
and Shelf Science,Vol.50, 727-737, 2000.
[26] L. I. Bulli, N. I. Kulikova.Adaptive capacity of larvae of the haarder Liza haematocheila (Mugilidae, Mugiliformes) under decreasing salinity of the environment. Journal of Ichthyology, Vol.46, No.7, 534-544, 2006.
[27] X. M. Zhu, X. D. Jiang, S. J. Li. Variations in feeding of Scylia serrata larvae in different developmental stages. Oceanologia et Limnologia Sinica, Vol.37, No.2, 125-131, 2006 (in Chinese with English abstract).
[28] G. Boeuf, P. Y. Le Bail. Does light have an influence on fish growth? Aquaculture, Vol.177, 129-152, 1999.
[29] G. J. Partridge, A. J. Lymbery. Effects of manganese on juvenile mulloway (Argyrosomus japonicus) cultured in water with varying salinity-Implications for inland mariculture. Aquaculture, Vol.290, 311-316, 2009.
[30] I. P. Saoud, S. Kreydiyyeh, A. Chalfoun, M. Fakih. Influence of salinity on survival, growth, plasma osmolality and gill Na+-K+-ATPase activity in the rabbitfish Siganus rivulatus. Journal of Experimental Marine Biology and Ecology, Vol.348,183-190, 2007.
[31] B. O'Neill, F. D. Raedemaecker, D. McGrath, D. Brophy. An experimental investigation of salinity effects on growth, development and condition in the European flounder (Platichthys flesus. L.). Journal of Experimental Marine Biology and Ecology, Vol.410, 39-44, 2011.
[32] M. J. Wuenschel, A. R. Jugovich, J. A. Hare. Effect of temperature and salinity on the energetics of juvenile gray snapper (Lutjanus griseus): implications for nursery habitat value. Journal of Experimental Marine Biology and Ecology, Vol.312, 333-347,2004.
[33] A. N. Palmisano, J. R. Winton. Dickhoff W W, Tissue-specific induction of hsp90 mRNA and plasma cortisol response in Chinook salmon following heat shock, seawater challenge, and handling challenge. Marine Biotechnology, Vol.2 329-338, 2000.
[34] S. Tomy, Y. M. Chang, Y. H. Chen, J. C. Cao, T. P. Wang, C. F. Chang. Salinity effects on the expression of osmoregulatory genes in the euryhaline black porgy Acanthopagrus schlegeli. General and Comparative Endocrinology, Vol.161, 123-132, 2009.
[35] C. Y. Choi, K. W. An. 2008 Cloning and expression of Na+/K+-ATPase and osmotic stress transcription factor 1 mRNA in black porgy, Acanthopagrus schlegeli during osmotic stress. Comparative Biochemistry and Physiology Part B, Vol.149, 91-100, 2008.
[36] E. E. Deane, S. P. Kelly, J. C. Y. Luk, N. Y. S. Woo. Chronic salinity adaptation modulates hepatic heat shock protein and insulin-like growth factor I expression in black sea bream. Marine Biotechnology, Vol.4, 193-205, 2002.
[37] F. Pan, J. M. Zarate, G. C. Trembla, T. M. Bradley. Cloning and characterization of salmon hsp90 cDNA: upregulation by thermal and hyperosmotic stress. Journal of Experimental Zoology, Vol.287,199-212, 2000.