Forfás, Wilton Park House, Wilton Place, Dublin 2. Tel: +353 (0)1 607 3000, Fax: +353 (0)1 607 3030, Website: www.forfas.ie
Survey of Research
and Development in the
Higher Education Sector 2004
Survey of Research and Development
in the Higher Education Sector 2004
S&T Indicators Unit
Prepared by:
Science and Technology Indicators Unit Alison Brereton
Foreword
Investment in science and technology (S&T), particularly in research and development (R&D) activities, is one of the key pillars of policy under the National Development Plan, which helps drive the Irish economy in its transition to become a more knowledge-driven economy with high value-added activities.
Forfás monitors expenditure and resources employed across the Irish economy in carrying out research and development activities. It regularly surveys all performing R&D sectors of the economy including the business sector, the higher education sector and also the government sector. This report focuses on the R&D activities performed within the higher education sector in the 2003/2004 academic year.
The higher education sector provides a national base of skills and knowledge through the more fundamental nature of its R&D and complements the research in business sector firms and public sector institutes which are usually more applied and developmental in their focus. The Governments vision for R&D states that “by 2010 Ireland will be internationally renowned for the excellence of its research and be at the forefront in generating and using new knowledge for economic and social progress, within an innovation driven culture”.
The population for this survey includes all universities, institutes of technology and the technology centres located in colleges and covers all fields of knowledge, not just science and technology. These data feed into wider OECD and Eurostat work as well as informing policymakers and practitioners of the state-of-play at a given point in time. The methodology and procedures followed in this survey are those recommended by the OCED in the Frascati Manual. Appendix 1 of this publication provides more methodological details.
If you require further information about this survey please contact:
Andrew Stockman
Science and Technology Indicators Unit Forfás
Wilton Park House Wilton Place Dublin 2 Ireland
Contents
Foreword
Content
Executive Summary 2
1. General trends in higher education R&D expenditure 6
2. HERD expenditure by fields of science 8
3. Sources of funding of HERD expenditure 10
4. Types of costs 13
5. Human resources dedicated to higher education research 15
6. Time-use of higher education researchers 19
7. International comparisons 21
Appendices
Appendix 1: Methodology 25
Appendix 2: Fields of science & technology 27
Appendix 3: Acronyms 29
Appendix 4: Detailed Irish tables 30
Appendix 5: Detailed international tables 34
Forfás Publications 2005 36
Functions of Forfás 37
Executive Summary
This report presents the results from the survey of research and development performed in the higher education sector (HERD) in Ireland in 2004. The higher education (HE) sector includes universities, institutes of technology and some other technology centres which perform R&D activities.
Over the past two years Ireland has made considerable progress towards closing the gap between R&D performance in the higher education sector and that of major competitors on the international stage. Ireland’s R&D vision states that “by 2010 Ireland will be internationally renowned for the excellence of its research and be at the forefront in generating and using new knowledge for economic and social progress, within an innovation driven culture”.
The main findings of the survey are as follows:
Trends in expenditure:
Higher education R&D expenditure in Ireland climbed to _491.7m in 2004 (academic year
2003/2004), an increase of 52.6% from the previous HERD total recorded in 2002.
There has been a 44% increase in real terms (stripping out inflationary effects), in research expenditure in the higher education sector from 2002 to 2004.
Research expenditure in the higher education sector, 1998 - 2004 (_m), current
and constant prices:
998 000 00 004
HERD current prices (_m) 203.7 238.1 322.3 491.7
HERD constant 2004 prices (_m) 253.6 276.3 340.9 491.7
Sources of funds:
The strong increases in HERD are due mainly to additional R&D funding through “direct” government spending initiatives such as Science Foundation Ireland and the Programme for Research in Third Level Institutes (PRTLI).
“Direct” government funding increased by 48% between 2002 and 2004, whilst “indirect” government funding (via HEA block grant) increased by 58% in real terms in the same period.
Sources of research funds, 2004 (_m):
Direct sources of funds Indirect
government
Total
Direct government
EU Foreign
sources
Irish business
Other & own
Total 0.9 30.0 0.4 .5 30.9 04.9 49.7
% of total 41% 6% 2% 3% 6% 42% 100%
% change 98-04 237% -27% 26% -25% 58% 91% 94%
3 Fields of science:
All fields of science saw increases in higher education R&D expenditure between 2002 and 2004. R&D spending on natural sciences in the higher education sector rose by 56% between 2002 and 2004 to total _191m (39% of total HERD).
Medical sciences R&D expenditure accounted for 18% of total HERD in 2004.
Share of total higher education R&D expenditure by field of science, 2002 and 2004:
Human resources:
The total number of researchers in the higher education sector rose by 51.1% on a full-time equivalence basis (FTE) between 2002 and 2004 to 4,152 FTE’s.
Total researchers in the HE sector (FTE), 1998 – 2004:
This increase was driven by a rise in the total headcount of R&D personnel and also by a rise in the time dedicated to research activities by personnel.
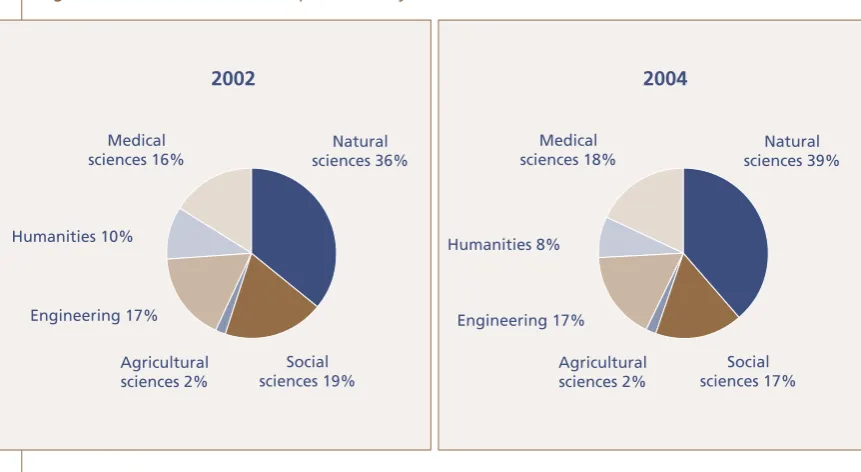
Natural sciences 36% Social sciences 19% Engineering 17% Agricultural sciences 2% Humanities 10% Medical sciences 16%
2002
Natural sciences 39% Social sciences 17% Engineering 17% Agricultural sciences 2% Humanities 8% Medical sciences 18%2004
£n Óäää ÓääÓ Óää{
4
Research personnel (FTE) by category of employment, 2004:
Academic staff Post-doctoral fellows Contract lecturers Research assistants Total researchers Technicians Admin staff Other staff Total research personnel
Total 1695 964 494 998 4152 385 251 53 4841
% Total 35% 20% 10% 21% 86% 8% 5% 1% 100%
Gender comparisons:
Males accounted for 59% of total research personnel in 2004, with females accounting for 41% of the total.
Females made up 37% of total researchers in 2004, although this figure is weighed down by the lower ratio of female staff employed as academic staff (29% of the total for this category of employment).
Research personnel (FTE) by category of employment and gender, 2004:
Academic staff Post-doctoral fellows Contract lecturers Research assistants Total researchers Technicians Admin staff Other staff Total research personnel
% Male 71% 57% 55% 53% 63% 63% 12% 55% 59%
% Female
29% 43% 45% 47% 37% 37% 88% 45% 41%
Time-use:
The average time spent on research by staff in the employment category ‘academic staff’ was 31.6% in 2004 (above the 31.1% average time recorded in 2002 and 25.7% recorded in 2000). These percentages are obtained by dividing the full time equivalents calculated (e.g. a single researcher dedicating 40% of their time to research is, 1 x 40%, 0.4 FTE) by the total headcount, giving a weighted average.
The average time spent by total researchers (totalling staff from the categories: ‘academic staff’, ‘contract lecturers’, ‘PhD fellows’ and ‘research assistants’) on research activities was 46.4% in 2004.
International comparisons:
The strong increases in HERD have allowed the HERD intensity ratio (higher education R&D expenditure divided by economic activity) to climb from 0.27% of GNP in 2000 to 0.40% in 2004. Significant progress has therefore been made in narrowing the HERD intensity ratio gap between Ireland and the EU25 average (0.43% of GDP).
5
Higher education expenditure on R&D (% economic activity), 1994 – 2004:
There were an estimated 2.2 researchers per thousand people in the Irish labour force in 2004 compared to 1.5 per thousand in 2002.
This strong performance has allowed Ireland’s international ranking to rise from 23rd out of 30 OECD countries in 2002 to 14th out of 30 in 2004.
Ó]äää Ó]xää Î]äää Î]xää {]äää {]xää
ä°Óä¯ ä°Óx¯ ä°Îä¯ ä°Îx¯ ä°{ä¯ ä°{x¯
£{
Ài>`Ê¯Ê * Ài>`ʯÊ* "ʯÊ*® 1ÊÓxʯÊ*®
1.
General trends in higher
education R&D expenditure
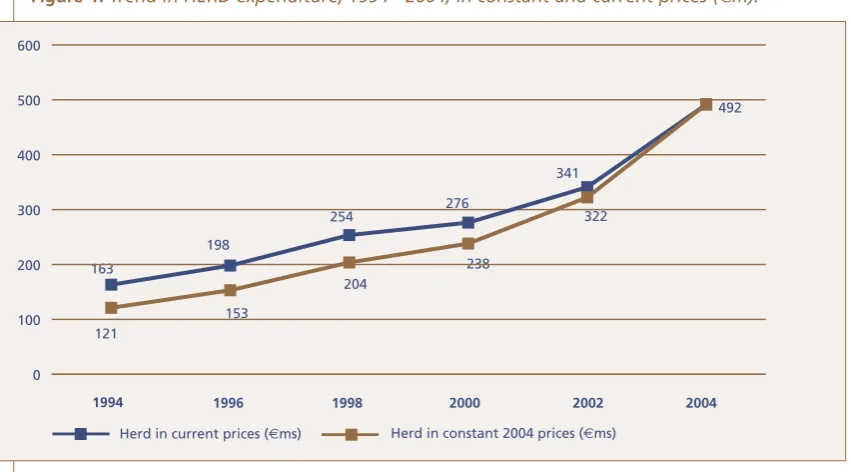
Total expenditure dedicated to research and development activities in the higher education sector (HERD) grew strongly from 2002 to 2004 to total _492 million. This increase in R&D spending was the largest ever recorded in nominal and real terms.
Figure 1 shows this expenditure in both nominal and real terms from 1994 to 2004. In nominal terms HERD increased by 52.8% between 2002 and 2004 (average annual increase of 23.5%).
In real terms HERD climbed by 44.3% between 2002 and 2004 (average annual increase of 20%). This compares to a weaker 23% real rise in the period 2000 to 2002, and an annual increase of 11%. Real or “constant” prices are used throughout this report as they remove inflationary effects from the data.
Figure : Trend in HERD expenditure, 1994 - 2004, in constant and current prices (_m).
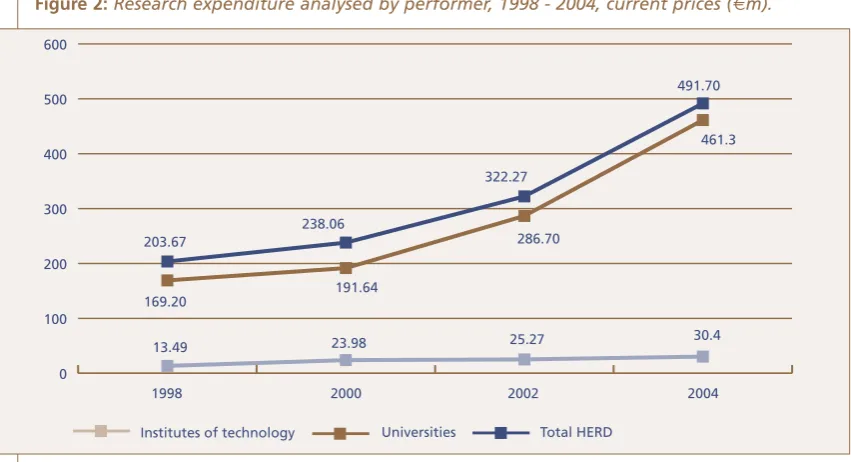
Figure 2 shows expenditure on R&D across the education sector broken down by type of institute. The universities remain the dominant performers of R&D across the higher education sector and continue to account for the majority of HERD. That said, there was a strong increase in the amount of expenditure dedicated to R&D activities across the institutes of technology between 2002 and 2004.
R&D activities performed by universities increased by nearly 61%, between 2002 and 2004, to stand at _461.3m. R&D expenditure in the institutes of technology climbed 20.3% in nominal terms in the same period to total _30.4m.
£{ £È £n Óäää ÓääÓ Óää{
ä £ää Óää Îää {ää xää Èää
ä £ää
£ÈÎ
£Ó£
£xÎ
Óä{
ÓÎn
ÎÓÓ £n
Óx{ ÓÇÈ
Î{£
{Ó
Óää Îää {ää xää Èää
[image:11.595.98.524.307.543.2]7
Figure : Research expenditure analysed by performer, 1998 - 2004, current prices (€m).
*Total HERD for 1998 to 2002 does not equal universities plus institutes of technology as there were additional amounts for the ‘Programme in Advanced Technology’ during this period.
The ratio of HERD to economic activity is a key indicator for international comparisons of higher education research activity. In Ireland, Gross Domestic Product (GDP) is greatly inflated because of transfer payments made by large foreign-owned firms here, and so the economic activity measure of Gross National Product (GNP) which excludes net factor flows is preferred when benchmarking international performance.
[image:12.595.96.522.73.304.2]Figure 3 charts HERD as a percentage of GNP and compares this to the EU average of HERD as a percentage of GDP. The EU average has increased from 0.41% of GDP in 2002 to an estimated 0.43% in 2004 while in Ireland the HERD has increased from 0.30% to 0.40% in the same period. The chart clearly shows the impact of the increased funding through the agencies, particularly from Science Foundation Ireland and the Higher Education Authority, between 2002 and 2004, resulting in major progress towards closing the HERD spending intensity gap between Ireland and the rest of the EU.
Figure 3: HERD as a percentage of economic activity, 1994 - 2004, Ireland vs EU.
£{ £È £n Óäää ÓääÓ Óää{
ä £ää Óää Îää {ää xää Èää ä £ää £È°Óä £Î°{
£n Óäää ÓääÓ Óää{
ÓäΰÈÇ
ÓÎn°äÈ
££°È{
Óΰn Óx°ÓÇ Îä°{
ÓnÈ°Çä ÎÓÓ°ÓÇ {£°Çä {È£°Î Óää Îää {ää xää Èää ä £ää Óää Îää {ää xää Èää ÃÌÌÕÌiÃÊvÊÌiV }Þ 1ÛiÀÃÌià /Ì>Ê,
£{ £È £n Óäää ÓääÓ Óää{
ä°Óä ä°Óx ä°Îä ä°Îx ä°{ä ä°{x ä°xä ä°Óä ä°Óx ä°Îä ä°Îx ä°{ä ä°{x ä°xä
ä°ÎÈ ä°ÎÈ ä°ÎÇ
ä°În ä°{£ ä°{Î ä°{ä ä°Îä ä°ÓÇ ä°Îä ä°Îä ä°Ó
£{ £È £n Óäää ÓääÓ Óää{
[image:12.595.93.524.520.747.2]8
2.
HERD expenditure by fields
of science
As well as measuring overall levels of higher education spending, it is useful to examine various research areas amongst which funds are divided. Data was gathered in the 2004 HERD survey at department level for each surveyed institute allowing classification of data into the various fields of science. Dividing overall spending into different areas allows closer examination of trends in key areas of research. In order to maintain comparability across member countries, the OECD have developed a classification structure for all HE research. There are six broad fields described as ‘Fields of Science’. They are natural sciences, engineering, social sciences, humanities, medical sciences and agricultural sciences.
[image:13.595.96.523.349.652.2]Expenditure is also collected by sub-fields within these fields of science categories. A more detailed breakdown of the expenditure by fields of science is available in Appendix 4. All of the broad fields of academic activity experienced real increases in expenditure over the period 1998 to 2004 (figure 4).
Figure 4: Higher education expenditure on R&D by field of science, 1998 - 2004, constant 2004 prices (_m).
The natural sciences field remains at the top with the highest R&D expenditure and the highest percentage change. Figure 4 shows a 56% increase to _191m in 2004 from _122.6m in 2002. This
compares with a 24% increase in the period 2000 to 2002.
Medical sciences experienced a continuation of their steady increase in R&D expenditure to
_86.7m in 2004 from _55.4m in 2002, up by 56% also.
Social sciences also experienced an increase in 2004 to _82.3m, a rise of 28% from 2002.
HERD expenditure rebounded strongly in the engineering field of science in 2004 having dipped in 2002. HERD totalled _82m in this area in 2004.
In addition to examining the overall changes in expenditure, the fields of science have also been analysed according to their share of total R&D expenditure (figure 5).
0 20 40 60 80 92.4 70.1 55.3 24.5 22.1 5.1 64.4 55.456.6 34.5 38.2 11.5 7.4 61.7 48.3 22.8 20.9 7.6 99.2 122.6 191.0 100 120 140 160 180 200
1998 2000 2002 2004
9
Figure 5: Share of total R&D expenditure by field of science, 2002 and 2004.
Overall the share of total R&D expenditure across the different fields of academic activity has remained relatively stable. The following are the key changes in the period 2002 to 2004:
Natural sciences maintain the largest share and experienced an increase from 36% to 39% of total HERD expenditure.
Medical sciences also increased from a 16% share to 18%.
Both social sciences and engineering hold a 17% share of expenditure in 2004. For the social sciences field this resulted from a drop from 19% in 2002.
Humanities experienced a decrease from 10% to 8% of overall expenditure.
Each field of science is further divided into sub-fields (see Appendix 4). Examining these classifications can give further insight into the changes in HERD expenditure.
Natural sciences: Biological sciences represent the largest percentage of HERD accounting for 16% in 2004 having experienced an increase of 73% to _77m in the period 2002 to 2004. Maths and
computer sciences doubled to over _42m and earth and related environmental sciences increased
by _10.6m to _16.9m. Physical sciences remained quite stable maintaining its 7% share through
2002 to 2004.
Medical sciences: All of the sub-fields of medical sciences saw a real increase. Though basic medicine experienced a decrease in its relative share from 12% in 2002 to 9% in 2004 there was a real increase of over _6m. Clinical medicine almost doubled while health sciences increased
fourfold.
Engineering: Expenditure on civil and electrical engineering experienced little change while the ‘other’ engineering sciences sub-field more than doubled between 2002 and 2004 to _49.7m.
Agricultural sciences: Both sub-fields maintained a 1% share of R&D expenditure from 2002 to 2004 though veterinary medicine doubled in real terms.
Humanities: Expenditure on R&D on the humanities remained relatively stable during the period 2002 to 2004.
0
3.
Sources of funding of HERD
expenditure
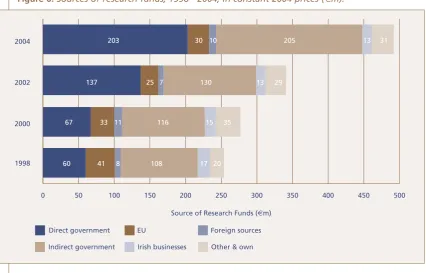
Research income in the Higher Education (HE) sector is provided from a number of different sources. These sources fall under the three main headings – direct government funding, indirect government funding (via the Higher Education Authority’s block grant) and other sources. Figure 6 shows the trends in sources of research income from 1998 to 2004. Total government funding (including direct and indirect sources) accounted for 83% of all research income in the higher education sector in 2004, increasing its funding share from the 79% recorded in 2002.
Figure : Sources of research funds, 1998 - 2004, in constant 2004 prices (_m).
Direct government funding of individual research projects in the higher education sector comes through various government departments and their agencies and totalled _203m in 2004. This represented a 48.2% increase from the survey carried out two years previously. Additional breakdowns of direct funding by government departments are given in figure 7.
Indirect sources of R&D funding are derived from the annual ‘block grant’ from the HEA. The HEA allocates funds to the universities, on behalf of the Department of Education and Science. An amount of this allocation is attributable to R&D and this is determined using estimates of the time spent on research by academic staff. This is standard OECD practice in all countries operating a dual system of higher education funding. These funds do not provide for incremental costs associated with individual projects. Indirect funding rose by 57% between 2002 and 2004. This increase was as a result of nominal increases in the block grant funding and also as a result of a higher research time-use co-efficient estimated by the survey.
Other sources of research income for the higher education sector include funding from the European Union, foreign sources, Irish businesses and other national funding (including internal funds). Other
ä xä £ää £xä Óää Óxä Îää Îxä {ää {xä xää £n
Óäää
ÓääÓ
Óää{
ä xä £ää £xä Óää Óxä
-ÕÀViÊvÊ,iÃi>ÀV ÊÕ`ÃÊ?®
Îää Îxä {ää {xä xää
ÀiVÌÊ}ÛiÀiÌ 1 Ài}ÊÃÕÀViÃ
`ÀiVÌÊ}ÛiÀiÌ Àà ÊLÕÃiÃÃià "Ì iÀÊEÊÜ
Óää{ ÓäÎ Îä £ä Óäx £Î Σ
ÓääÓ £ÎÇ Óx Ç £Îä £Î Ó
Óäää ÈÇ ÎÎ ££ ££È £x Îx
[image:15.595.96.523.253.526.2]
and own funding has risen in real terms by 58% from 1998 to 2002. European funding has fallen by 27% from 1998 to 2004, however, in the period 2002 to 2004 there was a real increase of 21% bringing funding up to _30.1m. There was a substantial drop in funding from Irish businesses of 25% between 1998 and 2002, from _16.6m to _12.5m. The figure of _12.5m was maintained from 2002 to 2004.
[image:16.595.96.532.249.575.2]Figure 7 shows the breakdown of this funding by the main sources. Science Foundation Ireland (SFI) was the largest state agency providing direct research funds in 2004, totalling _72m and 36% of total public research direct income. The HEA Programme for Research in Third Level Institutes (PRTLI) and Enterprise Ireland provided _37m and _36m in research income, respectively, in 2004. This data represents funding through the higher education institutes for the academic year rather than the calendar year used by the state institutes.
Figure 7: Sources of direct government research funding, 2004 (_m).
The overall research funding in the higher education sector provided by all sources can be further broken down by field of science. Table 1 charts this breakdown.
Direct source of research funds (?m)
0 10 20 30 40 50 60 70 80
IRCHSS
Other State funding 29.8
3.0
IRCSET 8.9
Health Research Board 14.7
Enterprise Ireland 35.7
PRTLI 36.7
Science Foundation Ireland 72.1
Table : Sources of research funding by fields of science, 2004 (_m).
Field of science Direct sources of funds Indirect
government
Total Direct
government
EU Foreign
sources
Irish business
Other & own
Agricultural sciences
4.2 0.2 0.1 0.0 0.4 6.6 11.5
Engineering & technology
38.9 10.5 0.8 5.6 3.4 22.8 82.0
Humanities 4.9 0.4 0.0 0.5 3.2 29.1 38.2
Medical sciences 37.5 1.9 4.0 2.0 9.1 32.2 86.7
Natural sciences 102.8 13.2 2.3 3.4 8.4 60.9 191.0
Social sciences 14.4 3.9 3.2 1.0 6.3 53.4 82.3
Total 0.9 30.0 0.4 .5 30.9 04.9 49.7
% of total 41% 6% 2% 3% 6% 42% 100%
% change 98-04 237% -27% 26% -25% 58% 91% 94%
% change 02-04 48% 21% 49% 0% 6% 58% 44%
[image:17.595.78.524.78.316.2]3
4.
Types of costs
The survey requires the completion by respondents of a detailed breakdown of their R&D expenditure by types of costs. This allows policymakers to analyse the key areas in which funding is taking place. There are three types of research costs identified within the survey – pay costs, non-pay costs and capital costs.
Table 2 and figure 8 show a time series of this distribution over the period 1998 to 2004 in constant prices.
Table : Distribution of types of costs, 1998 – 2004, in constant 2004 prices (_m).
Type of cost 998 000 00 004 % of
004 total
% change 98-04
% change 0-04
Pay costs 159.2 174.9 218.2 355.9 72% 124% 63%
Non-pay costs 76.5 71.7 88.3 106.0 22% 39% 20%
Capital costs 17.9 29.7 34.5 29.8 6% 66% -14%
Total 53. 7.3 34.0 49.7 00% 94% 44%
Figure 8: Distribution of types of costs, 1998 – 2004, in constant 2004 prices (_m).
Pay costs continue to represent the majority of total costs with an increase to _356m which
accounts for 72% of all costs in 2004 compared to 64% in 2002. This shows the increase in research personnel numbers and the accompanying increase in pay costs resulting from the additional funding. Human resources is dealt with in chapter 7.
Non-pay costs have also increased steadily to _106m in 2004. This shows a 39% increase compared
to 1998 though in the period 2002 to 2004 there was a lower increase of 20%.
Capital costs increased to 2002 but then dropped by 14% in the 2002 to 2004 period. However, there has been an overall increase of 66% from 1998 to 2004.
£n Óäää
Ý«i`ÌÕÀ
iÊ
?
ÓääÓ Óää{
ä xä £ää £xä Óää Óxä Îää Îxä {ää
ä xä £ää £xä Óää Óxä Îää Îxä {ää
[image:18.595.91.527.212.717.2]4
The costs can be further analysed by field of science, as shown in table 3.
Table 3: Types of costs by field of science, 2004 (_m).
HE Sector Pay
costs
% of Total
Non-pay costs
% of Total
Capital costs
% of Total
Total
Agricultural sciences 9.5 81% 2.0 17% 0.2 2% 11.6
Engineering & technology 57.2 70% 21.8 27% 3.1 4% 82.0
Humanities 34.7 89% 2.7 7% 1.4 4% 38.8
Medical sciences 59.2 69% 19.2 22% 7.4 9% 85.8
Natural sciences 127.7 67% 46.8 25% 15.4 8% 189.9
Social sciences 67.6 81% 13.6 16% 2.3 3% 83.5
Total 355.9 7% 0.0 % 9.8 % 49.7
Natural sciences have the highest allocation of pay costs at an amount of €127.7m though this
represents 67% of total expenditure in this field (the lowest percentage out of the 6 areas). It has a high percentage of non-pay and capital costs at 25% and 8% respectively.
The humanities have the highest percentage of pay costs as a % of total cost and hence the lowest percentage of non-pay.
5
5.
Human resources dedicated to
higher education research
In addition to gathering data on the expenditure, costs and sources of funding for higher education R&D, the survey also gathered data on the numbers of personnel involved in R&D. This area of the survey has become increasingly important as Ireland’s transition to a knowledge economy will depend heavily on the ability to attract increasing numbers of high quality researchers and research personnel. The Irish R&D action plan estimated that an additional 8,000 researchers would be required over the period 2003 to 2010 if efforts to reach the higher education and public sector expenditure targets of the plan are to be realised.
Table 4a shows a breakdown of the number of researchers by total headcount, which includes academic staff, post-doctoral fellows, contract lecturers and research assistants. Data on research support staff was also requested including technicians, administrative/clerical and other support staff. These are broken down in table 4b.
Table 4a: Total researchers analysed by performer, 2004, total headcount.
Academic staff
Post-doctoral
fellows
Contract lecturers
Research assistants
Total researchers
A B C D (A+B+C+D)
Institutes of technology 1863 36 203 141 2243
Universities 3509 959 1308 915 6691
Total 537 995 5 05 8933
Table 4b: Total research personnel analysed by performer, 2004, total headcount.
Total researchers
Technicians Admin
staff
Other staff
Total research personnel
E F G H (E+F+G+H)
Institutes of technology 2243 248 288 276 3054
Universities 6691 885 1303 243 9121
Grand Total 8933 33 590 59 75
Figure 9: Trend in total HERD researchers (FTE), 1998 – 2004.
*2002 data is revised.
[image:21.595.61.522.389.552.2]This information is further analysed by type of academic post held and also by field of science, as shown in Tables 5a and 5b.
Table 5a: Researchers by occupation and field of science in the HE sector, 2004 (FTEs).
Academic staff
Post-doctoral fellows
Contract lecturers
Research assistants
Total researchers
A B C D (A+B+C+D)
Agricultural sciences 35 11 3 29 78
Engineering & technology 291 157 42 215 705
Humanities 283 62 66 33 445
Medical sciences 231 183 95 171 680
Natural sciences 422 466 158 427 1473
Social sciences 433 84 130 124 770
Total 95 94 494 998 45
% of Total (from table 5b) 35% 20% 10% 21% 86%
Academic staff accounted for 35% of the total number of higher education researchers (FTE’s) in 2004, a drop from the 55% share recorded in the 2002 HERD survey.
The number of FTE post-doctoral fellows has tripled from 310 in 2002 to 964 in 2004.
The majority of researchers are in the field of natural sciences, increasing in number from 1,076 in 2002 to 1,473 in 2004.
The medical sciences have trebled their research personnel from 217 in 2002 to 680 in 2004.
Information was also gathered on the number of PhD students involved in research. This number has risen significantly from a full-time equivalent of 1,477 in 2002 to 3,644 in 2004. The main area of research is in the natural sciences, figure 10, (1,547 FTE PhD students). This field has more than twice the number of students involved in research than the next major area, engineering and technology.
£n Óäää ÓääÓ Óää{
Ó]äää
Ó]xää Ó]{Óx
Ó]£{n
Ó]Èx
{]£xÓ
Î]äää Î]xää {]äää {]xää
7
Figure 0: PhD students (FTE) by field of science, 2004.
[image:22.595.76.526.23.834.2]Total research personnel, including research support staff, have increased by 52% to 4,841 in 2004.
Table 5b: Total research personnel by occupation and field of science, 2004 (Full-Time Equivalent).
Total researchers
Technicians Admin staff Other staff Total
research personnel
E F G H (E+F+G+H)
Agricultural sciences 78 17 5 1 102
Engineering & technology 705 58 16 5 784
Humanities 445 4 13 6 468
Medical sciences 680 155 96 4 935
Natural sciences 1473 124 50 29 1676
Social sciences 770 26 70 9 876
Total 45 385 5 53 484
% Total 86% 8% 5% 1% 100%
Again, the majority of research personnel are in the field of natural science with over 35% of the total personnel working in this area.
A close examination of support staff shows that the majority (over 40%) of research related work by technicians is carried out in medical sciences with natural sciences at over 32%.
Natural sciences 1,547
Social sciences 559 Engineering &
technology 728
Agricultural sciences 11 Humanities 531
[image:22.595.94.523.85.302.2]8
All personnel data received were split between male and female to allow comparisons by gender. Tables 6a and 6b show the breakdown of personnel by occupation and by gender.
Table a: Researchers by gender and occupation in the HE Sector, 2004.
Academic staff
Post-doctoral fellows
Contract lecturers
Research assistants
Total researchers
% Male 71% 57% 55% 53% 63%
% Female 29% 43% 45% 47% 37%
Table b: Total research personnel by gender and occupation in the HE sector, 2004.
Total researchers
Technicians Admin staff Other staff Total research
personnel
% Male 63% 63% 12% 55% 59%
% Female 37% 37% 88% 45% 41%
The total research personnel breakdown shows that there are a greater number of men (59%) in research in comparison to women (41%). This represents a drop in the percentage of women in research from 45% in 2002.
9
.
Time-use of higher education
researchers
In the 2004 HERD survey, an additional question was asked for each academic department in each of the higher education institutions surveyed, to identify the amount of time spent on research activities by members of staff. The questionnaire set clear instructions and guidelines allowing heads of academic departments to complete this exercise in an equitable and comparable manner not only across Ireland but also internationally. The time-use variable is a key variable as it not only allows the conversion of personnel data from headcount to full-time equivalence, but it is also used to estimate the proportion of the HEA block grant dedicated to research.
Figure : Excerpt from the survey guidelines for completion of the questionnaire.
The following activities are deemed as “Research activities” for the purpose of this survey:
The following activities are not deemed as “Research activities” for the purpose of this survey:
Personal research
Team research
Writing research proposals
Writing research reports
Supervision of PhD students
Other research based activities including administration and planning
Teaching
General administration
Supervision of non-PhD students
Other non-research based activities
External activities
The research time percentage used for calculating full-time equivalents can be examined in greater detail, allowing us to determine which occupations and which fields of science are the most research intensive. The average time spent on research by academic staff alone increased from 31.1% in 2002 to 31.6% in 2004 while the time spent by researchers (academics, post-doctoral fellows, contract lecturers and research assistants) rose from 33.6% to 46.4% over the same period. Figures 12 and 13 examine time spent by academic staff only, across both institutes of technology and universities, by field of science for 2004. Figure 14 gives the breakdown for researchers by occupation and by field of science.
Figure : Average percentage of time spent on research by academic staff across universities by field of science, 2004.
[image:24.595.111.523.271.454.2] [image:24.595.96.524.599.809.2]0
Figure 3: Average percentage of time spent on research by academic staff across institutes of technology by field of science, 2004.
The institutes of technology show lower levels of time spent on research in comparison to universities; this is expected as the institutes of technology account for just over 6% of spending on R&D in the higher education sector.
Figure 4: Average percentage of time spent on research analysed by occupation and by field of science, 2004. ä¯ £ä¯ ί £{¯ £ä¯ n¯ £È¯ £Î¯ Óä¯ Îä¯ {ä¯ xä¯ Èä¯ -V> ÃViVià >ÌÕÀ> ÃViVià i`V> ÃViVià Õ>Ìià }iiÀ}ÊE ÌiV }Þ }ÀVÕÌÕÀ> ÃViViÃ ä £ä Óä Îä {ä xä Èä -V> ÃViVià >ÌÕÀ> ÃViVià i`V> ÃViVià Õ>Ìià }iiÀ}ÊE ÌiV }Þ }ÀVÕÌÕÀ> ÃViViÃ ä £ä Óä Îä {ä xä Èä Çä nä ä £ää -V>ÊÃViVià >ÌÕÀ>ÊÃViVià i`V>ÊÃViVià Õ>Ìià }iiÀ}ÊEÊÌiV }Þ }ÀVÕÌÕÀ>ÊÃViViÃ ä¯ £ä¯ Óä¯ Îä¯ {ä¯ xä¯ Èä¯ Çä¯ nä¯ ä¯ £ää¯ -V> ÃViVià >ÌÕÀ> ÃViVià i`V> ÃViVià Õ>Ìià }iiÀ}ÊE ÌiV }Þ }ÀVÕÌÕÀ> ÃViViÃ
[image:25.595.95.522.95.283.2] [image:25.595.96.527.338.797.2]
7.
International comparisons
In order to assess Ireland’s R&D performance and progress towards meeting the objectives set out in the Lisbon Agenda, it is useful to benchmark Ireland’s position compared to other OECD countries. Table 7 shows Ireland’s ranking over the period 2000 to 2004.
Table 7: Placement of Ireland in the international ranking of higher education sector R&D, 2000 - 2004.
000 00 004
Higher education expenditure on R&D (HERD) 238.1 322.3 491.7
HERD as a % of GNP 0.27% 0.31% 0.40%
- Ireland’s rank among 26 OECD countries 22nd 19th 16th
Total researchers in HE sector 2,148 2,695 4,152
Researchers per 1000 labour force 1.2 1.5 2.2
- Ireland’s rank among 30 OECD countries 24th 23rd 14th
Ireland’s spending on higher education R&D has more than doubled in the period 2000 to 2004 to
_492m (0.4% of GNP).
As a result of the increased spending, Ireland’s performance of R&D in the higher education sector has significantly improved over the last 4 years, moving from 22nd to 16th position in the ranking of 26 OECD countries.
The total researchers (FTE) in the Irish higher education sector has almost doubled over the same period to 4,152 resulting in a ratio of 2.2 researchers per 1,000 labour force. This positions Ireland 14th out of 30 OECD countries.
Figure 5: Higher education expenditure on R&D (% economic activity), 1994 – 2004.
Ó]äää Ó]xää Î]äää Î]xää {]äää {]xää
ä°Óä¯ ä°Óx¯ ä°Îä¯ ä°Îx¯ ä°{ä¯ ä°{x¯
£{
Ài>`Ê¯Ê * Ài>`ʯÊ* "ʯÊ*® 1ÊÓxʯÊ*®
[image:26.595.92.524.395.750.2]
Figures 16, 17 and 18 outline OECD data on higher education R&D performance across a range of countries.
Figure : HERD as a % of GDP (2004 or latest available data).
ä°ä ä°£ä ä°Óä ä°Îä ä°{ä ä°xä ä°Èä ä°Çä ä°nä ä°ä
1ÊÓx -Üi`i >>`> >` -ÜÌâiÀ>` Vi>` i>À ÕÃÌÀ> iÌ iÀ>`à ÀÜ>Þ ÕÃÌÀ>> 1Ìi`Ê-Ì>Ìià /ÕÀiÞ >«> iÀ>Þ i}Õ À>Vi 1Ìi`Ê}` Ài>`Ê *® Ì>Þ *ÀÌÕ}> -«> iÜÊ<i>>` ÀiiVi Ài> Õ}>ÀÞ âiV Ê,i«ÕLV *>` iÝV -Û>Ê,i«ÕLV ÕÝiLÕÀ} ä°{ÎÊ ä°nÎ ä°ÇÎ ä°ÈÇ ä°È{ ä°È£ ä°Èä ä°xÇ ä°xÓ ä°{n ä°{x ä°{{ ä°{Î ä°{Î ä°{Î ä°{Î ä°{Ó ä°{ä ä°{ä ä°În ä°Î{ ä°ÎÎ ä°ÎÎ ä°Ó ä°ÓÇ ä°Óx ä°£ ä°£n ä°£Ó ä°än ä°ä£
ä°ä ä°£ ä°Ó ä°Î ä°{ ä°x ä°È ä°Ç ä°n ä°
[image:27.595.68.573.128.752.2]3
Figure 7: HE researchers per thousand labour force (2004 or latest available data).
ä £ Ó Î { x È
1Óx >` ÕÃÌÀ>> iÜÊ<i>>` -Üi`i Vi>` i}Õ i>À ÀÜ>Þ >«> -ÜÌâiÀ>` -«> À>Vi *>` Ài>` >>`> -Û>Ê,i«ÕLV iÌ iÀ>`à ÀiiVi iÀ>Þ ÕÃÌÀ> 1Ìi`Ê}` *ÀÌÕ}> Õ}>ÀÞ 1Ìi`Ê-Ì>Ìià Ì>Þ Ài> âiV Ê,i«ÕLV /ÕÀiÞ iÝV ÕÝiLÕÀ}
ä £ Ó Î { x È
[image:28.595.74.562.103.722.2]4
Figure 8: Higher education sector: Women researchers as a percentage of total researchers (headcount).
ä £ä Óä Îä {ä xä Èä
-Üi`i iÜÊ<i>>` *ÀÌÕ}> >` -Û>Ê,i«ÕLV *>` ÀiiVi -«> ÀÜ>Þ /ÕÀiÞ Ài>` Õ}>ÀÞ Vi>` À>Vi âiV Ê,i«ÕLV i>À Ì>Þ ÕÃÌÀ> -ÜÌâiÀ>` >«> Ài>
ä £ä Óä Îä {ä xä Èä
5
Appendix 1: Methodology
Introduction
The survey was carried out following OECD/Frascati Manual (1993, 2002) guidelines for estimating levels of research and development in the higher education sector and the results for Ireland are comparable to those from other OECD countries. Data captured in the survey relates to the 2004 academic year (September 2003 to September 2004).
There were two elements to this survey of research and development in higher education colleges:
An analysis of financial data received from each institution;
An analysis of personnel data received from each institution. In addition, the 2004 HERD survey also asked each academic department to estimate the time spent on research per person employed.
Coverage
The coverage included all academic departments, in the seven universities*, eleven institutes of technology**, as well as the Dublin Institute of Technology, Royal College of Surgeons, St. Patrick’s College, Drumcondra and Mary Immaculate College.
*Universities: Dublin City University, NUI Galway, NUI Maynooth, University College Cork, University College Dublin, University of Dublin (Trinity College) and University of Limerick.
** Institutes of Technology (IT): Athlone IT, Carlow IT, Cork IT, Dundalk IT, Galway-Mayo IT, Letterkenny IT, Limerick IT, Sligo IT, Tallaght IT, Tralee IT and Waterford IT.
Timing of survey and subsequent follow-up
Questionnaires were sent out at the end of April 2005 to the various colleges. There was intensive follow-up of non-respondents by telephone from May 2005 until the end of August 2005. Final outstanding information was received in September 2005.
A full response rate was achieved for the financial and personnel parts of the survey. For the time use element of the survey all but one institute were able to complete the survey request and data was estimated and inputted for this institution by Forfás.
Financial data
Detailed departmental income and expenditure was obtained from the finance office in each university. Industrial liaison offices provided similar information for the institutes of technology.
This information comprised total capital and current expenditure from the colleges’ block grant for all departments, from which a research proportion was derived, based on the amount of research-time reported by the respondents.
Personnel data
Detailed departmental headcounts were obtained from the personnel offices, categorised by
academic staff, contract lecturers, post-doctoral fellows, research assistants, technicians, administrative and other staff. In order to calculate full-time equivalent totals for each category, the percentage of time spent on research was also obtained. In addition, the headcounts were split between male and female to allow gender comparisons.
Time-use data
Each academic department was also asked to estimate the time spent on research activities by each member of staff in his/her department. Strict guidelines and instructions were sent to each head of department outlining a single agreed methodology which identified comparable time spent on research activities. This methodology is the one recommended by the international OECD Frascati Manual.
The following matrix was used to determine the percentage of time spent on research activities by people employed in the higher education sector:
The following activities are deemed as “Research activities” for the purpose of this survey:
The following activities are not deemed as “Research activities” for the purpose of this survey:
Personal research
Team research
Writing research proposals
Writing research reports
Supervision of PhD students
Other research based activities including administration and planning
Teaching
General administration
Supervision of non-PhD students
Other non-research based activities
7
Appendix 2: Fields of science
& technology
. Natural sciences
. Mathematics and computer sciences
[Mathematics and other allied fields: computer sciences and other allied subjects (software development only; hardware development should be classified with the engineering fields)]
. Physical sciences
(Astronomy and space sciences, physics, other allied subjects)
.3 Chemical sciences
(Chemistry, other allied subjects)
.4 Earth and related environmental sciences
(Geology, geophysics, mineralogy, physical geography and other geosciences, meteorology and other atmospheric sciences including climatic research, oceanography, vulcanology, palaeoecology, other allied sciences)
.5 Biological sciences
(Biology, botany, bacteriology, microbiology, zoology, entomology, genetics, biochemistry, biophysics, other allied sciences excluding clinical and veterinary sciences)
. Engineering and technology
. Civil engineering
(Architecture engineering, building science and engineering, construction engineering, municipal and structural engineering and other allied subjects)
. Electrical engineering, electronics
[Electrical engineering, electronics, communication engineering and systems, computer engineering (hardware only) and other allied subjects]
.3 Other engineering sciences
(Such as chemical, aeronautical and space, mechanical, metallurgical and materials engineering, and their specialised subdivisions; forest products; applied sciences such as geodesy, industrial chemistry, etc.; the science and technology of food production; specialised technologies of interdisciplinary fields, e.g. systems analysis, metallurgy, mining, textile technology and other allied subjects)
3. Medical sciences
3. Basic medicine
(Anatomy, cytology, physiology, genetics, pharmacy, pharmacology, toxicology, immunology and immunohaematology, clinical chemistry, clinical microbiology, pathology)
3. Clinical medicine
(Anaesthesiology, paediatrics, obstetrics and gynaecology, internal medicine, surgery, dentistry, neurology, psychiatry, radiology, therapeutics, otorhinolaryngology, ophthalmology)
3.3 Health sciences
8 4. Agricultural sciences
4. Agriculture, forestry, fisheries and allied sciences
(Agronomy, animal husbandry, fisheries, forestry, horticulture, other allied subjects)
4. Veterinary medicine
5. Social sciences
5. Psychology
5. Economics
5.3 Educational sciences
(Education and training and other allied subjects)
5.4 Other social sciences
[Anthropology (social and cultural) and ethnology, demography, geography (human, economic and social), town and country planning, management, law, linguistics, political sciences, sociology, organisation and methods, miscellaneous social sciences and interdisciplinary, methodological and historical S&T activities relating to subjects in this group. Physical
anthropology, physical geography and psychophysiology should normally be classified with the natural sciences]
. Humanities
. History
(History, prehistory and history, together with auxiliary historical disciplines such as archaeology, numismatics, palaeography, genealogy, etc.)
. Languages and literature (Ancient and modern)
.3 Other humanities
[Philosophy (including the history of science and technology), arts, history of art, art criticism, painting, sculpture, musicology, dramatic art excluding artistic “research” of any kind, religion, theology, other fields and subjects pertaining to the humanities, methodological, historical and other S&T activities relating to the subjects in this group]
9
Appendix 3: Acronyms
EU European UnionFTE Full-time equivalent (1 FTE = R&D 40 hours per week)
GDP Gross Domestic Product
GNP Gross National Product
HE Higher Education
HEA Higher Education Authority
HERD Higher Education Expenditure on R&D
OECD Organisation for Economic Co-operation and Development
R&D Research and Development
30
Appendix 4: Detailed Irish tables
Table A4.: Expenditure by field of science, current prices.
Field of science 994 99 998 000 00 004
Natural sciences 52.8 55.9 74.2 85.5 115.9 191.0
Engineering 26.8 36.8 49.5 60.4 53.5 82.0
Medical sciences 12.7 13.0 16.8 19.1 52.4 86.7
Agricultural sciences 2.9 5.4 6.1 4.4 7.0 11.5
Social sciences 16.0 27.7 38.7 47.6 60.8 82.3
Humanities 9.8 14.3 18.3 21.1 32.6 38.2
Total . 53. 03.7 38. 3.3 49.7
Table A4.: Expenditure by field of science, constant 2004 prices.
Field of science 994 99 998 000 00 004
Natural sciences 71.2 72.4 92.4 99.2 122.6 191.0
Engineering 36.2 47.6 61.7 70.1 56.6 82.0
Medical sciences 17.1 16.8 20.9 22.1 55.4 86.7
Agricultural sciences 4.0 7.0 7.6 5.1 7.4 11.5
Social sciences 21.6 35.9 48.3 55.3 64.4 82.3
Humanities 13.2 18.5 22.8 24.5 34.5 38.2
[image:35.595.98.523.206.812.2]3
Table A4.3: Expenditure by source of funds and field of science, 2004.
Field of science HEA
indirect funds
_’000
Direct gov
_’000
European Union
_’000
Other foreign sources
_’000
Irish industry
funded
_’000
Other & own
_’000
Total
_’000
Mathematics and computer sciences
15,942 21,320 1,666 163 660 2,476 42,226
Physical sciences 6,980 21,491 4,631 312 292 590 34,295
Chemical sciences 8,237 9,425 932 76 912 782 20,364
Earth and related environmental sciences
3,874 9,501 1,768 354 267 1,159 16,923
Biological sciences 25,835 41,089 4,220 1,418 1,243 3,410 77,215
Civil engineering 4,113 2,500 1,043 7 750 415 8,828
Electrical engineering, electronics
7,601 11,575 3,095 50 509 664 23,494
Other engineering sciences
11,099 24,875 6,343 730 4,338 2,310 49,694
Basic medicine 15,542 24,666 914 2,305 1,351 1,753 46,531
Clinical medicine 7,981 8,446 828 1,603 199 3,234 22,292
Health sciences 8,630 4,420 155 49 498 4,123 17,875
Agriculture, forestry, fisheries and allied sciences
2,923 2,310 138 9 176 5,555
Veterinary medicine 3,636 1,884 39 102 238 5,899
Psychology 6,986 1,412 1,055 59 49 729 10,291
Economics 4,649 311 37 64 212 5,273
Educational sciences 9,652 3,523 749 77 2,082 16,084
Other social sciences 32,158 9,164 2,020 3,181 853 3,306 50,681
History 5,487 1,158 124 943 7,712
Languages and literature 17,272 1,192 199 13 322 2,047 21,046
Other humanities 6,336 2,600 89 151 244 9,420
3
Table A4.4: Expenditure by type of costs and field of science, 2004.
Field of science Pay
_‘000
Non-pay current
_’000
Capital expenditure
_’000
Total
_’000
Mathematics and computer sciences 30,747 8,147 975 39,869
Physical sciences 19,868 9,967 4,164 33,998
Chemical sciences 14,904 3,929 1,259 20,093
Earth and related environmental sciences 10,832 4,266 2,349 17,447
Biological sciences 50,747 19,012 6,569 76,328
Civil engineering 5,523 1,449 32 7,005
Electrical engineering, electronics 16,608 4,060 915 21,583
Other engineering sciences 32,967 15,903 2,077 50,947
Basic medicine 29,681 11,474 5,983 47,138
Clinical medicine 14,132 4,561 1,168 19,861
Health sciences 13,782 3,198 243 17,223
Agriculture, forestry, fisheries and allied sciences 4,306 819 96 5,221
Veterinary medicine 4,714 1,129 99 5,942
Psychology 9,079 1,129 72 10,280
Economics 5,408 283 35 5,726
Educational sciences 12,378 3,280 87 15,745
Other social sciences 38,961 8,202 1,844 49,007
History 7,194 735 18 7,947
Languages and literature 20,044 1,279 111 21,434
Other humanities 7,155 421 18 7,594
Other 6,841 2,760 1,708 11,310
33
Table A4.5: R&D personnel (full-time equivalent) by field of science, 2004.
Field of science Academic
staff
Post-doctoral
fellows
Contract lecturers
Research assistants
Technicians Admin
staff
Other staff
Total FTE
Mathematics and computer sciences
162 78 68 69 8 10 4 398
Physical sciences 64 75 27 89 21 11 2 288
Chemical sciences 62 80 12 37 19 5 2 217
Earth and related environmental sciences
28 30 5 20 8 4 4 99
Biological sciences 106 204 47 211 68 17 17 671
Civil engineering 36 8 10 16 8 2 1 80
Electrical engineering, electronics
69 39 7 40 13 2 3 172
Other engineering sciences
185 111 25 155 38 8 2 523
Basic medicine 67 100 21 39 97 24 3 350
Clinical medicine 71 55 34 47 13 16 1 237
Health sciences 87 8 28 44 5 30 1 203
Agriculture, forestry, fisheries and allied sciences
21 6 0 9 7 1 0 44
Veterinary medicine
15 5 3 20 10 1 0 54
Psychology 27 17 10 17 3 4 0 78
Economics 41 7 18 10 0 1 0 77
Educational sciences
71 3 9 14 21 15 3 137
Other social sciences
292 57 93 83 2 36 4 565
History 53 21 9 15 1 3 0 103
Languages and literature
162 23 44 7 3 7 2 247
Other humanities 67 18 13 11 0 2 3 115
Other 11 20 11 47 41 51 3 183
34
Appendix 5: Detailed
international tables
Table A5.: HERD as a percentage of GDP, 2000 – 2004.
000 00 004
(or latest available data)
Value (%) Rank Value (%) Rank Value (%) Rank
Australia 0.42 10 0.45 9 0.45 9
Belgium 0.41 12 0.43 13 0.43 13
Canada 0.55 4 0.65 3 0.73 2
Czech Republic 0.18 25 0.19 25 0.19 24
Denmark 0.45 8 0.58 5 0.6 6
Finland 0.61 2 0.66 2 0.67 3
France 0.41 12 0.43 13 0.42 14
Germany 0.4 13 0.43 13 0.43 13
Greece 0.33 18 0.29 21 0.29 21
Hungary 0.19 24 0.26 23 0.25 23
Iceland 0.45 8 0.5 7 0.61 5
Ireland (GNP) 0.27 22 0.31 19 0.4 16
Italy 0.33 18 0.38 16 0.38 17
Japan 0.43 9 0.43 13 0.43 13
Korea 0.27 21 0.26 23 0.27 22
Netherlands 0.53 5 0.52 6 0.52 7
New Zealand 0.35 16 0.35 17 0.33 20
Norway 0.47 6 0.45 9 0.48 8
Poland 0.21 23 0.2 24 0.18 25
Portugal 0.3 19 0.34 18 0.34 18
Slovak Republic 0.06 26 0.05 26 0.08 26
Spain 0.28 20 0.31 20 0.33 20
Sweden 0.81 1 0.83 1 0.83 1
Switzerland 0.59 3 0.64 4 0.64 4
United Kingdom 0.38 14 0.42 15 0.4 16
United States 0.37 15 0.42 15 0.44 10
EU 25 Average 0.38 - 0.41 - 0.43* OECD Average 0.38 - 0.41 - 0.43**
[image:39.595.77.519.170.643.2]35
Table A5.: HE researchers per thousand labour force, 2000 – 2004.
2000 2002 2004
Value Rank Value Rank Value Rank
Australia 4.1 2 4.3 3 4.2 3
Austria 1.5 21 1.8 19 1.7 21
Belgium 2.7 5 2.8 6 2.8 6
Canada 2.1 13 2.1 14 2.0 16
Czech Republic 0.7 28 0.8 27 0.8 27
Denmark 2.0 15 2.6 8 2.7 7
Finland 4.2 1 4.7 1 5.0 1
France 2.3 11 2.4 12 2.3 13
Germany 1.7 19 1.8 19 1.8 19
Greece 2.3 11 1.9 16 1.9 18
Hungary 1.4 22 1.5 23 1.4 23
Iceland 3.0 4 3.2 5 3.2 5
Ireland 1.2 24 1.5 23 2.2 14
Italy 1.1 26 1.2 25 1.2 25
Japan 2.6 7 2.5 10 2.6 11
Korea 1.1 26 1.1 26 1.1 26
Luxembourg 0.1 30 0.1 30 0.1 30
Mexico 0.3 29 0.3 29 0.3 29
Netherlands 1.9 17 1.9 16 1.9 18
New Zealand 2.6 7 4.4 2 4.2 3
Norway 2.3 11 2.4 12 2.6 11
Poland 2.0 15 2.2 13 2.3 13
Portugal 1.6 20 1.7 20 1.6 22
Slovak Republic 1.9 17 1.8 19 2.0 16
Spain 2.3 11 2.5 10 2.6 11
Sweden 3.3 3 3.5 4 3.5 4
Switzerland 2.2 12 2.6 8 2.6 11
Turkey 0.7 28 0.7 28 0.7 28
United Kingdom 1.7 19 1.6 21 1.7 21
United States 1.3 23 1.3 24 1.2 25
-3
Forfás Publications 2005
From Research to the Marketplace –
Patent Registration and Technology Transfer in Ireland (web only)
March 2005
Making Technological Knowledge Work – A Study of the Absorptive Capacity of Irish SMEs
March 2005
Strategic Technology Platforms
Irish Council for Science, Technology and Innovation
March 2005
Towards the Seventh EU Framework Programme for Research and Technological Development
Irish Council for Science, Technology and Innovation
March 2005
International Trade & Investment Report, 004 April 2005
An Impact Assessment of the Proposed EU Chemical Policy (REACH) on Irish Industry
April 2005
Annual Employment Survey, 004 April 2005
Make Consumers Count: A New Direction for Irish Consumers Report of the Consumer Strategy Group
May 2005
Business Expenditure on Research & Development (BERD) Ireland 003/004 May 2005
Languages and Enterprise –
The Demand & Supply of Foreign Language Skills in the Enterprise Sector Expert Group on Future Skills Needs
June 2005
Annual Report 004 June 2005
Annual Competitiveness Report National Competitiveness Council
September 2005
Economic Consequences of the Doha Round For Ireland September 2005
Skills Needs in the Irish Economy: The Role of Migration Expert Group on Future Skills Needs
October 2005
National Skills Bulletin
Expert Group on Future Skills Needs
October 2005
Competitiveness Challenge National Competitiveness Council
November 2005
National Code of Practice for Managing and Commercialising Intellectual Property from Public-Private Collaborative Research
Advisory Council for Science Technology and Innovation
November 2005
Benchmarking Ireland’s Broadband Performance December 2005
Data Analysis of In-Employment Education and Training in Ireland Expert Group on Future Skills Needs
December 2005
Science Foundation Ireland: The First Years 00-005 Report of an International Evaluation Panel
December 2005
37
Functions of Forfás
Forfás is the national policy and advisory board for enterprise, trade, science, technology and
innovation. It is the body in which the State’s legal powers for industrial promotion and technological development have been vested. It is also the body through which powers are delegated to Enterprise Ireland for the promotion of indigenous industry and to IDA Ireland for the promotion of inward investment.Science Foundation Ireland was established as a third agency of Forfás in July 2003. The broad functions of Forfás are to:
advise the Minister on matters relating to the development of industry in the State
advise on the development and co-ordination of policy for Enterprise Ireland, IDA Ireland, Science Foundation Ireland and such other bodies (established or under statute) as the Minister may by order designate
encourage the development of industry, science and technology, innovation, marketing and human resources in the State
encourage the establishment and development in the State of industrial undertakings from outside the State, and
advise and co-ordinate Enterprise Ireland, IDA Ireland and Science Foundation Ireland in relation to their functions.
Is é Forfás an bord náisiúnta um polasaí agus comhairle le haghaidh fiontraíochta, trádála, eolaíochta, teicneolaíochta agus nuála. Is é an comhlacht é a bhfuil comhactaí dlíthiúla an stáit maidir le cur-chun cinn tionscail agus forbairtteicneolaíochta dílsithe ann. Is é an comhlacht é freisin trína dtiomnaítear cumhachtaí ar Fhiontraíocht Éireann le tionscail dúchais a chur chun cinn agus ar ghníomhaireacht Forbartha Tionscail na hÉireann (GFT Éireann) le hinfheistíocht isteach sa tir a chur chun tosaigh. Bunaíodh Fondúireacht Eolaíochta Éireann mar an treas eagraíocht de chuid i Forfás mí Iúil 2003. Is iad feighmeanna Fhorfáis:
comhairle a chur ar an Aire ó thaobh cúrsaí a bhaineann le forbairt tionscail sa Stát
comhairle maidir le forbairt agus comhordú polasaithe a chur ar fáil d’Fhiontraíocht Éireann, d’GFT Éireann, Fondúireacht Eolaíochta Éireann agus d’aon fhoras eile dá leithéid (a bunaíodh go reachtúil) a d’fhéadfadh an tAire a ainmniú trí ordú
forbairt na tionsclaíochta, na teicneolaíochta, na margaíochta agus acmhainní daonna a spreagadh sa Stát
bunú agus forbairt gnóthas tionsclaíoch ón iasacht a spreagadh sa Stát, agus
38
Board Members
Eoin O’Driscoll, Chairman Managing Director, Aderra
Martin Cronin Chief Executive, Forfás
Sean Dorgan
Chief Executive, IDA Ireland
Sean Gorman
Secretary General, Department of Enterprise, Trade and Employment
Dr William Harris
Director General, Science Foundation Ireland
Prof. Michael Hillery
Emeritus Professor of Engineering, University of Limerick
Dr Rosheen McGuckian
Chief Executive Officer, GE Money
Rody Molloy Director General, FÁS
William Murphy
Partner, Tynan Dillon and Company
Feargal O’Rourke
Partner, Taxation, PricewaterhouseCoopers
Frank Ryan
Chief Executive, Enterprise Ireland
Dr Don Thornhill
Chairman, National Competitiveness Council
Jane Williams
Forfás, Wilton Park House, Wilton Place, Dublin 2. Tel: +353 (0)1 607 3000, Fax: +353 (0)1 607 3030, Website: www.forfas.ie