METEOROLOGICAL SERVICE
SOLAR RADIATION OBSERVATIONS 1979
U.D.C.
551. 506.3 551. 521.12(419.61DUBLIN
1982
Price;
£
\·75>
;
CONTENTS
SOLAR RADIATIOS 03SERVATIOSS AT VA~IA ODSERVATO~Y 1. Introduction
2. ~ite of Observatory
3. Meas~rement of Global ~olar Radiation
4. Measurement of Diffuse Solar Radiation 5. Measurement of Direct Sun Radiation
6. Measurement of Long-Wave (Infra-Red) Radiation 7. Direct Sun Observations
8. Radiation Balance
Figure 1 Map showing site and its environs Figure 2 General layout
Figure 3 EXposure diagram showing Azimuth and Elevation of all objects which obscure the pyranometers at Valentia together with Azimuth and Elevation of the sun at different times of the year
SOLAR RADIATIO~ 09SERVATIONS AT KILKE~NY METE010LOGIC\L STATIO~ 1. Introduction
2. Site of Observations
3. Measurement of Global Solar Radiation 4. Measurement of Diffuse Solar Radiation Figure 4 Map showing site
Figure 5 Layout of buildings and instru~ents
Figure G EXposure diagra~ showing Azimuth and Elevation of all objects "'hich obscure the Pyrano"eters at Kilkenny together with Azimuth and Elevation of the sun at different times of the year
SOLAR RADIATIO~ OBSERVATI= AT BIRR METErnOLOGICAL STATIO'J 1. Introduction
2. SIte of ObservatIons
3. Measurement of Global Solar Radiation 4. Measurement of Diffuse Solar Radiation Figure 7 Map showing site
Figure 8 Layout of buIldings and instruments
Figure 9 EXposure diagram sho~ing Azimuth and Elevation of all objects which obscure the pyranometers at Birr
together with Azimuth and Elevation of the sun at different times of the year
SOLAR RADIATIO~ OBSERVATIO'~ AT DUBLIN AIRPORT
1. Introductio~
2. Site of Observations
3. Measurement of Global Solar Radiation 4. Measurement of Diffuse Solar Radiation Figure 10 Map showing s fte
Figure 11 Layout of specific instruments on Terminal Building at Dublin Airport
Figure 12 Exposure diagram sho~ing Azimuth and Elevation of all objects which obscure the Pyranometers at Dlblin
Airport together with Azimuth and Elevation of the sun at different times of the year
Page
1 1
1 2 3
3
4 5
7
8
9
10
10 10
10 12 13
14
15 15 15 15 17 18
19
20 20 20 20 22 23
APPEt.'DIX. Table 1 Table 2 Table 3 Table 4
Table 5
Table 6
Table 7 Table 8 Table 9 Table 10
Table 11
Table 12
Instru~ents in use in 1979
Daily Totals of Global Solar Radiation at Valentia Daily Totals of Diffuse Solar Radiation at Valentia Daily Totals of Radiation Balance at Valentia
Instantaneous Values of Direct Solar Radiation at Normal Incidences at Valentia
n~ily Totals of Direct Solar Radiation at Normal
Incidence at Valentia
Daily Totals of long-Wave (Infra-Red) Radiation at Valentia
Daily Totals of Global Solar Radiation at Kilkenny Daily Totals of Diffuse Solar Radiation at Kilkenny Daily Totals of Global Solar Radiation at Birr Daily Totals of Diffuse Solar Radiation at Birr Daily Totals of Global Solar Radiation at Dublin Airport
Daily Totals of Diffuse Solar RadJation at Dlblin Airport
Page
25 26 27 28
29
33
34
35 36
37
38 39 40
•
S'JMMARY
This volu~e contains a brief description of the site, equipment
and obs~rving procedures in use at the fo~r stations in the Irish
network of Solar Radiation measuring stations i.e. Valentia Observatory, Kilkenny, Birr and Dublin Airport.
In previous yeaTs hO'.lrly values were published but as and fro'1l
January, 1976-only daily totals ~re published apart fro~ the spot values of Direct S~n at Normal Incidence (Table 4.)
ine hourly values ~ay be had on request fro~, ine Director, Meteorological Service, Glasnevin Hill, D'Jblin 9.
1. Introduction
- I
-SOIAR RADIATIO:-I 03SERVATIO"'S AT VAlENTIA O'3SERVATD.1Y
1979
Solar Radiation observations "Nere begun at Valentia O:.servatory in September, 1954. At that time a Yoll thermopile p}Tano~eter and a recording millivoltmeter were installed, and have, since then, provided a continuous record of Global Solar Radiatio~. A Linke-Feussner
thermoelectric iron-clad Actinometer (Kipp and Zonen) was also brought
into use at the same time and a schedule of routine observations on
direct sunlight has been maintained when weather conditions permitted. In 1962, a second Moll thermopile pyrano~eter, fitted with shading ring, was installed to provide a record of Diffuse Solar Radiation.
Measurement of the Radiation Balance with a Funk type Net
Pyrradiometer was introduced on a ro~tine basis as fro~ 1st. January, 1971. Measurements of the Direct Sun radiation, using an Eppley Normal
Incidence Pyrheliometer, and of Infra-Red radiation, using an Eppley Precision Radio~eter (Pyrgeometer), were intro:luced on a rO'.ltine basis as and fro~ 1st January 1979.
Data derived fro~ these instru~nts and the results obtained from the direct sunlight observations for the period 1954-1959 have been published in [1]. The data for 1960 and subsequent years have been published in annual volumes. This volume contain3 the data for 1979.
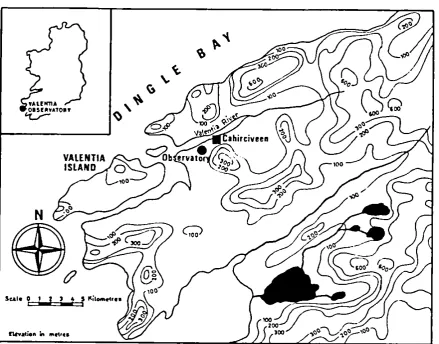
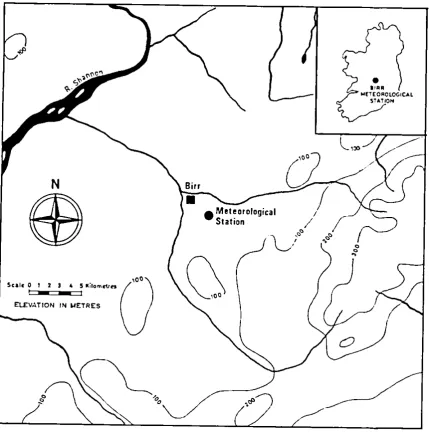
2. Site of the Observatory
TheoObservatory whigh is in the extreme south-west of Ireland, (Lat. 51 56'N; Long. 10 l5'W), is situated on the south-east side
of the narrow estuary of Valentia River,which runs from approximately north-east to south-west (Fig. 1). It is about 1.2 Km to the south-west of the town of Cahirciveen. To the north, across the river estuary, is a range of hills 120 to 360 m high. To the north-east, beyond the town of Cahirciveen, the estuary opens out considerably and the terrsin is
generally an open boggy basin with only a gentle gradient. To the
south-east, however, the ground rises rapidly again to a range of hills 270 to 360m high, the highest peak (Bentee 375m) being only 1.5 Km from
the Observatory. To the south, the country opens out to a distance of nearly 8 Km fro~ the Observatory, where the Kilkeaveragh range of hills runs east west, varying in height fro~ 120 to 390 m. There is an opening to the sea to the south-west between the mainland and Valentia Island. The hills on the Island rise to a height of 270 m. North of the Island there is another opening to the sea, and the circle of hills in completed by a range to the north-west, 120 to 270 m high, separated by a narrow gulley fro~ the range to the northward.
3. Measurement of Glo~al Solar Radiation
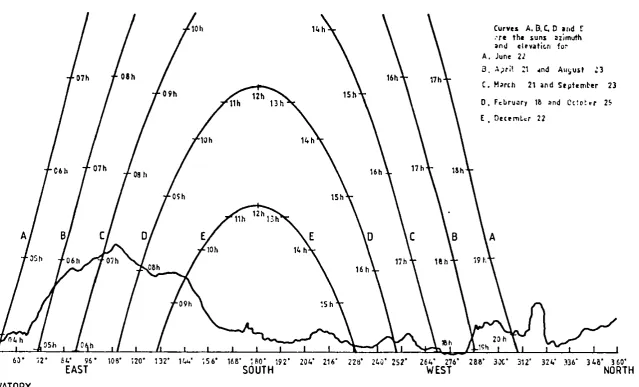
3. 1 Exposure of the Pyranometer
The layo'.lt of the Observatory is sho.n in Fig. 2. The sensor is exposed on the roof of the Radistion House and the recording instruments are installed inside the house. The pyranometer is at a height of 4 metres above ground level and 20 metres above Mean Sea Level. The nature of the exposure can be seen in Fig. 3,
- 2
-o
objects have an elevation of less than 5 so that their effect on the Diffuse Radiation is negligible.
In the sector 0800 to l500E.
fro~
north, the elevation of the obscuring objects lies between 80 and 10.50 approximately. The loss of Diffuse Radiation according to Blackwell's formula [2] works out at approximately l~. This is also very s:nall, so no corrections have been wade to the data to alloN for this loss. The loss of radiation due to the obscuring of the direct solaro 0
beam occurs :nainly in the same sector (080 to 150). During the period fro~ the end of August to mid-April, the initial 30 to 70 minutes of the direct sun is ('ut off. 11>J" affects the. hourly values given for the first and occasionally the second hour but the effect on the total for the day is negligible. ~o attempt has been made to correct the radiation data for this loss of direct sunlight.
3.2 Pyrano~eter Used
Details concerning the pyranometer and recording equipment are given in the Appendix.
3.3.Calibration of the Pyranometer
The pyrano'lleter, recorder and integrator ~'ere calibrated by means of the Actinometer and Yillivoltmeter, described in
paragraphs 7.1 and 7.2 belo'N. The calibration was done by
comparing the intenSity of the direct sunlight as measured by the
pyrano~eter with the corresponding intenSity as measured by
means of the actinometer.
3.4 Timing Control
To facilitate accurate timing, time marks were made on the chart, automatically, by standard clock, at each hour L.A.T. This clock, which also controlled the print-<lut unit, waS adjusted daily to keep it within! minute of true L.A.T.
4. Measurement of Diffuse Solar Radiation
4.1. Exposure of the Pyranometer
The Diffuse Pyranometer is mounted on the same site as the Global Pyranometer, at a distance of 3.1 metres west of the latter. A description of the site is given in 3.1 above.
4.2. Pyranometer Used
4.3.
See Appendix.
Calibration of the Pvranometer
.
- - -
-- 3
-4.4 Shading-Ring Correctio~
Correctio~s ~ave been made to increase the values extracted
fro~ the charts to co~pensate for the diffuse energy intercepted
by the ring simultaneously with the eclipse of the sun's disc. Theoretical corrections were c01lputed following the method
described by Blackwell [2]. 5. Measurement of Direct Sun Radiatio~
5.1 Exposure of the Pvrheliometer
The Direct Sun Pyrhelio1leter is mounted on the same site as the Global Pyrano1leter at a distance of 2.4 metres north-west of the latter. A description of the site is given in 3.1 above. 5.2 Pyrhelio1leter Used
See Append ix .
The Pyrheliometer is ",o'~nted on an Eppley Solar Tracker - a power driven equatorial mount with provisio!1 for varying the
elevation and azimuth settings. The tracker settings are adjusted as necessary to keep the pyrheliometer directed at the sun at all times.
5.3 Calibration of the Pyrheliometer
The pyrheliometer and integrator were calibrated by means of the Act ino~eter and ~Iillivoltmeter, as described in paragraphs 7.1 and 7.2 belo"N. The calibration was done by comparing the intensity of the radiation as measured by the pyrheliometer with the
intensity measured by the actino~eter. 6. Measurement of Infra-Red ~adiation
6.1 Exposure of the Radio~eter (Pvrgeometer)
The Infra-red Radio1leter is :no'~nted on the same site as the Global pyranometer at a distance of 1 metre south-west of the latter. A description of the site is given in 3.1 above. 6.2 Radiometer Used
See Append ix.
6.3 Calibration of the Radio1leter
The radio1leter was calibrated in a water-heated
- 4
-7. Direct Sun Obs~rvations
7.1 A Linke-Feussner thermoelectric iron-clad actino~eter, provided with red and yellow filters was used for all instantaneous direct sun obs~rvatio:1s
See Append ix •
The actino:neter body consists of six massive copper rings,
which are made to serve as diaphragms. The op"nings of these diaphragms decrease progressively to Nards the thermopile, and the chambers formed between them are specially shaped so as to eliminate turbulent air currents within the instrument. Felt lagging aro~nd the body shields the instrument thermally.
7.2
The detachable filter head consists of a heavy copper core, which is screwed on to the exterior ring and carries a filter disc. Only a small segment of this disc protrudes from the head, so that the filters are kept at actinometer temperature.
The Moll thermopile is divided into two equal s"ctions, connected in oppositio!l and each consisting of twenty constantin-manganin
couples. One of the sections is screened from radiation and thus acts as a compensating device for the elimination of thermal
effects associated with quasi-adiabatic pressure changes, oGcurring near the thermopile surface.
A thermometer for reading the temperature of the instrument is set inside the copper parts.
7.1.1 Filters Used
Three filters of Schott glass OG
I , RG and RG8 received from the Radiation Commission of2the
International Association of Meteorology, were used for all the observations. These filters were tested at Davos Observatory and a certificate with the reduction factor (DR) supplied.
For Filter 00
1 t DR = 1.108 For Filter RG
2, DR
=
1.132 For Filter RGS' D!l = 1.050
Cal ibration of the Actinometer
In 1961, an Angstrom COmpensating Pyrheliometer (~o. 548) was received, with calibration data, fro" Stockholm. This
instrument is reserved as ~ational Reference Standard. Its calibration has been maintained in agreement with IPS 1956 by participation in the W.M.O.·Region ~ Co"p3risons of ~ational Standard Pyrheliometers held at Davos in 1964, in Carpentras, France, In 1969, and at Davos in October, 1975, and also by
participatio~ in a co"parison organised by the E.E.C. in Carpentras in 1978.
.
.
- 5
-7.3 Observational Routine
All observations were made at a site about 6 metres south east of the Radiation House (Fig. 2) and at a height of 15.5 metres above M.S. L. Observat ions were made three times daily, when sky conditio~s permitted, at approximately 1030, 1230 i.e. at approximately the average time of local noon and at 1430 G.M.T. Each of the observations consisted
of a double series of measurements in the order: Zero -RG
S - Total - RG2 - OGI - OGI - RG2 - Total - RGS - Zero. Observations ~ere made of the time G.M.T. of each of the individual settings, the temperature at the beginning and end
of each set of observations, as indicated by the thermometer attached to the Actinometer, the cloud type and amount, visibility and weather.
7.4 Computation of the s',n's Zenith Distance (Z)
The Sun's Zenith Distance for each time of observation was obtained fro~ a special table prepared for Valentia, based on Tables 5, 6 and 11 as given in Linke's "Meteorologisches
Taschenbuch" Vol. IV (Leipzig 1939 edition) and the "Alt Azimuth
o 0
Tables for Latitude limits 30 to 54 ", prepared by P.L.H. Davis and published by H.M. Stationery Office, London (1918 edition). The values are correct to the nearest tenth of a degree.
7.5 Computation of the Optical Air Mass (m)
The Relative Air Mass ("1,) was obtained from the Sun's
Zenith Distance (Z) by using Table 137, page 422 of "S:nithsonian Meteorological Tables" (1951 edition). This table is based on Bemporad's
formula:-=
Atmospheric Refraction in Seconds 5S.36 Sin ZThe Optical Air Mass (m) was cO'Dputed from the formula:-P
m-"1
h-.
-=1"'0""0"'"0-S Radiation Balance
the atmospheric
where P = pressure in millibars
Measurement basis in 1971. the Appendix.
of the radiation balance co~menced on a ro~tine Details of the instruments used will be found in
The exposure is over a lawn surface adjacent to the Radiation
- 6
-References
[1] Solar Radiation Observations at Valentia Observatory, 1954 - 1959 (Meteorological Service, Department of Transport and Power, Dublin,
1961)
[2]
Five years Continuous Recording of Total and Diffuse Solar Radiation at Kew Observatory - By M.J. Blacl,.-well.·
·
·
•
- 7
-Sale 0
w
U [image:11.596.66.506.203.547.2]to
..
"
,.
"
..
I I...
I•
I I I I,
8
-..
,
..
IO,.
,-I
,
>.
..
o
..
•
>
..
~•
~
•
~
..
c"
...
•
'"
..
o..
5
>.
.. I • •
Curves A. B. C. 0 Ind r
,'rt the 5uns azimuth
:tntJ elrv~ti("Tl fo:, A. June 2J
a, ~)rH :1 .md Au~ust ~3
C. MOIrth 21 and Stphm~er 23
O. Fcbru.lry 1~ ;tnd Ct~O~ I!r 250
'" :2' :4' 36' 46' 60' ;2' 64' 96' lOS' 120' 132' 1"'" ;56' 168' l~O' 192' 204' 216' ZZij' 240' 252' 26'" 276' 2Ba' 31t' 312' 32'" J36' 34e' HO'
RTH EAST SOUTH WEST NORTH
VALENTIA OBSERVATORY
[image:13.840.115.755.82.469.2]10
-SOL\R RADIATIO'! 03SERVATIO>.;S AT KILKENNY !!ETEOOOLOJICAL STATIO'!
1979
1. Introductio~
Measurements of Glo~al Solar Radiation were begun at Kilkenny towards the end of 1968 while measurements of Diffuse Solar Radiation commenced in May 1979. Data given in this volu~ represent the results for 1979.
2. Site of the Observations
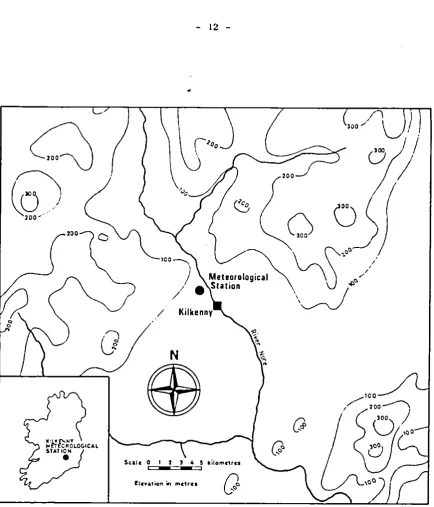
The Meteorological Station is situated 2 Km north-west of the centre of Kilkenny at Latitude 520 40'N; longitude 070 16'W. Kilkenny is mainly a marketing town of population 10,000, in which there are no !Ilajor
industries or sources of atmosph3ric pollution. The countryside
immediately surrounjing the station is flat open grassland. Low hills beyond this area are sufficiently distant to avoid causing o~struction.
3. Measurement of Glo~al Solar Radiatio~
3.1 Exposure of the pyranometer
The global pyrano~eter is installed on a stand at the southern edge of the flat roof of the station building 5 metres above ground level (Fig. 5) and 67 metres above sea level.
o
The exposure is good, all effective obstruction being beloN 2 elevation except between 570 and 590 azimuth where an anemometer
o
mast obstructs to 55 elevation (See Fig. 6)
3.2 Pyranometer Used
See Appendix.
3.3 Observing Procedure
Time marking of the records and control of print-out is by means of an electric clo~k, reset each night to ~aintain timing within
!
minute of time L.A.T. The method of tabulation of the records is the same as that already described for Valentia Observatory.3.4 Calibration of the Pyranometer
The instrJIDent in use is similar to that in use at Valentia Observatory and was calibrated, before installation, against the Valentia Standard.
4. Measurement of Diffuse Solar Radiation
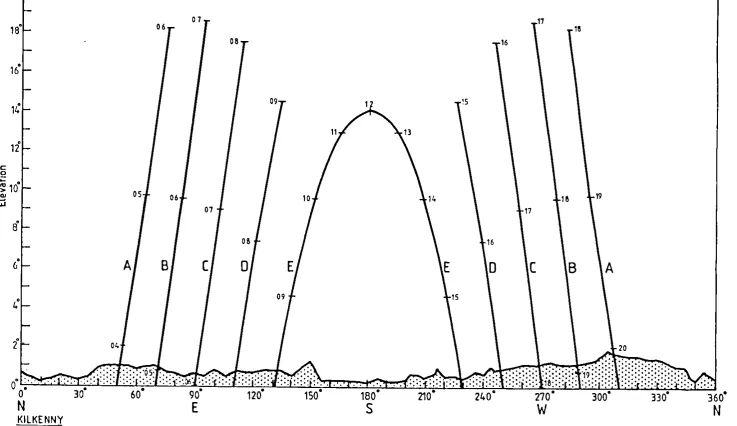
4.1 Exposure of the Pyranometer
The diffuse pyranometer is mounted on the same site as the global
pyrano~eter, at a distance of 9 metres north-east of the latter. A
description of the site is given in Section 2 above.
4.2 Pyrano!Ileter Used
- 11
-4.3 Calibration of th~ ~~nomete~
The shading-ring .·as displaced below th'> hori7.ontal position and the calibration was done in exactly the sa.'Ile way as ror the global pyrano'Deter. The calibration was checked by comparing the values
recorded during the hours when the sky .. as overcast with the corresponding values as record,d by the global pyrano~eter.
4.4 Shading-Ring Correction
Correctio,s have been ~ade to increase the values extracted rro~ tha
charts to cO'Dpensate for the diffuse energy intercepted by the ring
simultaneously with the eclipse of the sun's disc. Theoretical corrections were co~~~ted following the m,thod described by Blackwell [2].
5. Missing Data
200
o
- 12
-)
/1
300/'20'
;!J
o(
o
~
)
Meteo'OI:>
'~v'c:c'/
I • Stat'OR )yicol \
~0
/
,
/
N
Ee
Scale 0
,-
I 2-.
, 4 5 lIilomc1.rn,
[image:16.599.74.509.92.600.2]·
.
.
.
L J
Tl
~
STORE
I
I
I
I
...
Nephoscope Diffu§t pyranomettr
/
Sc ;ale 0
Fig. S. Kilkenny Heteorological Station - la)out of buildings and instruments
L-t
Rilingiluge
1 Z l
I I I
Sle~enson screen
...
Earth thermometers
Rain recorJrr
4 5 metrtS
I I
[image:17.844.30.771.66.514.2]20"
18"
16"
14
"
12
c: 0
' ' : 0
~ 10
'"
i;j
8'
"
6
4"
i
0" : ....
o·
N
KILKENNY
04
30·
01 06
08
os
0607
08
A
B
(o
.'
.
.
:-:.':-.'
90· 120·
E
09
09
180·
S
~S
15
17
18
16
18 19 17
16
o
(B
A
20
, ' , ,',
240'
270·
300·
W
330·
Fig. 6. Exposure diagram showing (1) azimuth and elevation of all objects which obscure pyranometer.
(2) azimuth and elevation of sun at various times of year as follows: (A) June 22, (6) April 21, August 23
((IMarch 21, September 23,
to)February 18, October 25,
(E) December 22 .
• I • '
360·
[image:18.844.30.768.76.502.2]- 15
-SOL\R RADIATlO:'>I Q;JSERVATlO';S AT
nmn
~!ETF.OROlf)JICAL STATIO"1979
1. Introduct ion
Measure~ents of Global Solar Radiation ... ere begun at Birr towards th?
end of 1970, while measureme!1ts of Diffuse Solar R:ldiat ion cOI;l:nenced in May 1979. Data given in this volu",,, represent th,o results for the year 1979.
2. Site of the Observations
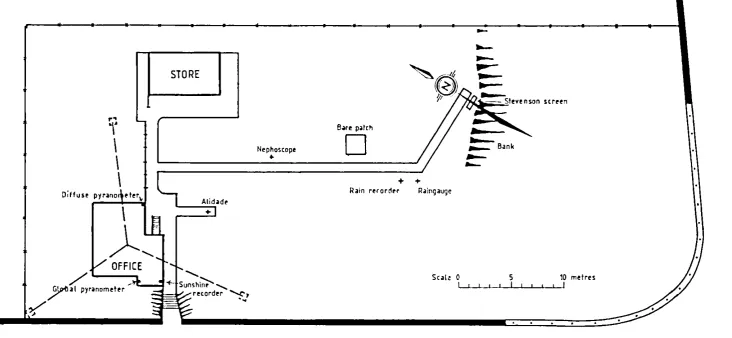
The Meteorological Station is Rituated in (Jat pasture land, fajrly well wooded, abo·~t I! Km east of th" to"n of Birr at L'ltituje 530 05 'N; Longitude 070 54 'W. The surrounjing country is gently
undulating. About 16 KID to th,> east lie the 31ieve Bloom mO'lntains, the main axis of which runs north east - sO:Ith west. The highest p'~ak of this range is 518 ",etres. ~bo·~t 10 KID to th" north of the station, there is an extensive area of bog (see Fig. 7).
3. ~~asurement of Global Solar Radiation
3.1 Exposure of the Pyranomcter
The global pyranoOleter is installed on a stanLl at th,? southE'rn e>dge
at
the flat rO'Jf of the station building 5 metr(>s abO\'e ground level (Fig. 8) and 75 :netres above sea level.Thg exposure is generally geod, all effective obstruction being below 2 elevation, except for a fC',II isolated buildings -Ahich o~striJct
0 0 0
the horizon above 2 and betwc-€"!1 37 3nd 39 az.imuth where an o
anemo:neter mast obstructs to 64 .,levation (See Fig. 9).
3.2 Py!ano:neter Use~
See Append ix •
3.3 Observin~ Procedure
Tim~ marking of the records and co~trol of print-out is by rn0ans
of an electrical clock reset each night to maintain timing within
!
minute ot true L.A.T. The ~ethod of tabulation of the records is the S3me as that already described for Valentia Observatory.3.4 Cali brat ion of the Pyranometer
The instrument in usa is sicilar to that in use at Valentia Observatory and was calibrated, before installation, against the
Valentia Standard.
4. Measurement of Diffuse Solar Radiation
4.1 Exposure of the PYranometer
- 16
-4.2 Pyrano~ter Used
See Append ix •
4 • 3 !Co:!a:.;I::.1::.b::.!.r.::a~tc.:1:.:0~n.:....;0"f.:...::t:.;h:.::e,--,p,"",y,-r::.~!£.1l_e_t_e_r_
The shading-ring was displaced below the horizontal position and the calibratio~ was done in exactly the sa~e way as for the global pyrano"Deter. The calibration was checked by co:nparing the values recorded during the hours when the sky was overcast
with the corresponding- valu~s as recorded by the global pyr'lno:neter.
4.4 Shading-Ring Correction
Correction.s have been made to increase the values extr.lcted
N
€a
:
Fig. 7 Map showing site of Birr Meteorological Statron.
•
liAR w£TEOROlOGtClL
[image:21.598.88.519.186.620.2]r'
"
I
I
STORE
Alido1de
+
Nephoscope
•
B:.re pa~ch
o
+ +
Rain r~rordtr Raing.1ugc
•
-~ Bank
-Sca(~ 0 5 10 metres
1 t I , I I ! , , I I
Fig. O. Birr Meteorological Station - layout of buildings and instruments
[image:22.843.24.757.83.421.2]20'
lB'
16'
It:
12' c: 0
'4:
'"
~ 10'
UJ
B'
6'
t:
O' :::
O'
N
BIRR
64' ~
•
05
ig. 9. Exposure diagram showing
06
.
.
.
.
06
07
07
(
90'
E
08
OB
o
09
09
150'
180'S
17
18
16
15
18 19 17
16
o
(B
A
20
330'
(1) azimuth and elevatlon of all objects wh',ch obscure pyranometer.
12)
azimuth and elevation of sun at various times of year as follows (A) June 22 tB) April 21, August 23
(C) March 21, September 23 (D) February lB, October 25 tEl December 22
20
-SOLAR RADIATIO~ 08SERVATIO,S AT DUBLIN AIRPORT
1979
1. Introduction
Measurements of Global Solar Radiation were begun at Dublin Airport in September, 1975 and of Diffuse Solar Radiation in May 1976. Data given in this volume represent the results for 1979.
2. Site of thp. Observations
o 0
Dublin Airport, Latitude 53 26'N; Longitude 06 l4'W, is situated on a ION hill 8 Km north of Dublin City and 9 Km from the sea to the east (Fig. 10). The surrounding country is flat, the nearest mountains
lying about 20 Km to the south.
3. Measurement of Global Solar Radiation
3.1 Exposure of th~ Pyrano~eter
The Pyranometer is installed on the third storey balcony of the Terminal Building 82 metres above sea level and 13 metres above ground level (Fig. 11).
As the prevailing winds are westerly and the sources of pollution from the city lie to the south the site is relatively pollution free.
There is some obstruction from surrounding buildings (See Fig. 12) but as the vertical component of radiation lost is less than 0.5~
no attempt has been made to allow for it.
3.2 Pyranometer Used
See Append ix.
3.3 Observing Procedure
Time marking of records and control of print-out is by means of an electric clock, which is maintained within! minute of L.A.T. The general procedure for maintaining the instruments and tabulating the records is the same as that already described for Valentia.
3.4 Calibration of the Pyranometer
The instr~ent in use is similar to that in use at Valentia
Observatory and was calibrated, before installation, against the Valentia Standard.
4. Measurement of Diffuse Radiation
4.1 Exposure of the Pyranometer
:
21
-4.2 Pyranometer Used
See Append ix •
4.3 Calibration of the pyranometer
The shading-ring was displaced below the horizontal position and the calibration was done in exactly the same way as for the global
pyrano~eter. The calibration was checked by co~paring the values
recorded during the hours when the sky was overcast with the corresponding values as recorded by the global pyranometer.
4.4 Shading-Ring Correction
D
Fig. 10 Hap showing site
- :!:2
-gublin AIrport.
eteorologica
ISt t"
a Ion
of Dublin A" Irport Meteorological
~
CUBlI~
AIRPORTo"!CAL
N
ffi
SC.1lt C l..u.J t ~
I ! t 11~ KitJmetrtS
ElEVA TID" '" "'UilES
[image:26.599.94.531.173.615.2]- -
-- :.!,
-I
~
:I
oJ-
1\1!-~ ¢-'" I!-0'" ",0
~oJ-'b'" <'b c,"l
q{ q-\
•
",l!-ff I T
~ f-)e ~
:<) '!!:-V "
//./<
BEIEIEI888
=
J:::!
BBBBBBBBBEI
C! Cl Cl CI CICI.'"
TTTT "Lx
IBBBBBBElBBEI
I I V I
I
l'imrn
BB8BBB
nL
8BB8BBEIBEIBEI
. "
EAST ELEVATION
...
...
QI QI
Qj
-
.,
QIE E
...
0 0 QI
c: c: .r::;
.. ..
a....
...
Vl>. >.
a.. a.. QI
QI .5
..
'"
.r::;•
•
. Q :J
'"
B
-
-
c: :J•
l!J CJ
'"
~~ ~
-THIRD FLOOR PLAN
:'1
20',
08
Is·1
06
07
16'
14
I
1
12' e: 0
~ 10·
> Q/
05
06
o.u 07
S·
08
6'
A
B
(o
4' 09
04
2'
O'
O'
30'60'
90'ISO'
N
E
DUBLI!'l
AIRPORT12
180'
S
210'
16
16
o
240',
" "
17 17
(
270'
W
18
1&
B
19 19
A
20
...
...
...
...
...
...
...
...
...
'...
(:::::::::::::::::
...
[image:28.847.73.828.85.521.2]...
...
...
...
...
...
'... .
...
...
, . , . , . ,
...
... .
...
...
... ... .
, . ,... .
...
...
...
... ... .
'I'":'':'':'':i':'':'''
....
"... +
... · ....
:k"
330'
360'
N
Fig. 12. Exposure diagram showing
III
azimuth and elevation of all objects which obscure pyranometer.
..
.
,APPENDIX TABU: OF INSTRUMENTS IN USE - 1979
Sensor Recorder Integrator
Width Diameter
Valentia
Global G2-847 No. 29
Lintronic 7l7A
Dirtuse G18-1387 No. 168 Lintronic 484B 48mm 308mm
Balance Funk 695 Honeywell 68B/2124
Infra-Red Eppley 17154F3 Eppley 411-5879
Direct Sun Eppley 17247EO Eppley 411-5880
Kllkennl::
Global Cld2-073014 XR4-550106 Lintronic 4l5A
(lst Jan - 21st Jan) CM5-690221 (22nd Jan- 31st Dec)
DHtuse CM5-785154 BDB-774733 51mm
305mm
'"
Birr
'"
Global CM5-090246 XR4-188730-l3 CCI G80~76
DHtuso CM5-785100 BDB-785761 5lmm 305mm
Dublin Air[!2rt
Global CM5-77373l Phllips 8053 CC2 750338
DHtuse CM5-752732 Philips 8050 CC2 750262 52mm 315mm
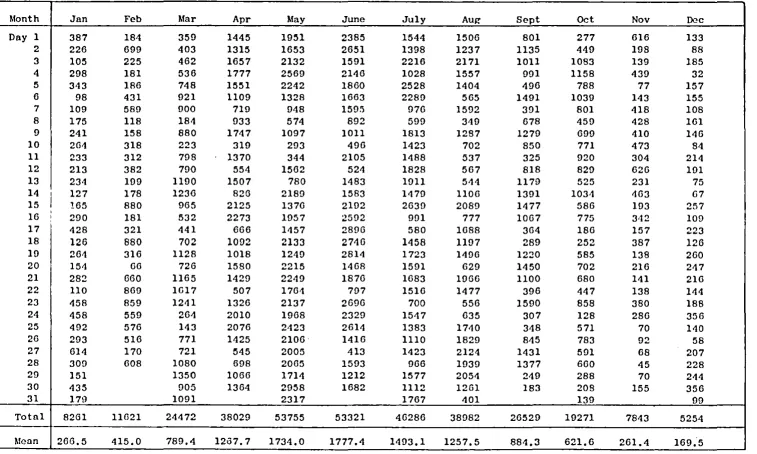
Table t VALEm'IA DAILY TafAIB
Month Jan Feb Mar Apr May
Day 1 387 184 359 1445 1951
2 226 699 403 1315 1653
3 105 225 462 1657 2132
4 298 181 536 1777 2569
5 343 1R6 748 1551 2242
6 98 431 921 1109 1328
7 109 589 000 719 048
8 175 118 184 933 574
9 241 158 880 1747 1097
10 264 318 223 319 293
11 233 312 798 1370 344
12 213 382 790 554 1562
13 234 199 1190 1507 780
14 I 127 178 1236 826 2189
15
I
l65 880 965 2125 1376I
16
.
I 290 181 532 2273 195717 I 428 321 441 666 1457
18 126 880 702 1092 2133
19 264 316 1128 1018 1249
20 154 66 726 1580 2215
21 282 660 1165 1429 2249
22 110 869 1617 507 1764
23 45R 850 1241 1326 2137
24 458 559 264 2010 1968
25 492 576 143 2076 2423
26 293 516 771 1425 2106·
27 614 170 721 M5 2005
28 309 608 1080 698 2065
29 151 1350 1066 1714
30 435 905 1364 2958
31 170 1091 2317
Total 8261 11021 24472 38029 53755
Mean 266.5 415.0 789.4 1237.7 1734.0
" I'
OF GLODAL SOLAR
RADIATIO~
(J/cm2)June July AuI!' sept
2385 1544 1506 801
2651 1398 1237 1135
1591 2216 2171 1011
2146 1028 1557 991
1860 2528 1404 496
1663 2289 565 1491
1595 076 1592 391
892 599 349 678
1011 1813 1287 1279
496 1423 702 850
2105 1488 537 325
524 1828 567 818
1483 1911 541 1179
1583 1479 1106 1391
211)2 2639 2089 1477
2592 001 777 1067
2806 580 1688 364
2746 1458 1197 289
2814 1723 1496 1220
1468 1591 629 1450
1876 1683 1966 1100
707 1516 1477 396
2696 700 556 1590
2329 1547 635 307
2614 1383 1740 348
1416 1110 1829 845
413 1423 2124 1431
1593 966 1939 1377
1212 1577 2054 249
1682 1112 1261 183
1767 401
53321 46286 38982 26520 1777.4 1493.1 1257.5 884.3
Oct Nov
277 616
449 198
1083 139 1158 439
788 77
1039 143
801 418
459 428
699 410
771 473
920 304
829 626
525 231
1034 463
586 103
775 312
186 157
252 387
585 138
702 216
680 141
447 138
858 380
128 286
571 70
783 92
591 68
660 45
288 70
208 155
139
10271 7843 621.6 261.4
1979 Dec 133 88 185 32 157 155 108 161 146 84 214 191 75 67 257 109 223 126 260 247 216 144 188 356 140 58 207 228 244 356 09 5254 169.5
[image:30.844.21.778.56.510.2]'. '
.
Table 2 VALENTIA
.
DAILY TOTALS OF DIFFUSE SOLARRADIATIO~
(J/cm2) 1979Month Jan Feb Mar Apr May June July Aug S.-,pt Oct Nov D;}c
Day 1 80 180 349 041 854 849 1157 1110 582 273 322 131
I
2 3 140 102 217 108 402 384 612 544 782 79(1 1254 873 1237 1333 1099 962 849 787 483 442 138 190 143 87,
4 220 178 510 519 019 819 1024 1250 'l25 337 278 32I
,
5 207 183 551 704 757 023 1029 95G 460 540 75 1520 96 419 450 867 1169 1335 1461 562 80G 442 140 152
7 104 338 518 560 944 1343 969 1096 389 577 227 105
8 161 U8 182 766 573 892 580 347 560 410 269 136
I
9 186 15(1 476 530 913 9G8 1658 1058 824 516 273 140
10 153 278 221 319 293 496 1120 682 668 515 241 82
I I 156 307 468 763 344 837 1203 532 325 523 290 150
12 190 332 676 520 936 524 1247 551 646 472 178 I G9
13 222 199 447 707 777 975 15G5 521 915 348 18G 75
14 125 178 454 700 978 1443 ll90 761 598 395 220 G7
15 164 237 528 510 1240 1496 770 G58 478 4~" ~~ 162 171
16 230 181 5ll 347 1053 903 932 755 769 370 280 109
17
,
120 318 426 660 1151 614 577 10G4 363 182 154 IG!)I
18 : 124 271 563 997 1123 939 1258 817 287 234 230 117
10
I
206 305 534 533 1095 894 1110 1015 555 323 135 J.i420 ,
,
149 66 574 1045 910 1231 1450 GI0 512 335 205 17421 216 467 523 1176 824 1357 1007 856 607 371 130 154
22 llO 350 364 495 907 794 lOGO 996 395 226 134 141
23 273 439 493 903 1125 985 609 528 395 221 173 168
24 234 498 263 874 1113 1230 1324 626 307 128 236 158
25 213 410 142 876 U25 1399 1235 1039 344 348 68 133
26 224 460 571 920 1136 1367 1050 829 575 274 90 54
27 253 170 609 539 927 411 U90 515 316 263 68 173
28 218 342 G93 G81 1331 1425 940 764 269 352 44 149
29 147 650 922 1303 1185 1409 471 246 283 70 143
30 271 560 1045 757 1318 974 1026 182 190 148 140
31 175 810 1215 1135 400 136 07
Total 5481 7705 14902 21365 29079 31079 34893 24480 15864 10931 5366 4010
[image:31.849.26.780.55.523.2]Tnbl" 3
,
I
iI
I
MonthD.'ly 1 2 3 4 5 6 7 8 9 10 11 12 13 11 15 16 17 18 HJ 20 21 22 23 21 25 26 27 28 29 30 31 Totnl Mr~nn
I
Ii
,
I,
,
,
,
I
I
VAlENTIA
Jnn -520 -377 -38 -251 -227 27 -<12 -102 -134 -159 -217 -18<1 -15 10 25 -217 -346 -62 -121 -77 -10·1 -53 10 -0 82 -26 38 -110 -110 21 -6 -;l,:J.R4 -100.2 F"b -95 -292 -107 71 7!J 105 -7 -94 -33 71 61 29 69 -10<1 -109 -11 187 117 30 52 03 82 45 30 101 207 -15 68 .693 2<1.8 Mar 95 242 128 58 248 369 192 52 288 170 312 321 507 337 170 58 169 315 <175 178 360 448 397 185 51 275 297 307 559 293 471 8<156 272.8.'
"Apr 591 510 567 549 481 402 302 251 565 40 655 193 03<1 334 722 8::J2 336 540 483 687 738 26·1 625 957 1028 485 265 <151 606 630 157<16 52<1.9
DAILY TOTALS OF RADIATION nALANCE
(J/cm2 )
May 922 682 991 123<1 1007 656 532 369 610 189 186 722 <1BO 1224 744 1001 641 940 580 1001 932 607 960 882 1076 900 958 1004 010 1275 1071 25482 822.0 June 1006 1229 87<1 1096 904 885 750 519 575 259 1033 2<19 BI0 832 106·1 1102 1<158 1272 1340 760 1020 439 1155 1267 1193 707 213 701 665 801 2680a 893.6
July Aug
711 819
7<11 625 10<10 1243
460 884
1124 744 1152 337
505 796
335 13<1
967 618
766 <109
858 33G
1052 2()1
1043 218 7·12 520 1:!29 1115
5~·1 135
384 920
788 056
31G 791
000 315
D65 950
780 702
<142 192
924 340
689 954
566 865
817 781
584 759
870 062
570 570
1003 247
21559 1929!)
792.2 622.5
sept 295 531 563 576 261 757 168 326 563 416 173 331 180 401 5Bf) '180 166 111 485 575 353 106 559 128 220 227 352 396 -9 43 10781 359.4 HJ79
Oct Nov Dec
129 -51 78
18·1 34 -70
327 74 -216
170 -6 -5
304 -10 19
386 41 14
305 -5 20
157 3 -85
205 -152 -113
323 -11 -116
365 7<1 -:!O2
373 -157 -54
75 -9C! -121
313 -48 -173
127 -131 -5~
114 -11 -02
-26 8 -175
61 -30 -167
86 04 -161
77 07 -72
77 03 23
18 02 -6
101 -103 -146
-34 -19 -200
17 33 -102
0 62 -9
107 38 -137
104 -27 -20<1 102 -<17 -238
16 15 -192
36 -5..1
<1712 -ZOO -2091
:
- 2!1
-Table 1 DIRECT SOlAR RAOIATID'I_AT ~Ql\l\L !J:!.<;.!OE\;CES
..
l!';S,,"'f,~!,(WU;; _V,\Ll]-",-S (!LW/cru~ ~ _ _ _ _ _ 1979
~-I--T~
i
i
R·\UIATID',i
--r-T~
-i-r
CLQ:m-;3
.:is
I~,
I
I;;-i
1
i~II~I'>-1
I
~
I
~
!
~ ~
II~!
1_
,,~N
!
8
I::"'!
§ ,
~
I E
~
,
-
1
...l",I'E~ ~'
'"
-
,
I:;;,
~'S~,
,
,
51
rr> Q.9
~
'"
::;
I
CJ)
[i
I'
5:::l
f;:I
~
~llz '~'t:Jtc::lo-l'a':.:.J
::a _ til c..10
o
~
'"
'~I""I'"
"""";;:
"'j<'"
>-
':;;1
::a1E-:'"
I < , u
-I>-I=I-'IE-
> , >E-
L<
i
'
+
-I
, , '
,
--
I -
i -
Fl0-1 -:;0-, xlO-l
xl~
i
mb
!
o~ ~
mb
;:~---I
::Jkt4
Jan
I
, I
" I ,
I '
I
1 1008
73.91
:;.23/ 677 523 1612 1428 110221-0.7 3.6 150 C... Tr1 !1148: 75.013.92\ 765 559 1666 15<3 110221 2.3 'I 4.0' 50 CuFe
I
TrI
17 10081 76.811.451 702
I
503,601 ·10511028 4.·1 5.9 40 1 Cu 117 1132 73.01
3.5~
760I
529' 6H 422' 1021 0.0 S.2 40, CuI
2 ,25 11001 72.2,3.2417761 535 613 433 995: 5.0 6.6 10
Icu
I
3 '27 111481 70.512.91739 , 499 605 406 9951 4.3 5.7, 60
II
CuSeCiI
4Feb,
I
1
:
1
,
'I2 11004 73.3: 3.4s! 603
i
560 673 453 110051 3.4I
4.7 30 Se TrI 2 1136169.0'2.791852 1582 70S 4711100]5 1.41 1.9 30
s'-'
II Tr2 1448 77.9 1.74! 711
I
525 620 423 10061 5.3 5.1 170 Ci Tr15 1012, 68.8 2.81 755
I
548 618 ·155, 1024 -1.7 4.2 35 Cu 1 ,15 1124 65.2 2.43 816 , 580 69517511024 -0.9 1.1 135 C...
I
2I
18 : 1208 63.7 2.28 698 1 149 560 358 11011110.5 10.3125 CuFe
I
222 11052 34.01 2 •34 7·10
i
487 589 386 110311 9.3 9.5 10 1 C ... Se 31::::1
::::1:::: :::
! :;;
I;~;
,:::
1::::1 ::: ;::
I::
I;:;::~
T:
II'dar
22 23 23
Apr
0936 59.3 1.98
1
882
!
588 :716 1465 10131 7.2 7.1i
5 :>iC"'s.o
Tr :63.2 2.22 806
I
542 1651 438 1002 8.0 6.3 120 IcuFe 23 1528
4 11100
4 11334
9
,
0852',
9 10956'
15 10~0
15 ,1320
16 0952
16 11201
16 12281
I 16
1
1408'I 16 115521
May
I
3 0928
3 1108
'3 h514
4 ,'0301
4 1100
4 '1248
4 iI536
5 11044
I ;
11252~!0812
48.0 1. 50 803
I
55:> 665 444 10041' 8.2 6.6 130
I
CUCb 3~~:~I~:~~i:~~
I
~~~ :~~ :::~~ ~~~:! ~:: ~:~ I~~ ,g~~~
~
i
51.311.60 859 572 1096 1459 10041 8.5 6.9 135
:C ...
Fe 12,
18.9 1.561882 1 561 '698 :446 1026 12.0 •• 6 ,50 'Ci 6 1
45.3 11.46 844 , 543 1670 1148 1028'112.2 10.6 150 !FeCi , 6 1
49.311.581866
I
565 1690 465 1030 11.3 7.9 ,50 :FeCi 1 3:42.711.40 867 535 '689 ,160 1029113.3 8.5 '40 IFeC! ' 5
I
42.311.391892 1574
1
703 1459 1029113.9 3.5 140 IFeCi!
5 ,49.311.58 855 557 '6B6 '456 1029 14.4 7.9 40 'Ci
I
2I
n.'
".''1'''
I '"
I",
I'" "" ("'
I
W.'
I"
I~"
I'
47.2 1.491887 569 699 467 1015 5.5,' 7.0 50 iCuCb 2 ,
37.8 1.281917 580 720 473 1015 7.5 7.3 50 ,CuCb 3
i
57.1 1.86 788 515 626 421 1015 3.6, 7.0 150 C ... Cb 3
I
50.31
11.59'803 529 612 -131 1018 6.01
' 7.6 140 ICUCb , . 1
38.0 1.29 014 585 72~ 473 1020 7.4, 7.5 150 CUS.O
I
337.3 h.28 928 590 731 481 1020 3.6 7.3 ,50 ICuFe 3
55.7 1.81!841 546 571 -143 ,1021 9.3 7.9 170 ,CuFe 1 2
38.8 1.31 877 560 '691 ,455 11024 8.7 7.5 :25 ICuSCAe 5
37.21.23
j
'892 561 !700 1453 110241 8.9 7.6
Iso
euS"i\c
1 33
[image:33.599.56.543.75.767.2]I
I
I I
Table 4 (Contd.)
>-<
c
.
f-o
~ <
< ..l 1= til
e·
:;;...
:;; f-o
May
21 1012 21 1348 30 1120 30 1448 30 1616
June
5 1416 16 1340 16 1456 16 1520 17 0944 17 1528 19 0836 21 1528 23 1508 24 0824 24 1020
J ull
15 0848 15 1120 21 1434
Aug
3 1200 3 1252 3 1432 15 0816 15 0956 15 1100 15 1340 15 1404 21 1000 26 1448 27 1020 27 1408 28 1528 29 0852 29 1352 29 1504
Sept
1 1528 9 1504
(j
Z
< ~
f-o e
'"
~...
Cl~'"
N til
=~
..:
f-o
::a
...
z c:
t.l
...
N ..:38.1 1.27 38.1 1.27 31.2 1.18 44.2 1.41 57.1 1.86
39.4 1.31 34.4 1.24 44.1 1.43 47.6 1.52 38.6 1.31 48.6 1.55 48.0 1.53 48.6 1.53 45.7 1.44 49.8 1.56 34.3 1.22
47.7 1.53 31.3 1.20 43.3 1.40
34.3 1.23 35.9 1.25 45.5 1.45 58.1 1.90 45.1 1.43 39.6 1.31 42.8 1.37 45.2 1.43 46.5 1.48 53.6 1.72 46.4 1.48 49.2 1.56 59.5 2.01 57.0 1.87 48.3 1.53 56.6 1.85
60.7 2.05 60.0 2.05
30
-DIRECT SOLAR RADIATIO~ AT NOR~~L INCIDE~CES
INSTA~TA~OUS VALUES
RAD IAT 10:-1
~
...
~
8
~N ~ 0')
"
"
c:
S
c:c: ~ ~
..:
:l
Cl...
Cltil til til
u c: >- c:
-1 x10⁻¹ -1 -1
10 x10 x10
905 566 705 460 895 566 700 459 861 540 671 431 876 554 689 447 822 528 655 429
877 550 684 443 883 544 680 434 872 540 676 437 855 531 667 431 843 525 660 419 782 496 619 402 714 468 587 384 781 482 596 402 835 520 647 417 855 538 673 434 896 554 693 441
692 461 563 376 746 478 591 389 856 540 673 436
901 558 697 452 892 548 689 438 859 533 669 429 805 511 532 405 860 533 679 422 883 539 680 433 882 541 683 435 842 517 649 411 874 541 681 439 596 427 341 361 865 537 644 443 810 498 544 417 686 477 57[, 392 674 465 561 374 783 522 640 423 669 469 564 385
808 513 643 411 809 509 640 410
2
(mW/em )
t.l
§
'"
t.l
'"
c: til
::>
'"'
til f-o Ilo
§
~ c:'"
'"
::>'"
Co atil
::a
Iloc:
'"
<Ilo f-o ~
mb DC mb
999 10.7 8.9 999 10.9 9.3 1014 14.9 11. 7 1013 15.0 10.6 1014 14.0 11.6
1016 13.4 10.9 1025 18.0 16.0 1026 18.0 16.0 1026 18.0 16.0 1028 16.4 14.0 1028 18.0 15.8 1022 18.8 16.4 1016 13.1 10.3 1007 13.7 11.0 1009 12.6 11.0 1010 13.4 11.2
1029 16.0 13.6 1029 17.0 15.1 1019 14.8 11.9
101'i 16.0 14.0 101'i 16.1 14.1
1016 15.5 13.1 1008 14.0 12.4 1006 14.6 13.3 1008 15.8 13.E 1009 16.0 12.E 1009
'1'·'
1017 14. 12.6 1020 17. 14.1 1022 15. 13.6 1022 16. 14.4 102: 17.: 14. 1021 17.( 12.] 102( 21.( 13.: 10I[ 20. ! 15. :
100' 15.< 15.~ 102£ 14.( 10. !
1979 CWUD >-f-o
...
...
...
Q...
'"
'"
Co...
>-~ f-o
Km
50 CUCbSe
50 CUCb
25 CUCbCi
35 CUCb
35 CUCb
45 C-.J 40 FeCi
40 CUSe
4 CUSe
60 CuCi
30 CUFeSc
20 FeCi
20 CUFeS"
40 CU
30 CUSe
40 CUSe
45 FeCi
50 CUFeCi
40 CUFeSeCi
25 C-.J 25 CU
25 CUSe
30 CUSeCi
30 CUCi
30 CUCi
40 CU
40 CllFc
30 CU
12 CUCi
50 CUSeCi
45 CUFeCiCE
12 CuAeCi
16 Ci
14 Fe
15 Fe
25 CuScCi
55 CUSe
I
~
::> a :;; < Okt, 2+ 5 4+ 2 2 2 Tr 3-2+ 1 5 6 4 2+ 2 5 3 5 3 3 4 5+6
..
[image:34.599.49.527.94.841.2]•
.-•
•
Table 4
(Contd.)
>-<C
Q
.
f-o
~
<C.
o-l
~
E:l...
0
-::a
,
f-oSept
9 1628 14 1316 20 0928 20 1312 20 1328 21 1444 23 1112 23 1304 23 1536 27 1320 27 1352 28 0900 28 1024 28 1120 28 1444 28 1516
Oct
3 1544 4 0904 4 1048 19 1312 19 1436 20 0928 20 1430 20 1548 21 1456 21 1520 22 1548 23 0856 23 0951 23 1056 23 1124 23 1300 23 1336 25 1316 26 0924 27 1012
Nov
7 1216 7 1440 8 1248 8 1412
'"
u~
f-o en-
Q~ _N -~ f-o-
z'"
N 71.7 51.0 59.7 52:9 54.0 61.6 52.8 53.7 68.8 56.1 58.5 65.8 57.5 54.5 64.0 67.9 73.1 67.4 58.2 63.8 70.3 70.2 70.1 79.1 73.1 75.8 79.7 74.6 69.1 64.8 63.7 64.6 66.6 66.0 72.5 68.7 68.2 76.5 69.2 74.331
-DIREcr SOI.\R RADIATJO'l AT NOR~IAL INCIDENCES
INSTA~ANEOUS VALVES
RADIATIO'I
~ ~
e
..
~
8
~
~
'"
~"
~ 0: ~
0: ~
3
<C
0:
:l
Q o-l-
<C U'"
0: ~x10-1 x10 -1 xlO- 1
3.24 693 454 527 1.63 827 509 640 2.01 793 504 632 1.68 853 533 664 1.73 844 530 659 2.14 819 525 656 1.69 882 560 648 1.73 847 538 639 2.81 712 475 573 1.84 814 516 646 1.97 787 499 624 2.50 794 525 648 1.91 861 554 686 1.77 878 565 699 2.34 821 541 668 2.71 766 511 630
3.46 713 481 593 2.61 790 522 647 1.91 871 556 694 2.31 766 498 623 3.01 646 432 525 3.01 645 435 544 3.00 669 446 552 5.35 448 324 392 3.49 606 441 526 4.12 584 431 514 5.56 577 411 493 3.80 627 451 538 2.83 700 474 579 2.37 778 514 633 2.28 778 512 626 2.35 778 514 635 2.54 762 511 626 2.45 841 550 684 3.35 744 515 627 2.76 781 524 636
2.68 716 469 574 4.26 558 393 478 2.82 736 495 604 3.70 641 444 544
2
(roW/e:n )
~
(Xl
'"
"
0:§
~ (I)
(I)
Q
'"
<oJ 0:
c:
"-xlO- l rob
364 1026 405 1025 107 1015 436 1017 428 1017 419 1023 445 1023 431 1023 382 1023 413 1029 401 1029 423 1029 446 1029 453 1028 440 1027 418 1027
399 1009 426 1007 454 1007 404 1021 350 1021 351 1027 361 1027 267 1026 363 1018 358 1017 339 1011 370 1015 381 1015 417 1014 415 1013 419 1013 415 1012 449 999 419 1012 419 1008
382 1001 327 1003 327 1006 365 100(
'"
§
~
'"
'"
e,
~ <oJ f-o°c
14.0 15.1 12.7 14.0 14.0 12.0 14.4 14.9 13.8 15.1 15.1 13.0 15.3 16.2 17.2 15.9 14.0 13.3 13.0 14.0 13.1 9.5 13.3 13.4 14.1 13.4 12.8 5.1 7.9 12.6 13.5 13.5 14.0 11.5 7.1 13.3 12.0 11.8 8.3 9.3 1979 I'"
§
en en'"
>-0: f-o
"-
-
o-l~
-5 o:l
0
-"- (I) <C
-> >rob Km
11.1 55 12.6 45 9.4 25 9.1 25 9.1 25 10.0 25 9.9 40 10.5 40 9.9 40 11.2 60 11.2 60 11.4 60 11.4 60 11.5 60 11.3 60 10.5 70
12.1 50 11.3 40 11.2 40
12.7 25
11.6 25 11.4 18 13.0 18 12.8 18 10.7 35 10.6 35 10.7 60 8.5 50 10.0 50
1 10.5 50 10.5 50 10.5 50 10.2 50 10.0 40 10.0 50 11.8 60
12.2 40
9.5 30 7.8 35 7.4 35
CWUD
'"'
z
'"
~ ::>~
f-o <C
O;'ta
CLl 1
CuSeCi 3
Cb 3
CuFe 2
CuFe 2
CuFe 5
CuFe 2
CuSe 4
CuCi 2
CuFeCi 4
CuFeCi 4
Ci Tr
FeCi Tr
Fe 1
FeCi 2
FeCi 1
CuCi 3
CuFe 3
CuFe 3
CUFe 3
Cu 1
eLI
1CU 5
CU 4+
CUSe 3
CU 3
CuFe 3
FeCi 1
FeCi 3
FeCi 1
CuCi 1
FeCi 2
CUCi 1
CUScCi 4
CuFeSe 1+
FeSeCi 1+
FeCuSe 5
CUFe 3
CUCb
;~
[image:35.608.56.548.89.842.2]Table 4
(Contd. )
>-<
"
f-o~
<
.
<
...l~
E;l ""'0 ~
;:a f-o
Nov
10 1124 12 1016 12 1120 12 1212 23 1114
Dae
19 1036 24 1000 24 1344 30 0956
(j
:z
<
~f-o E
'"
'"
~c ~ til
N
'"
-
'"
:0;i=
""'
~:z c::
OJ ~
N
<
69.4 2.89 73.1 3.47 70.1 2.96 69.6 2.89 73.0 p.47
77.6 ~. 75 79.8 ~.62 78.7 p.09 f79.9 ~.66
32
-INSTA~TA~cO~ VALUES
RADIATIO'l
.,---~
....
~
8
~OJ
'"
ID0 0
c:: > c::
~
'"
9
'"
:l
"
...l&l
OJ~
U c:: c::
~10- ~10- ~10- 1"10 - J
705 488 591 399 7C9 499 602 407 754 523 635 426 764 526 640 432 698 478 588 382
611 434 522 358 669 481 572 387 620 461 547 375 632 473 555 386
2
(mW fern )
OJ
§
OJ
!;:
§
c::'"
'"
OJ
'"
OJ :;
c:: OJ
...
f-omb
°c
02-1 9.7 p-014 7.5 014 8.3 "014 8.3 019 9.4
1032 7.7 1012 5.6 1012 8.4 1010 5.0
1979
I
I
'"
§
til
'"
OJ
>-g;
f-o~
...l
§
~Cl
0 ~
'"
'"
'"
'"
<
~>-> > f-o
mb Km
9.4 30 ColCb
7.0 50 SeCi
6.8 50 SeCi
6.8 50 Se
8.1 30 Co
7.0 20 CU
8.1 30 CU
8.2 40 CuFe
7.3 45 CuFe
[image:36.597.54.540.93.735.2]". " • •
Tnb1 ... 5 VALENT IA DAILY TOfAIB OF D rrlEcr SOlAR RADIATION AT NORMAL INCIDENCES (J/cm ) 2 1979
Month Jlln Feb Mar Apr May June July Aug' Sept Oct Nov Dec
Day 1 1446 9 4 1363 1808 2504 386 464 467 1 759
a
2 329 2137 17 1153 1277 2799 72 184 385 10 1
a
3
a
8 115 2310 2112 465 1705 1679 233 1412a
1554 191
a
39 2185 3178 1768 5 272 192 1998 357a
5 479
a
297 1165 2186 1516 2150 615 85 396a
13I
6
I
13a
945 488 136 401 1005a
1030 1137 1 17 30 721 651 249 8 392 15 627
a
304 559a
8 I 33
a
a
261 3 3 82a
159 68 414 102,
9 I 155
a
708 2366 204 44 125 456 895 316 411a
i
I
i
I 10 371 102 2 5 2 3 405 8 273 436 657 5
,
11
,
I 255
a
598 935a
1781 406a
a
748 21 26012 I 77 103 97 72 1246
a
650 19 388 696 1472 43I
13 I 9a
1420 1122 3 700 586 33 293 340 148a
14
,
Ia
a
1601 302 1572 244 532 526 1414 1479 777a
15
,
I 0 1814 775 2744 131 1005 2829 2235 1785 350 101 27916 , 100
a
15 3450 1162 2628 77 14 377 906 119a
I I
i
17 I 1245a
6 3 480 3175a
775a
4a
201I
w
18 : I 3 1509 169 49 1539 2467 197 459
a
40 121 17 wI
19 I 151a
1017 743 170 2722 741 616 1320 686a
478I
20 I 4
a
347 676 1941 279 132 6 1597 1178 12 249I
21,
200 427 1155 258 2170 719 1003 1721 859 945a
23222
I
0 1214 2570 21 1671a
526 644 1 634 0a
, I
I
23 I 535 969 1046 450 1474 2294a
39 2466 1746 752 5824 630 91 2 1633 1241 10173 222 9 4
a
150 92325 863 346
a
1819 2011 1622 316 929 4 520 0 426 242 61 289 977 1419 34 51 1502 414 1367
a
a
27 1169
a
171 11 1536a
211 2735 2283 901a
96I 28 237 610 598 7 910 296 20 1940 2573 826 0 294
I 29 6 1140 153 526 41 133 2837 5 3
a
·128I
30 410 631 349 3332 598 199 372 4 50 14 963I
31 1 390 1755 860a
631a
Total 9199 10129 17474 27325 37209 31973 15641 21710 19506 20128 7149 4601