Fossil-fuels, bio-fuels and food: Raking
priorities
Dias, Guilherme Leite da Silva and Guilhoto, Joaquim José
Martins
University of São Paulo
2010
Online at
https://mpra.ub.uni-muenchen.de/30733/
Guilherme Leite da Silva Dias
Department of Economics, FEA - University of São Paulo E-mail: guildias@usp.br
Joaquim José Martins Guilhoto
Department of Economics, FEA - University of São Paulo REAL, University of Illinois; and CNPq Scholar
E-mail: guilhoto@usp.br
Abstract
This paper deals with the question of the trade-offs between bio-fuels, fossil-fuels, and food. To do so an analysis is conducted taking into consideration the differences in relative prices and in the productive structure among the countries. The results shows that in general food puts a greater stress over the economies than energy does, and mainly in the developing economies. As a consequence of that, the possibilities for the growing use of bio-fuels is limited and restrict to countries where it is possible to have an expansion of bio-fuel production without compromising the production of food and without putting more stress over the environment. This, by its turn, restricts the possibilities for a world policy of bio-fuels with the consequence that bilateral agreements would be the dominant ones.
1. Is There a Possible Common Policy for Bio-fuels?
The answer is no, because bio-fuel demand and supply is commanded by a set of
country specific restrictions. Rising food cost is a very sensitive issue for low income
countries, also in countries that have experienced famine due to social or political
upheavals. Global energy crisis increases average cost of energy everywhere but
uncertainty about energy supply has many different forms according to the availability
of alternative primary sources and access to traded complementary sources. Global
Warming awareness is becoming another constraint on fossil fuels and energy
efficiency but widely different between countries. A further complication draws upon
the fact that those three restrictions are not independent, for any change in one of them
as for instance the rising cost of oil, the impact upon food supply is negative and many
countries will make more use of coal as an alternative source for thermal electricity.
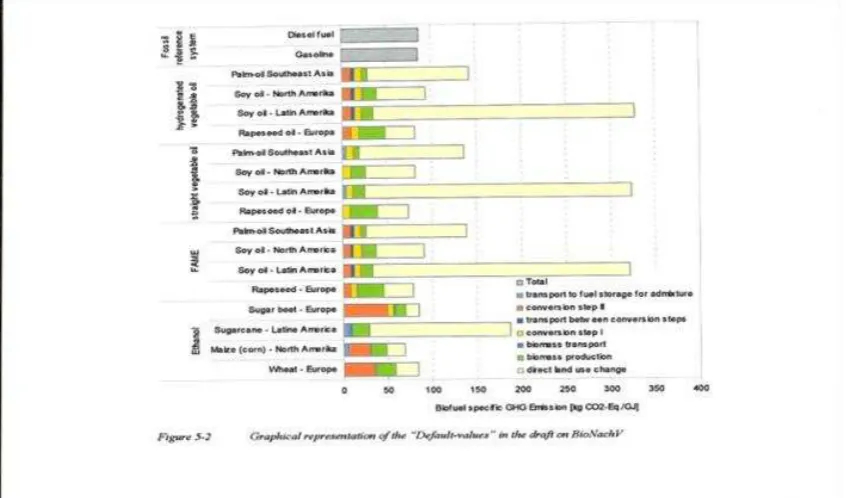
The implications of biofuels production on emission of green house gases and
the net effect of the substitution of fossil fuels cannot be underestimated. By the end of
2007 German government issued a draft of the biomass sustainability ordinance, with
the inclusion of a first assessment of land use changes following recommendations from
the IPCC report. Given a certain set of default values and the assumption that sugar
cane and soybean expansion in Latin America comes from conversion of savannah soils
to cropland, and palm oil in Southeast Asia from rainforest, an amazing set of results
depicted in Figure 1 below, contributed to a halt on fiscal incentives to bio-fuel
production in Germany and imports without previous certification.
Many other countries followed suit and to complicate matters further the bubble
on food market prices created a dismal picture for bio-fuels. The two following sections
deals with pricing bio-fuels as a substitute for fossil fuels and the wide dispersion
between countries on the role of food and energy sectors suggesting that bilateral trade
agreements is a better strategic alternative to Brazil than the current choice of a globally
Figure 1 - Green House Emissions by Alternative Bio-fuels
2. Trade Opportunities
In this section we address the issue of bio-fuels prospective trade opportunities
or, in another way to put it, can bio-fuels become commodities regularly traded in spot
and future markets?
Fossil fuels although traded regularly have a substantial share traded under long
term contracts to give enough security on the issue of access, even though contracted
price may fluctuate according to some formulae related to spot and future market
references. The majority of fossil fuel reserves are state property or state controlled corporation’s property. Market uncertainty is not left to speculation by economic agents but handled as a national security affair consequently it is priced and supplied by a
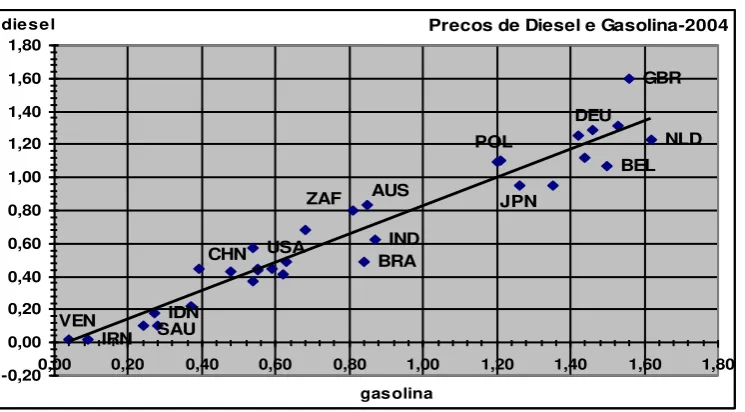
myriad of alternative structures in each nation. Average prices collected on an annual
basis reflect this diversity as in Figure 2 below, domestic indirect taxation more than
Figure 2 – WDI / Diesel & Gasoline Prices, 34 Countries.
Precos de Diesel e Gasolina-2004
POL BEL VEN SAU CHN DEU BRA USA IRN NLD GBR IDN ZAF IND JPN AUS -0,20 0,00 0,20 0,40 0,60 0,80 1,00 1,20 1,40 1,60 1,80
0,00 0,20 0,40 0,60 0,80 1,00 1,20 1,40 1,60 1,80
gasolina diesel
This sample of 34 countries adds to 85% of the world consumption of energy.
The lowest prices are found in typical oil exporting economies, for a $0,20 per gallon of
diesel gasoline is priced at $ 0,28; in a middle group of countries (Brazil and USA
included), for a diesel of $ 0,60 gasoline is at $ 0,76; for the group of high priced liquid
fuels, diesel goes for $1,20 and gasoline for $1,44. This is not the kind of price
dispersion that we expect from a level playing field type of market structure but is a real
picture of a crystallized diverse set of national regulated markets.
The current generation of biofuels consists of basic agricultural products
subjected to well known transformation procedures, mostly fermentation and chemical
reaction. It is essentially a joint production system of multiple products, that could be
organized as a regular market system. Most used agricultural products- sugar cane, maize, wheat, soybean,….- have only been traded under a global market system since the Uruguay Round (1995), for fifty years after the II World War the spectrum of
chronic starvation prevented most nations to abandon the objective of self sufficiency
and protectionism. Against the uncertainty of agricultural production many countries
have shown a preference for building stocks of basic food products and occasionally
getting rid of their high cost of maintenance by exporting at subsidized prices. Food
uncertainties around market access in exchange for domestic inefficient production and
failures in the pursuit of self sufficiency.
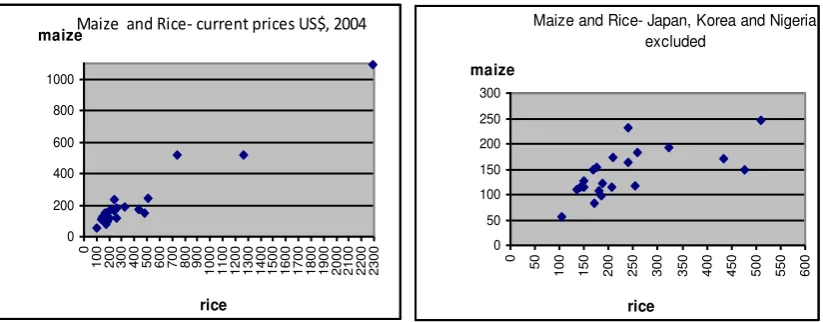
Price dispersion among basic agricultural commodities is not as wide as with
fossil fuels but still far away from normally traded manufactured products. Figures 3, 4
and 5 show alternative ways for comparison. Excluding Japan, Korea and Nigeria (most
protected agricultural markets) in a three fold range of prices we find 25 wheat
producing countries (out of those 34 countries seen before), in a five fold range we
include another 24 maize producing countries, and in a ten fold range we include 19 rice
producing countries. Ten years after the Uruguay Round what we have is still a diverse
set of national regulated markets
[image:6.595.97.509.339.500.2]
Figure 3 - FAO/Maize&Rice Prices for 19 Countries
Figure 4 – FAO / Maize & Wheat Prices, 25 Countries
Maize and Wheat-current prices US$, 2004 NGA KOR JPN 50 250 450 650 850 1050
50 250 450 650 850 1050 1250
wheat maize 50 100 150 200 250
50 100 150 200 250 300
Maize and Wheat - Japan, Korea and Nigeria excluded
Maize and Rice- Japan, Korea and Nigeria excluded 0 50 100 150 200 250 300 0 50
100 150 200 250 300 350 400 450 500 550 600
rice maize 0 200 400 600 800 1000 0
100 200 300 400 500 600 700 800 900 1000 1100 1200 1300 1400 1500 1600 1700 1800 1900 2000 2100 2200 2300
rice
[image:6.595.89.509.557.744.2]Figure 5 – FAO / Rice & Wheat Prices, 24 Countries
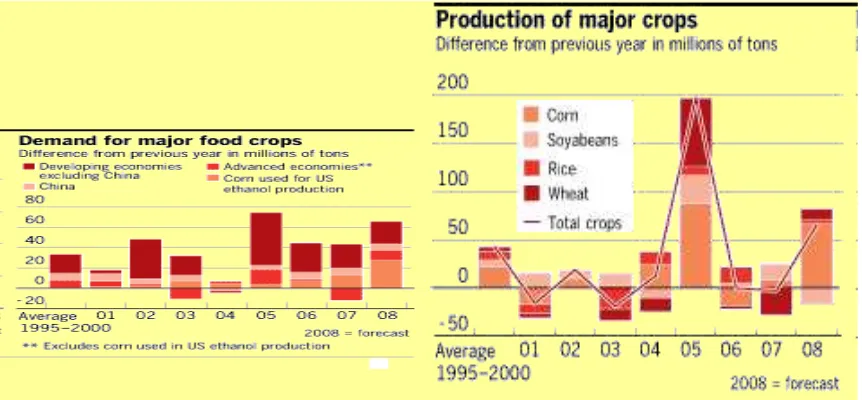
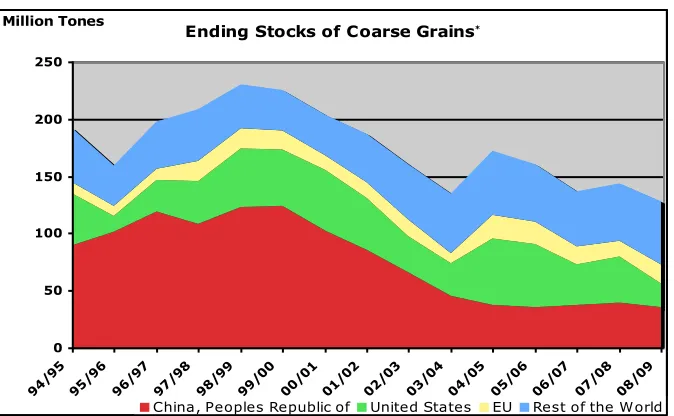
Recent market volatility is reminding us of how limited is food security under a
free market framework. Global demand for food was raised to unprecedented level due
to the dominant role played by emerging economies and global supply did not respond
in order to keep inventories at a safe level; Figure 6 reports data on demand by group of
countries, demand for corn by ethanol producers, and on global supply of major crops.
Figure 6 - World Demand and Supply of Major Crops
Inventories decreased for almost a decade, prices became more volatile since
2002/2003 and extremely speculative in 2007/2008 when a few countries raised export
NGA KOR
JPN
100 300 500 700 900 1100 1300 1500 1700 1900 2100 2300
50 250 450 650 850 1050 1250
Rice and Wheat- current prices US$, 2004
50 100 150 200 250 300 350 400 450 500 550
50 100 150 200 250 300
Rice and Wheat, Japan, Korea and Nigeria excluded
[image:7.595.85.516.489.689.2]restrictions (Central Europe on wheat, and South Asian countries on rice), Figure 7
below. One explanation points to a major fault in WTO regulation, because it lacks in
safeguard clauses when global inventories are at extremely low levels, requiring from major suppliers’, government supported prices above international market prices in order to induce inventory accumulation. There is no built in incentive for individual
countries to behave in a manner consistent with global common interest, they have to
[image:8.595.90.427.267.475.2]bare the costs of inventory build up and collect no benefit from doing it.
Figure 7 - End of the Year Inventories of Coarse Grains.
Ending Stocks of Coarse Grains*
0 50 100 150 200 250
94/9 5
95/9 6
96/9 7
97/9 8
98/9 9
99/0 0
00/0 1
01/0 2
02/0 3
03/0 4
04/0 5
05/0 6
06/0 7
07/0 8
08/0 9
Million Tones
China, Peoples Republic of United States EU Rest of the W orld
Bio-fuels are close substitutes to fossil-fuels as such subjected to specific
national market structures. Mandatory blending requirements are common for biodiesel
and ethanol, standards of energy efficiency and environment protection must be similar
to fossil fuels. Pricing must also be consistent to the regulatory framework applied to
fossil fuels, which differs widely between countries. Food security and agricultural price
policy are part of an independent set of regulatory framework, both with a strong
historical heritage. There is a lot of work to be done in order to make these two sets of
regulations consistent within each country, much more so between countries.
As an example from Germany, in July 2007, pump average price of diesel was
US$ 1.62 per liter (at current exchange rate); assuming that the highest share for
vegetable oil cost is 72% of pump price in order to warrant a good profit for industry
(0.92 kg of vegetable oil for 1 liter of biodiesel). Soon after the northern hemisphere
harvest, CBOT future price for soybean was just above the $1300 level. After March of
2008, when most subsidies where abandoned in Europe, price began to fall
dramatically.
3. Food, Energy, Prices and Productive Structure
There is a close relation between the role that food and energy play in the
productive structure of the countries and how the countries will react to policies related
to fossil-fuel, bio-fuels and food.
To better analyze this relation we have select eight countries with different
levels of development and which are important players in the world in terms of food and
energy consumption and production. The selected countries are Argentina, Brazil,
China, India, United States, France, Germany and Japan.
The basis for the analysis are the comparable Input-Output Matrices released by
OECD (see OECD, 2006), and which refers to the year of 2000 for Brazil, China, USA,
France, Germany and Japan, the year of 1997 for Argentina, and the year of 1998/99 for
India.
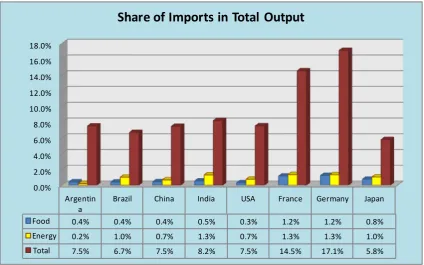
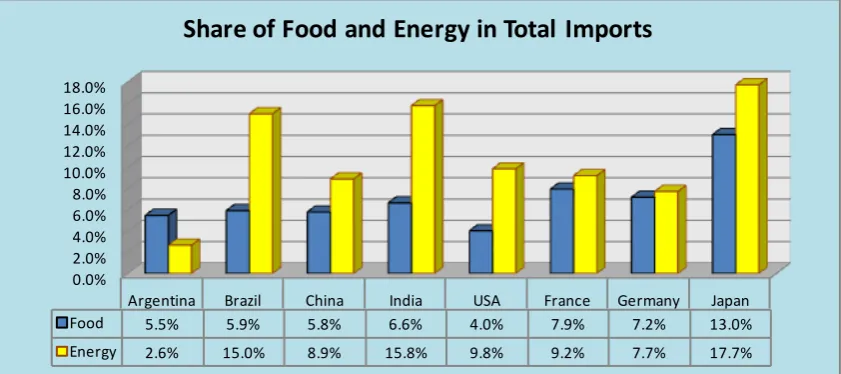
Figure 8 shows the shares of total value of imports, food imports, and energy
imports in the total value of production of the select countries, while Figure 9 shows the
share of food and energy in total imports. From these figures it is possible to see that
France and Germany are the more opened economies, with imports representing
respectively 14.5% and 17.1% of their total output, while for the other economies the
share of imports varies between 5.8% and 8.2%. As for food and energy imports, they
represent a small share of the total value o production, between 0.4% and 1.2% for food
and between 0.2% and 1.3% for energy. In all the other countries being analyzed, with
the exception of Argentina, the share of energy imports are higher than the share of food
imports, and in the cases of Brazil, India and USA energy has more than the double of
importance of the food imports.
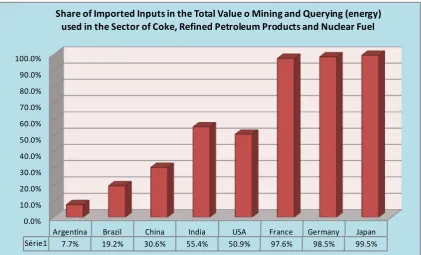
Figure 10 shows the role played by imports of food and energy in total
disposable food and energy, while Figure 11 shows the share of imported inputs in the
the countries it is possible to see that imported energy has a high share in the total
disposable energy for the countries being considered than food has, with special
importance for France (25.1%), Germany (25.6$), and Japan (18.3%), followed by India
(14.0%) and USA (14.2%), an in a lesser scale China (7.2%), Brazil (10.9%) and
Argentina (4.8%). However, it is possible to see the high dependence that France,
Germany and Japan have on imported inputs for energy production, more than 98%,
followed by India (55.4%), USA (50.9%), China (30.6%), Brazil (19.2%), and
Argentina (7.7%). As for food consumption the higher dependence on imports is found
in Germany (20.9%), France (16.2%), and Japan (10.6%), followed by USA (6.7%),
while in the other countries the dependence is less than 4%.
In summary, from the analysis of Figures 8 to 11 it is possible to see that in
terms of imports, energy is more important than food and that, with the exception of
Brazil and Argentina, there is a high dependence of the other economies on imports of
[image:10.595.86.511.412.677.2]primary energy for secondary energy production.
Figure 8 – Share of Imports in Total Output of Selected Developing and Developed Countries
0.0% 2.0% 4.0% 6.0% 8.0% 10.0% 12.0% 14.0% 16.0% 18.0%
Argentin a
Brazil China India USA France Germany Japan
Food 0.4% 0.4% 0.4% 0.5% 0.3% 1.2% 1.2% 0.8%
Energy 0.2% 1.0% 0.7% 1.3% 0.7% 1.3% 1.3% 1.0% Total 7.5% 6.7% 7.5% 8.2% 7.5% 14.5% 17.1% 5.8%
Share of Imports in Total Output
Note: Argentina refers to 1997; Brazil, China, USA, France, Germany, and Japan to 2000; and India to 1998/99.
Figure 9 – Share of Food and Energy in Total Imports of Selected Developing and Developed Countries
0.0% 2.0% 4.0% 6.0% 8.0% 10.0% 12.0% 14.0% 16.0% 18.0%
Argentina Brazil China India USA France Germany Japan Food 5.5% 5.9% 5.8% 6.6% 4.0% 7.9% 7.2% 13.0% Energy 2.6% 15.0% 8.9% 15.8% 9.8% 9.2% 7.7% 17.7%
Share of Food and Energy in Total Imports
Note: Argentina refers to 1997; Brazil, China, USA, France, Germany, and Japan to 2000; and India to 1998/99.
Source: Estimated from OECD (2006)
Figure 10 – Share of Imported Food and Energy in Total Disposable Food and Energy of Selected Developing and Developed Countries
0.0% 5.0% 10.0% 15.0% 20.0% 25.0% 30.0%
Argentina Brazil China India USA France Germany Japan Food 3.9% 2.9% 2.8% 2.2% 6.7% 16.2% 20.9% 10.6% Energy 4.8% 10.9% 7.2% 14.0% 14.2% 25.1% 25.6% 18.3%
Share of Imported Food and Energy in Total Disposable Food and Energy
Note: Argentina refers to 1997; Brazil, China, USA, France, Germany, and Japan to 2000; and India to 1998/99.
[image:11.595.88.511.425.667.2]Figure 11 – Share of Imported Inputs in the Total Value of Mining and Querying (energy) used in the Sector of Coke, Refined Petroleum Products and Nuclear Fuel of Selected Developing and Developed Countries
0.0% 10.0% 20.0% 30.0% 40.0% 50.0% 60.0% 70.0% 80.0% 90.0% 100.0%
Argentina Brazil China India USA France Germany Japan Série1 7.7% 19.2% 30.6% 55.4% 50.9% 97.6% 98.5% 99.5%
Share of Imported Inputs in the Total Value o Mining and Querying (energy) used in the Sector of Coke, Refined Petroleum Products and Nuclear Fuel
Note: Argentina refers to 1997; Brazil, China, USA, France, Germany, and Japan to 2000; and India to 1998/99.
Source: Estimated from OECD (2006)
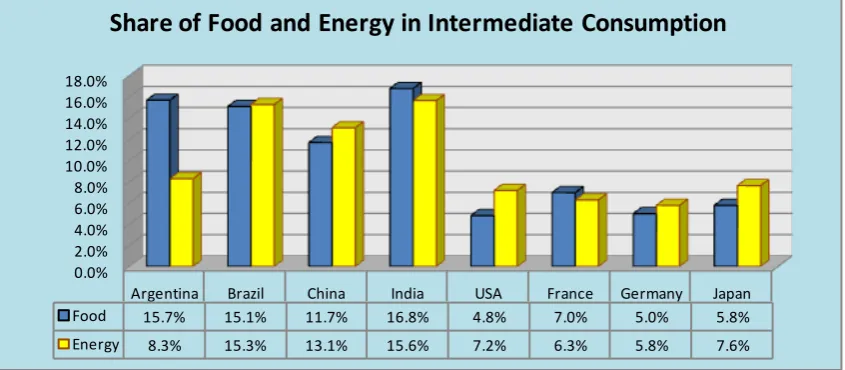
Figures 12 to 14 show the importance of food and energy for production
(intermediate consumption), final demand and in the total output of the economy.
For the intermediate consumption, the economies being considered can be
divided into two groups, the first one consisting of developing economies - Argentina,
Brazil, China, and India – in which the added shares of food and energy into
intermediate consumption are between 24% and 32%, and the developed economies –
USA, France, Germany, and Japan – which the added share are between 12% and 14%,
i.e., less than half of the shares observed for the developing economies. Inside each
country, on general the shares observed for food are close to the ones observed for
energy, with the exception of Argentina (food, 15.7%, and energy, 8.3%), USA (food,
4.8%, and energy, 7.2%), and Japan (food, 5.8%, and energy, 7.6%).
As for the final demand shares, energy in all of the economies being considered
represent less than 3% of the final demand, however, for food, its share goes from 4.1%
in the USA to 28.4% in India. In the developed economies being considered, the share
[image:12.595.88.510.116.371.2]13% for Argentina and Brazil, going to 19.3% in China and 28.4% in India. This
structure shows the importance of food in less developed economies, due to the
structure of consumption of the low income classes where food has a greater relative
importance than the other consumer goods.
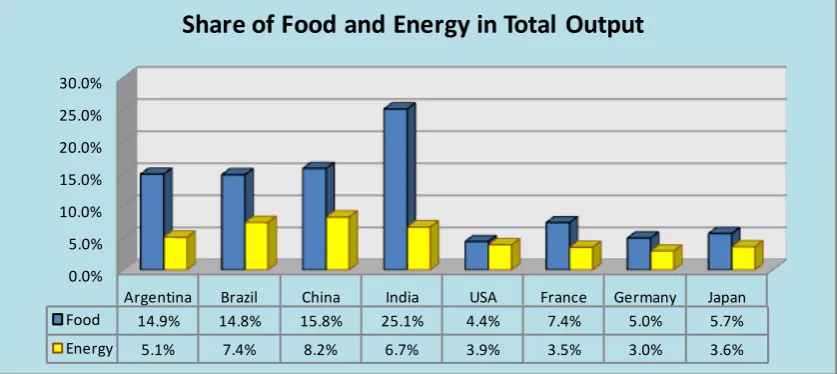
Overall, i.e., considering the total output in the economy, as show in Figure 14,
the share of energy in total output in the developing economies (around 7.0%) is about
double of the one found in developed economies (around 3.5%). As for food, Argentina,
Brazil and China have a share of around 15% of the total output, while for India the
share is of 25.1% and for the developed economies the share is between 4.4% for the
USA and 7.4% for France. This again reinforce the results found above, showing the
relative low importance of food and energy for the developed economies, in terms of
[image:13.595.88.511.389.574.2]value of production, when compared to its importance in less developed economies.
Figure 12 – Share of Food and Energy in Intermediate Consumption of Selected Developing and Developed Countries
0.0% 2.0% 4.0% 6.0% 8.0% 10.0% 12.0% 14.0% 16.0% 18.0%
Argentina Brazil China India USA France Germany Japan Food 15.7% 15.1% 11.7% 16.8% 4.8% 7.0% 5.0% 5.8% Energy 8.3% 15.3% 13.1% 15.6% 7.2% 6.3% 5.8% 7.6%
Share of Food and Energy in Intermediate Consumption
Note: Argentina refers to 1997; Brazil, China, USA, France, Germany, and Japan to 2000; and India to 1998/99.
Figure 13 – Share of Food and Energy in Final Demand of Selected Developing and Developed Countries
0.0% 5.0% 10.0% 15.0% 20.0% 25.0% 30.0%
Argentina Brazil China India USA France Germany Japan Food 13.1% 12.8% 19.3% 28.4% 4.1% 7.7% 5.5% 6.1% Energy 2.8% 1.8% 1.4% 1.7% 2.2% 2.7% 2.0% 1.9%
Share of Food and Energy in Final Demand
Note: Argentina refers to 1997; Brazil, China, USA, France, Germany, and Japan to 2000; and India to 1998/99.
Source: Estimated from OECD (2006)
Figure 14 – Share of Food and Energy in Total Demand of Selected Developing and Developed Countries
0.0% 5.0% 10.0% 15.0% 20.0% 25.0% 30.0%
Argentina Brazil China India USA France Germany Japan Food 14.9% 14.8% 15.8% 25.1% 4.4% 7.4% 5.0% 5.7% Energy 5.1% 7.4% 8.2% 6.7% 3.9% 3.5% 3.0% 3.6%
Share of Food and Energy in Total Output
Note: Argentina refers to 1997; Brazil, China, USA, France, Germany, and Japan to 2000; and India to 1998/99.
Source: Estimated from OECD (2006)
This directly reflects on the disposable value added generated in the economies
being considered here, Figure 15. While for China and India the combined importance
of food and energy is respectively of 31.4% and 35.2%, for Brazil is 18.1%, for
[image:14.595.91.510.424.611.2]exception of the USA, in all the other countries food has a greater share in the economy
than energy.
As can be seen in Figure 16, the relation between food and energy in the
generation of the disposable domestic value is 0,73 for the USA, around 1,50 for Brazil,
France, Germany, and Japan, around 2,2 for Argentina and China, and of 5,1 for India.
As a consequence of that, one can see that a policy of bio-fuels that would imply a
substitution of food for energy, with the exception of the USA, will put more stress over
the economies than a policy of price increase of energy and/or a policy of substitution of
fossil-fuel energy from other sources than bio-fuels energy.
Figure 15 – Share of Disposable Domestic Value Added of Food and Energy in GDP of Selected Developing and Developed Countries
0.0% 5.0% 10.0% 15.0% 20.0% 25.0% 30.0%
Argentina Brazil China India USA France Germany Japan Food 8.6% 10.7% 21.4% 29.4% 2.6% 5.2% 3.7% 5.2% Energy 3.7% 7.4% 10.0% 5.8% 3.6% 3.5% 2.7% 4.2%
Share of Disposable Domestic
Value Added in the GDP
Note: Argentina refers to 1997; Brazil, China, USA, France, Germany, and Japan to 2000; and India to 1998/99.
[image:15.595.92.486.313.516.2]Figure 16 – Relation of Disposable Domestic Value Added Between Food and Energy of Selected Developing and Developed Countries
0.00 1.00 2.00 3.00 4.00 5.00 6.00
Argentina Brazil China India USA France Germany Japan Série1 2.36 1.46 2.14 5.09 0.73 1.49 1.37 1.26
(VA + VAM - VAE) Relation: Food / Energy
Note: Argentina refers to 1997; Brazil, China, USA, France, Germany, and Japan to 2000; and India to 1998/99.
Source: Estimated from OECD (2006)
The relative importance of food and energy in the economies can also be
estimated by measuring the price transmission effects of a price increase in the
economy, as displayed in Figures 17 and 18 that show the impact of a 10% increase,
respectively, of food and energy over the wholesale price index (WPI) and the consumer
price index (CPI). The results show, as expected, that the increase of food price will
have a greater impact over the CPI while the increase of energy price will have, with the
exception of France and Germany, a greater impact over the WPI. Also, the impact on
the CPI due to an increase of food price is greater than the one due to an increase of
energy price, in all the countries being considered here. As for the impact of food and
energy prices over the WPI, one has that for Argentina and India the impact of food
prices are clearly greater than the impact of energy prices, while for the other countries
being considered, there are only slight differences between the impact of food and
energy prices.
However, it must be stressed that impacts over the developing economies are
greater than the ones in the developed ones. For food, while one has at most an impact
of 1.56% in the WPI of France, for the developing countries it starts at 1.67% in the
WPI of Argentina and goes up through 5.0% in the CPI of China. For an increase in the
energy prices, the impact over Brazil, China and India are clearly greater than the one
[image:16.595.87.485.102.270.2]As a reflect of this, there is enough room for the developed countries being
considered here, mainly France, Germany and Japan to practice polices of high prices
on the energy with lower impact over the economy, as they are used to do.
Special attention need to be paid to China, due to its size and important role in
the world trade. From the above analysis it is clear the importance of cheap food and
energy for the development of China and the adverse impacts that an increase in their
prices will have over the Chinese economy, internally and in its competitivity in the
[image:17.595.87.510.302.541.2]international market.
Figure 17 – Impact of a 10% Change on the Price of Food on the Wholesale Price Index (WPI) and on the Consumer Price Index of Selected Developing and Developed Countries
0.00 0.50 1.00 1.50 2.00 2.50 3.00 3.50 4.00 4.50 5.00
Argentina Brazil China India USA France Germany Japan WPI 1.67 1.78 2.18 2.83 0.58 0.86 0.62 0.69 CPI 1.79 2.32 5.00 4.84 0.78 1.56 1.27 1.42
Impact of a 10% Change on the Price of Food on the
Wholesale Price Index (WPI) and on the Consumer Price Index (CPI)
Note: Argentina refers to 1997; Brazil, China, USA, France, Germany, and Japan to 2000; and India to 1998/99.
Figure 18 – Impact of a 10% Change on the Price of Energy on the Wholesale Price Index (WPI) and on the Consumer Price Index of Selected Developing and Developed Countries
0.00 0.50 1.00 1.50 2.00 2.50 3.00 3.50 4.00 4.50 5.00
Argentina Brazil China India USA France Germany Japan WPI 0.86 1.72 2.35 1.50 0.73 0.66 0.65 0.84
CPI 0.57 1.25 1.36 0.93 0.62 0.78 0.73 0.72 Impact of a 10% Change on the Price of Energy on the
Wholesale Price Index (WPI) and on the Consumer Price Index (CPI
Note: Argentina refers to 1997; Brazil, China, USA, France, Germany, and Japan to 2000; and India to 1998/99.
Source: Estimated from OECD (2006)
The above also implies that the substitution of fossil-fuel for bio-fuel will be
only feasible in countries that have enough land to expand the bio-fuel production
without compromising the production of food or putting more stress over the
environment. In the Brazilian case, Figures 19 to 21 that display, respectively, the stress
over the Brazilian territory of cattle, soybean, and sugar cane production in 1995 and
2006, show that the cattle production is putting a stress over the Amazon forest, and the
land left behind, due to its expansion, are being occupied by soybean production. On the
other hand, the sugar cane production seems to have its own pattern of growth without
putting much stress over the environment, and food production, in the period being
[image:18.595.89.509.103.346.2]Figure 19 – Cattle Production Stress over the Brazilian Territory – 1995 and 2006
Legenda
Numero de cabeças 4 - 50,000
50,001 - 150,000
150,001 - 250,000
250,001 - 400,000
400,001 - 600,000
600,001 - 800,000
800,001 - 1,200,000
1,200,001 - 2,000,000
Bovinocultura
Ano 1995
Fonte: Adaptado de Pesquisa Pecuária Municipal - IBGE
Visão Tridimensional
Legenda
Numero de cabeças 4 - 50,000
50,001 - 150,000
150,001 - 250,000
250,001 - 400,000
400,001 - 600,000
600,001 - 800,000
800,001 - 1,200,000
1,200,001 - 2,000,000
Bovinocultura
Ano 2006
Fonte: Adaptado de Pesquisa Pecuária Municipal - IBGE
Figure 20 – Soybean Production Stress over the Brazilian Territory – 1995 and 2006
Soja
Ano 1995
Fonte: Adaptado de Pesquisa Agrícola Municipal - IBGE
Visão Tridimensional
Legenda
Quantidade em Toneladas
0 - 30,000
30,001 - 80,000
80,001 - 150,000
150,001 - 250,000
250,001 - 400,000
400,001 - 700,000
700,001 - 1,100,000
1,100,001 - 1,800,000
Soja
Ano 2006
Fonte: Adaptado de Pesquisa Agrícola Municipal - IBGE
Visão Tridimensional
Legenda
Quantidade em Toneladas 0 - 30,000
30,001 - 80,000
80,001 - 150,000
150,001 - 250,000
250,001 - 400,000
400,001 - 700,000
700,001 - 1,100,000
Figure 21 – Sugar Cane Production Stress over the Brazilian Territory – 1995 and 2006
Cana de Açúcar
Ano 1995
Fonte: Adaptado de Pesquisa Agrícola Municipal - IBGE
Visão Tridimensional
Legenda
Quantidade em Toneladas
0 - 50,000
50,001 - 100,000
100,001 - 250,000
250,001 - 500,000
500,001 - 1,000,000
1,000,001 - 1,800,000
1,800,001 - 3,000,000
3,000,001 - 5,300,000
Cana de Açúcar
Ano 2006
Fonte: Adaptado de Pesquisa Agrícola Municipal - IBGE
Visão Tridimensional
Legenda
Quantidade em Toneladas
0 - 50,000
50,001 - 100,000
100,001 - 250,000
250,001 - 500,000
500,001 - 1,000,000
1,000,001 - 1,800,000
1,800,001 - 3,000,000
4. Concluding Remark
The above analysis has show that in general food puts a greater stress over the
economies than energy does, and mainly in the developing economies. As a
consequence of that, the possibilities for the growing use of bio-fuels is limited and
restrict to countries where it is possible to have an expansion of bio-fuel production
without compromising the production of food and without putting more stress over the
environment. This, by its turn, restricts the possibilities for a world policy of bio-fuels
with the consequence that bilateral agreements would be the dominant ones. As so, an
implication for a world policy would be to start the process of negotiation with bilateral
agreements, than slowly evolving into regional trade, as it is a more realistic framework
for a safe development of bio-fuels markets.
5. References
German Biomass Sustainability Ordinance- commentary paper to the draft, Institute for Energy and Environment, Leipzig, January 2008.
OECD (2006). The OECD Input-Output Database as presented by Norihiko Yamano and Nadim Ahmad (2006), “The OECD Input-Output Database: 2006 Edition”. STI Working Paper 2006/8. Statistical Analysis of Science, Technology and Industry.