Construct validation of supply chain
management in cooperative
Idris, Nurjihan and Arshad, Fatimah Mohamed and Radam,
Alias and Ali, Noor Azman
Institute of Agriculture and Food Policy Studies, Universiti Putra
Malaysia, 43400 UPM Serdang, Selangor, Malaysia, Faculty of
Economics and Management, Universiti Putra Malaysia, 43400
UPM Serdang, Selangor, Malaysia
3 December 2009
Online at
https://mpra.ub.uni-muenchen.de/19483/
*Corresponding author: Tel.: 603-8947 1067
Email adresses: nurjihanidris@gmail.com (N. Idris), alias@econ.upm.edu.my (A.Radam),
fatimah@econ.upm.edu.my (F.M. Arshad), nazman@econ.upm.edu.my (N.Ali)
cooperative
Nurjihan Idrisa*, Fatimah Mohamed Arshada, Alias Radama, and Noor
Azman Alib
a
Institute of Agriculture and Food Policy Studies, Universiti Putra Malaysia, 43400 UPM
Serdang, Selangor, Malaysia
b
Faculty of Economics and Management, Universiti Putra Malaysia, 43400 UPM Serdang,
Selangor, Malaysia
This study attempts to analyze construct in supply chain and to determine
which construct contribute to performance of agricultural cooperatives in
Malaysia. The primary data is collected via questionnaire from top level
management of agricultural cooperatives using 5-item Likert scale. Factor
analysis and structural equations modeling were used to analyze the data.
Findings show that cooperatives places importance on quality and technology,
logistic, supplier and governance. As a whole, supply chain is significance in
determining performance. However, governance alone is not significant in
determining performance. The empirical result could be used to improve
further studies in supply chain management.
Introduction
A cooperative can be defined as a business that is owned and controlled by the
people who use its services and whose benefits are shared by the users on the
basis of use (USDA, 2002). In rural areas, cooperatives enable local people to
organize and improve their conditions collectively compared to private
enterprise and government. Cooperatives encourage and sustain
entrepreneurial development, generating productive employment, increasing
income levels and helping to reduce poverty while enhancing social inclusion,
social protection and community-building. Thus, even though cooperatives
directly benefit their members, they also provide positive externalities for the
rest of society and have a transformational impact on the economy (United
Nations, 2009).
There are differences between cooperatives in developed and developing
countries. For example in agricultural cooperatives, differences can be
observed in changing farm demographics, consumer preference, effectiveness
of the Board and organizational management (FFTC, 2006). This argument is
supported by Sharma (1991) as agricultural cooperatives in Asia do face many
problems relating to organizational structure, management, indifference of
members, inter-cooperative relationship, business operations and finances. The
scenario that can be observed from Bangladesh, Pakistan and Philippines is
that if agricultural cooperatives want to serve total needs of farmers and
extending benefits of advanced technology, competent management is
required. Therefore, the functions of the Chairman, the Chief Executive and
In Malaysia, cooperatives originally are initiated in 1922 as an alternative
socio economic system to the capitalistic structure in rural economy. Before
cooperatives, loan was given to farmers by individual loaners, where they tend
to use their economic power to the disadvantage of farmers. The cooperatives
first started to took form as credit and marketing type. Later, different
functional forms are encouraged as the cooperatives also help in eliminating
rural poverty. The marketing cooperatives gain control over the flow of
commodities to the market in the sense that by collectively marketing their
produce, they result in higher market prices and profit rather than depending
on a middleman (Abdul Hamid, 1977).
In 20th century, cooperatives are still viewed as one of the main actuating
institutions for agricultural sector mainly in small producer. A good
reformation on these cooperatives is able to improve the lives of fishermen
and small entrepreneurs. Micro management aspect is important as it upgrade
the role of cooperatives in development of agricultural industries especially
among small farmers and Small Medium Industries (SMI). In May 2007, the
government of Malaysia has approved a bill of Malaysian Cooperatives
Commission 2006 (Malaysia, 2007). This bill was claimed to ensure a good
development of cooperatives that compromises of agricultural and fisheries
cooperatives. There are 842 (14%) agricultural cooperatives from 6,084
Few studies have shown that a large number of agricultural cooperatives that
have been studied are facing multi-dimensional problems that limit their
performance level. Besides of facing insufficient capital, the main problem
that they face is inefficient management and system level and
business/marketing orientation which are not dynamic or developed (Shenoy
and Mohamed Sulaiman, 1996, and Chamhuri Siwar et al,. 1999). Factors
such as knowledge, skill and efficiency are important determinants for
delivering optimum level of production and minimizing cost, while labour
with academic credentials and new technology will increase productivity in
cultivating land (Ahmad, 2006).
Supply chain plays crucial role in adding value in agricultural cooperatives
(Rao and Holt, 2005). In other words, supply chain also enhances
performance. In U.S., New Zealand China and Korea, agricultural
cooperatives play an important part of agriculture because of their effective
supply chain. USDA (2002) supported this argument as the key of success in
agricultural cooperatives is to ensure product quality that satisfies their
customers’ specific preferences, minimum costs subject to meeting the quality
specifications; and that the associated risks are managed within acceptable
levels. In order to achieve this; the common tool used is "supply chain
management". Thus a critical analysis of this study will focus on micro
management aspect, which is supply chain system of agricultural cooperatives
to upgrade the role of cooperatives in development of agricultural industries
The objectives of this research are to analyze the factors or constructs in
supply chain; and to determine which of the construct in supply chain
contribute to performance of agricultural cooperatives in Malaysia.
This study will bring benefit for future research as there is limited quantitative
research found on this topic particularly in Malaysia. Other economic players
and decision makers can benefit as this study provide additional information
such as SKM, MARA, FAMA, LPP, MARDI, BERNAS and others.
Literature Review
Supply chain system is defined as “planning, coordination and control to all
business process in the supply chain system to provide the highest value to the
consumer at the lowest cost and at the same time to give the highest return to
the stakeholder” (Van der Vorst, 2000).
Supply chain can also be defined as a series of physical activities and decision
making is united with good flows, information, rights on goods throughout all
levels and the participant of the organization. The supply chain combines
various mediator and entities for example factories and its suppliers, logistics,
warehouse, wholesaler, processor and consumer. Thus the supply chain can be
defined from the perspective of “network” that connects various participant (or
agent or entity) in the industry. Supply chain can also be defined as “a network
between business entity that is responsible of procurement activity, production
Every entity in the chain has different objective and limitations, but they need
and depends on each other to make sure the supply chain reached its objective,
such as on time delivery, quality and minimizing cost. Thus the performance
of every entity in the supply chain depends on the performance of other entity
and their willingness and ability to coordinate the activities in the supply chain
(Swamintahan et al., 1998).
The management of the performance in the supply chain is important at both
level of individual and organizational. The management of the performance of
supply chain system can be defined as a cycle covering problem identification,
understanding main problem, taking decision to overcome the problem,
validating the data and process (Kuei et al., 2002). Among the important
management aspects are delivery cost, efficiency, fast response, high quality
services and quality of goods. The management of performance has to be done
by all parties in various levels in an organization.
In reality, for an entity to maximize profit in business it has to take a strategy
that will bring benefit to their own entity without disrupting the supply chain
system performance. Based on the supply chain system definition in the
literature, studies have identified six main elements that have been main
indicators that determine the system. These elements are individual, supplier,
A good supply chain will also bring additional benefit to business operation.
Hovelaque et al. (2009) supports this by saying that supply chain models allow
emphasis on operational information, especially in material, information and
financial flows in a marketing cooperative.
It is also equally important to determine variables used for determining
performance. Beamon (1999) did a study on supply chain design and analysis
to determine appropriate performance measures to determine efficiency of
existing system. Performance measures are also use to design proposed system
by placing importance on decision variable that yield highest desirable level of
performance. Among performance measure that can be used are to minimize
cost, minimize average inventory level and to maximize profit.
On the other hand, this study is most interested to know on what variables that
determine or contribute to performance. Aramyan et al. (2007) has developed
a conceptual framework for measuring the performance of agri-food supply
chain, which indicators are grouped in 4 main categories which are efficiency,
flexibility, responsiveness and food quality. These are also viewed as key
performance indicators to as each supply chain member are also evaluated
Methodology
Following Beamon (1999), Kuei et al. (2002), Sahpiro (2007) and Aramyan et
al. (2007), this study tries to measure the performance of management in
supply chain system using six elements in supply chain, namely individual,
supplier, quality, technology and logistic.
This study will evaluate the connection of the elements in supply chain model
and its importance in influencing performance of agricultural cooperatives.
These elements are individual, supplier, governance, marketing, quality
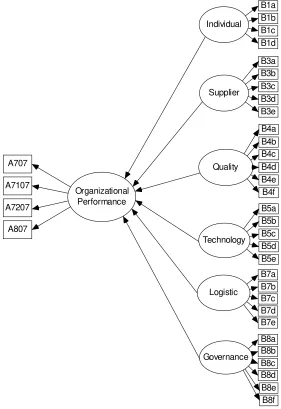
system, technology and logistics. The conceptual model is shown as below in
Figure 1: Conceptual model on how elements in supply chain management
determine organizational performance
Supplier
B3a B3b B3c B3d B3e
Quality
B4a B4b B4c B4d B4e
Technology B5a B5b B5c B5d B5e
Logistic
B7a B7b B7c B7d B7e Individual
B1a B1b B1c B1d
Governance B8a B8b B8c B8d Organizational
Performance
B8e B8f A7207
A7107 A707
A807
B4f
Source: Adopted with modifications from Beamon (1999), Kuei et al. (2002), Shapiro (2007)
and Aramyan et al. (2007)
Primary data is used to achieve the research objectives, which source from
face to face interview using questionnaire with respondent. In the context of
the research, respondent is referring to managers and upper level management
Each part in the questionnaire will be divided into subsections where items
related to each subsection will be asked according to 5-item likert scale.
Elements in the supply chain are divided into subsections of individual,
suppliers, quality, technology, marketing, logistics and governance. To test the
reliability of the data, reliability analysis (Cronbach Alpha) will be done by
SPSS 12.0 and 0.7 is used as indicator (Pallant, 2001). Following Plunkett
(2005), descriptive statistic will be used such as percentile to provide possible
insight relationship between variables.
These data will then be analyzed using factor analysis in SPSS 12.0. The
reason for this is there are many items variable and factor analysis will group
the items variable into a smaller set of factors or components. This is done by
looking at its inter-correlation (Pallant, 2001). The strength of inter-correlation
among the items will be analyzed using Bartlett’s test of sphericity and Kaiser
Meyer Olkin (KMO) measure of sampling adequacy. Factor analysis is
considered appropriate with Bartlett’s test of sphericity less than 0.05 and
KMO index less than 0.6, which is the minimum value (Pallant, 2001).
In addressing the methodology for the objective, the study is interested in
measure of supply chain in affecting economic performance of agricultural
cooperatives. This output of smaller set of factors analyzed using factor
analysis in SPSS 12.0 will then be used as a model for Structural Equations
Modeling AMOS 14.0. Factor analysis is used first to analyze the structure of
interrelationship among a large number of items variables, and to group them
regression model is applied to identify the link between determinants in supply
chain such as individual, supplier, governance, quality system, technology and
logistics.
This model will be estimated by Structural Equations Modeling (SEM).
Following Rao and Holt (2005), SEM estimates a series of separate but
interdependent multiple regression equations simultaneously. This study will
use a linear SEM approach (Bryne, 2001, pp. 287) to validate the causal
relationships between the different latent constructs of determinants of supply
chain. The significance of the overall models is determined by the chi-square
value, degrees of freedom and the associated p-value 0.05. The result will be
first examined for offending estimates, and in assessing the goodness of fit
indices, chi-square statistic will be used. The most important is that parameters
estimates must be significant for the factor to be accepted in the model. In
addition, GFI, AGFI, IFI, CFI, TLI, NFI and RMSEA will be used to measure
the fit of the model (Hair et al., 1998, pp. 610). All variables are expected to
be significant, especially governance and logistic.
Result and Discussion
Data is collected by questionnaire from 192 cooperatives from August –
September 2008. The study has interviewed 252 respondents from 192
cooperatives via survey. The distribution of respondents according to
cooperatives are 152 respondents from agriculture based cooperatives, 12
respondents from fishermen’s cooperatives and 88 respondents from farmer’s
agriculture based cooperatives, 7 fishermen’s cooperatives and 67 farmer’s
cooperatives.
A brief background of respondent’s socio economic profile can be described
as follows. Majority of respondent (88.1%) are male and the rest is female,
while more than half of the respondents (65.2%) are in upper level
management. Most of the respondent (74.3%) is more than 50 years old.
Meanwhile, on education level only 11.3% graduates from university and less
than half (39.3%) has secondary level education, although on cooperatives
experience level, almost all respondent (91.9%) has more than 10 years of
experience in agricultural cooperatives.
To test the reliability of the data, reliability analysis is done by SPSS 12.0 and
the Cronbach Alpha above 0.7 is used as indicator (Pallant, 2001). The result
shows all items variable is highly reliable (0.95) with 31 items. Factors that
contribute are people, supplier, governance, marketing, quality systems,
technology, and logistic.
The data is analyzed using factor analysis in SPSS 12.0. Kaiser Meyer Olkin is
0.65, greater than 0.5 which indicates sample are adequate with small partial
correlations among variables and Bartlett test of equal variance is 0.00 which
is significance at 5% level of significance, stating that the factor model is
appropriate for analysis. The variables are analyzed using Principal
Component Analysis of Factor Analysis then grouped according to rotated
values above 1.0 with total variance explained 74.5%. This output is then used
as the measurement model for Structural Equations Modeling or Confirmatory
[image:14.612.132.486.197.660.2]Factor Analysis. The results are shown in Figure 2.
Figure 2: Validated Model and Path Coefficients
.00
Quality and Technology
.60 B4a er1 .77 .62 B4b er2 .79 .46 B4d er3 .68 .28 B4e er4 .53 .59 B4f er5 .76 .80 B5a er6 .89 .92 B5b er7 .96 .79 B5c er8 .89 .76 B5d er9 .87 .65 B5e er10 .81 .00 Logistic .78 B7a er11 .79 B7b er12 .66 B7c er13 .62
B7d .45 er14
B7e er15 .88 .89 .81 .79 .67 .00 Supplier .66 B3a er16 .78 B3b er17 .64 B3c er18 .90 B3d er19 .84 B3e er20 .81 .88 .80 .95 .92 .00 Individual .22 B1a er21 .34 B1b er22 .90 B1c er23 .60 B1d er24 .46 .58 .95 .77
Chi-square (df) = 933.417 (455); P value (>=0.05) = .000; Relative Chi-Sq (<=2) = 2.051;
TLI(>=0.95) = .825; NFI(>=0.9) = .748; CFI(>=0.9) = .850; Pratio = .862; RMSEA(<=0.08) = .065. (Standardized estimates) .00 Governance .50 B8a er25 .49 B8c er26 .52 B8d er27 .43 B8f er28 .71 .70 .72 .66 .61 Organizational Performance .91 A707 er29 .95 .81 A7107 er30 .90 .89 A7207 er31 .95 .86 A807 er32 .93 er33 .19 .23 -.70 .14 .72 .26 .32 .45 er34 er35 er36 er37 er38 .06
The results are examined for offending estimates, and there are no offending
estimates found in the standardized estimates of coefficients. In assessing the
goodness of fit indices, the p-value of chi-square statistic is 0.00, which
indicates the actual and predicted input matrices are not statistically different.
However, as sample size exceeds 200, chi-square becomes too sensitive and
tends to indicate significant differences. Thus, other measures of goodness of
fit are used (Hair et al., 1998).
Hair et al. (1998) indicates that the goodness-of-fit measures are when GFI,
AGFI, IFI, CFI, TLI and NFI were > 0.90 and RMSEA was < 0.08. The
results (Table 1) show that although the data revealed that the fit statistics for
model does not meet conventional standards, but the model fulfilled the root
mean square of error of approximation (RMSEA= 0.069) below 0.08.
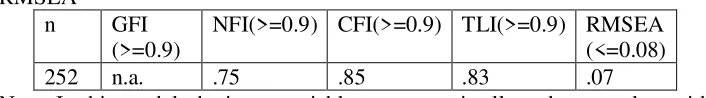
Table 1: Comparison of Goodness of Fit Indices – GFI, NFI, CFI, TLI, RMSEA
n GFI (>=0.9)
NFI(>=0.9) CFI(>=0.9) TLI(>=0.9) RMSEA (<=0.08) 252 n.a. .75 .85 .83 .07
Note: In this model, the items variable error term is allowed to correlate with each other
GFI: Goodness of Fit Index , NFI: Normed Fit Index, CFI: Comparative Fit Index, TLI: Tucker Lewis Index, RMSEA: Root Mean Squared Error Approximation
This result is further strengthen by all parameters estimates are significance at
1% level of significance with loading greater than 0.4 (Table 2). Hair et al.
(1998) states that significance of estimated coefficients is the most obvious
examination of structural equation model. Thus, the model is deemed
[image:15.612.128.481.452.501.2]Table 2: CFA result of loadings, estimates, standard error, critical ratio,
significant p-value and item description for the supply chain model
items variable
Construct Item Statement Loadings Est. S.E C.R (t-value) P Organizational Performance A707 A7107 A7207 A807
Paid capital 2007 Total asset 2007 Profit 2007 Income 2007 .91 .90 .94 .93 1.00 3.33 .27 1.25 * .15 .01 .05 * 22.67 26.83 25.18 * .00 .00 .00 Quality and
Technology B4a B4b B4d B4e B4f B5a B5b B5c B5d B5e
Supplies fulfill standard Product fulfill standard Safety procedure Feedback to complaints Production by demand
New technology Technology efficiency Tech. acceptance level Goods delivery service Technology compatibleness .77 .79 .68 .53 .76 .89 .96 .89 .87 .81 1.00 .98 1.00 .77 .97 1.26 1.22 1.17 1.08 1.09 * .06 .14 .14 .12 .11 .11 .11 .11 .12 * 16.16 7.27 5.47 8.38 10.55 11.28 10.41 10.21 9.33 * .00 .00 .00 .00 .00 .00 .00 .00 .00
Logistic B7a B7b B7c B7d B7e
Cost supplies going in Cost supplies going out Monitor supplies going in Monitor supplies going out Computerized logistic system
.88 .89 .81 .79 .67 1.00 1.06 .98 1.01 0.92 * .09 .10 .11 .12 * 11.69 10.10 9.64 7.51 * .00 .00 .00 .00
Supplier B3a B3b B3c B3d B3e
External supplier Suppliers deliver on time Bargaining power
Corporation between suppliers Relationship with suppliers
.81 .88 .80 .95 .92 1.00 1.02 .94 1.11 1.06 * .09 .10 .09 .09 * 10.85 9.44 12.15 11.61 * .00 .00 .00 .00
Individual B1a B1b B1c B1d
Workers experienced>2 yrs Workers trained > 1year Workers fulfilled standard Mgt commitment to HR
.46 .58 .95 .77 1.00 1.73 2.49 1.88 * .33 .42 .37 * 5.21 5.96 5.96 * .00 .00 .00
Governance B8a B8c B8d B8f Vision/mission Info. sharing Dedicated workers Annual meeting abide law
.71 .70 .72 .66 1.00 .94 .98 .86 * .13 .13 .12 * 7.49 7.63 7.31 * .00 .00 .00 Notes:
* The value do not count because unstandardized regression weight of the item is fixed to default 1 as a required constraint for model
In this model, agricultural viewed quality and technology are viewed as one of
the main factors in determining supply chain management. This variable
places importance on supplies and product fulfilling standard, safety of
procedures and whether the product is demanded by customers. In order to
produce and deliver high quality product, new and efficient technology is
needed. It is also important for workers to accept and is compatible with the
technology. Ahmad (2006) supports this result as a number of agricultural
cooperatives in Malaysia lack competitiveness in the market due to economies
of scale and is currently plagued by inefficiency, uneconomical scale of
operation, low technology and inefficient marketing systems. An important
and effective marketing organization for fresh agriculture produce and
agricultural food products are important and this will require a long term
coordinated consumer-based and quality assurance approach.
Logistic is viewed as an important factor by itself in determining supply chain
management. Transportation is important for carrying the goods from the
supplier to cooperatives, as majority of agriculture cooperatives purpose is to
serve farmers in rural areas. Logistic system is important to minimize delivery
cost of supplies, and by monitoring the delivery and acceptance of supplies
cooperatives can be ensure of the quality of goods is not damaged during the
process of transferring the goods from one place to another. For that, a
computerized logistic system is needed.
Another main factor is supplier, which include farmers in rural areas. It is
time. Through good relationship and corporation between suppliers,
cooperative can increase its bargaining power for cheaper goods to minimize
cost.
Individual or worker is another key factor in determining supply chain. For a
worker to reach maximum productivity and fulfill standard, cooperatives
agreed that a worker must have at least 2 years experience and 1 year training.
Meanwhile, managers must also commit to the development of human
resource.
Governance must ensure that annual meeting abide law so that shareholder’s
utility is maximized. Through good governance, this will help to encouraged
dedicated workers and increase information sharing in order to achieve vision
and mission of a cooperative.
Table 3: CFA result of loadings, estimates, standard error, critical ratio,
significant p-value and item description for the supply chain model
items variable
Variable Construct Loadings Est. S.E C.R (t-value)
P
Performance Quality and Technology Logistic
Supplier Individual Governance
.19 .23 -.70
.13 .06
1,424,486 1,594,774 -3,926,055 1,937,117 589,359
497,270 529,447 455,496 968,682 624,819
2.87 3.01 -8.62 2.00 .943
.00 .00 .00 .05 .35
Notes:
In table 3, all construct are significance at 10% level of significance in
determining performance except governance. However, governance is
maintained in the model as it contributes to the overall significance of the
model.
Limitations of the model include non-normality of the data and many missing
values in the observations.
Conclusion
Findings show that although some construct in supply chain model are
combined, however all construct is significance in determining supply chain.
As a whole, supply chain is significance in determining performance; however
governance alone is not significant in determining performance. The model fit
the data as there are no offending estimates and all items variable are
significance, but it lacks goodness of fit indices (only RMSEA is found
significant) as there are many missing values in the data collected.
Among few other observations that can be included in further study is an
efficient human resource management can improve performance of
cooperative by setting up a key performance indices and surveillance process
by governance. Governance played an important part as they have to portray a
Governance of cooperatives should also be transparent and just to their
members in governing the cooperatives. Additional information from the
survey is that a good cooperative puts high responsibility on the governance
and conducted more that 10 meetings to discuss future plans and assign task
before presenting its performance result to shareholders in annual board
meeting.
However, in order to develop good governance, board members must be more
dynamic in accepting new technology and have more strategic management to
fulfill market needs. A few cooperatives also faced serious governance
problem for example financial malpractice, noncompliance cooperatives act
for not conducting annual meeting, not allowing new members to enter and
others.
Supply chain management can also be improved by emphasizing the
importance of quality and technology to individual or workers. Main
cooperative staff has to undergo a management training comprehensive of IT
and entrepreneurship skills. Among main contents that can be included in the
training are business extension, importance of branding, quality and
traceability, collective marketing, marketing technology, business plan,
financial management and fiduciary liability.
This management model can also be used for other investor owned firm (IOF)
and other business organization. An efficient supply chain management model
performance. Thus, further studies can be done to estimate the validity of this
model in estimating the best practice in an organization.
Acknowledgements
The authors thank Bank Kerjasama Rakyat Malaysia and Malaysian
Commissioner of Cooperatives for supporting the research under grant vote
number 6714100.
References
Ahmad, A. R. (2006). Agricultural Cooperatives in Malaysia: Innovations and
Opportunities in the Process of Transition towards the 21st Century Model,
paper presented at 2006 FFTC-NACF International Seminar on Agricultural
Cooperatives in Asia: Innovations and Opportunities in the 21st Century,
Seoul, Korea, 11-15 September 2006 available at
www.agnet.org/activities/sw/2006/.../paper-290571303.pdf [accesed on 31
July 2009]
Abdul Hamid A.S. (1977). Farmers’ Cooperatives Tool for Development of
Small Farmers in Malaysia. Kuala Lumpur: Lembaga Pertubuhan Peladang.
Aramyan L.H., Lansink A.O., Van der Vorst J.G. and Van Koten O. (2007),
Performance measurement in agri-food supply chains: a case study, Supply
Chain Management: An International Journal, Vol. 12, No. 4, pp. 304–315.
Arshad F.M., Radam A.R., Abdullah A.M., Noh K.M, Ismail, M.M., Yacob
M.R., Ng K.Y., Ali N.A., Tai S.Y., Ishan Z.M. (2009) Penilaian Prestasi
Koperasi Pertanian Terpilih, Rumusan Eksekutif pp. 1-5, Unpublished report
Arshad F.M., Radam A.R., Abdullah A.M., Noh K.M, Ismail, M.M., Yacob
M.R., Ng K.Y., Ali N.A., Tai S.Y., Ishan Z.M. (2009) Penilaian Prestasi
Arshad F.M., Radam A.R., Abdullah A.M., Noh K.M, Ismail, M.M., Yacob
M.R., Ng K.Y., Ali N.A., Tai S.Y., Ishan Z.M. (2009) Penilaian Prestasi
Koperasi Pertanian Terpilih, Bab 10 pp. 8-17, Unpublished report
Beamon, B.M. (1998). “Supply Chain Design and Analysis: Models and
Methods”. International Journal of Production Economics. Vol. 55 pp.281-94.
Beamon, B.M. (1998). “Supply Chain Design and Analysis: Models and
Methods”. International Journal of Production Economics. Vol. 55,
pp.281-94.
Billington C. (1994). Strategic Supply Chain Management. OR/MS Today,
April . 20-27.
Bollen, K.A. & Long, J.S. [Eds.] (1993). Testing structural equation models.
Newbury Park, CA: Sage.
Bryne, B.M. (2001), Structural Equation Modelling with AMOS: Basic
Concepts, Applications and Programming, pp. 5-6, 287-304
Chamhuri Siwar et al. (1999). "Kajian Penyusunan Semula Koperasi
Asas-tani," Laporan Draf Akhir Untuk Lembaga Pertubuhan Peladang, Biro
Rundingan, Universiti Kebangsaan Malaysia, Bangi.
Dunn J. (1988). Basic cooperative Principles and Their Relationship to
Selected Practices. Journal of Agricultural Cooperation 3. pp. 83-93.
Food and Fertelizer Technology Centre (2006), Agricultural cooperatives in
Asia: innovations and opportunities for the 21st century, FFTC Annual Report
2006, pp. 10-12.
Fredericks L J (1986). The cooperative movement in West Malaysia.
Hair J. E., Anderson R. E., Tatham R.L., and Black W.C (1998), Multivariate
Data Analysis 5th edition, pp. 610-661
Hair J. E., Anderson R. E., Tatham R.L., and Black W.C (2006), Multivariate
Data Analysis: A Global Perspective 7th edi., pp. 90-100
Hovelaque V., Duvaleix-Tréguer S. and Cordier J. (2009). Effects of
constrained supply and price contracts on agricultural cooperatives, European
Journal of Operational Research 199 (2009) pp. 769–780
Kuei, C., Madu, C.N. and Lin, C. (2001). “The relationship between supply
chain quality management practices and organizational performance”,
International Journal of Quality & Realibility Management, Vol. 18 No 8, pp.
864-872.
Kuei, C., Madu, C.N., Lin, C., and Chow, W.S. (2002). “Developing strategies
based on the survey of supply chain quality and technology management,” The
International Journal of Quality & Reliability Management, 19(7),
pp.889-901.
Lin C., Chow W.S., Madu C.N., Kuei C. and Yu P.P. (2004). “A structural
equation model of supply chain quality management and organizational
performance” International Journal of Production Economics, 96(2005),
pp.355-365.
Pallant, J.(2001). SPSS Survival Manual: A step to step guide to data analysis
using SPSS for Windows, pp. 85-88
Plunkett, B. (2005). The Portfolio Problem in Agricultural Cooperatives: An
Integrated Framework, A Dissertation presented to the Faculty of Graduate
School University of Missouri in partial fulfillment for the Degree Doctor of
Qin S., Yong-tao S., Zhao L. and Ji-xiang D. (2008). The impact of supply
chain relationship quality on cooperative strategy, Journal of Purchasing &
Supply Management, Vol. 14, pp. 263-272
Rao P. and Holt D. (2005). Do green supply chains lead to competitiveness
and economic performance? International Journal of Operations & Production
Management, Vol. 25 No. 9, 2005, pp. 898-916
Shenoy, G.V. and Mohamed Sulaiman (1996). Introduction: Cooperative
Movement in Malaysia. Malaysian Management Review, Vol. 31 No. 1.
available at http://mgv.mim.edu.my/MMR/9603/960308.Htm [accesed on 31
July 2009]
Shapiro J.F. (2007) Modeling the Supply Chain, 2nd edi., pp. 17-56
Sharma G.K. (1991) Problems and Policy Issues of Agriculutral Cooperatives,
Agricultural Cooperatives in Asian and the Pacific, pp.127-135
Swaminathan J.M., Smith and N. M. Sadeh (1998). Modeling Supply Chain
Dynamics: A Multiagent Approach, Decision Sciences Journal, Vol. 29 (3),
pp. 607-632
Tabachnick B. G and Fidell L.S. (2007) Using Multivariate Statistics, 5th
edition, pp. 676-684
United Nations (2009). Cooperatives in Social Development, Report of the
Secretary General, A/64/132, pp. 1-10.
United States Department of Agriculture (2002), Agricultural Cooperatives in
the 21st Century, Rural Business–Cooperative Service, Cooperative
Information Report 60, pp. 1-9.
Van der Vorst, J.G.A.J., (2000). Effective food supply chains: generating,
[http://www.library.wur.nl/wda/dissertations/dis2841.pdf] [accesed on 27 July