Munich Personal RePEc Archive
Which “Greenness” is Valued? Evidence
from Green Condominiums in Tokyo
Yoshida, Jiro and Sugiura, Ayako
The Pennsylvania State University, Tokyo Association of Real
Estate Appraisers
26 March 2010
Which “Greenness” is Valued? Evidence from
Green Condominiums in Tokyo
*March 26, 2010 This version: June 2, 2010
Jiro Yoshida†
Ayako Sugiura‡
Abstract
This is one of the first researches on price differentials of green buildings in Asia. Using a rich set of data on condominium transactions and mandatory evaluation of environmental performance in Tokyo, we estimate the effects of itemized green scores on transaction prices. Although green condominiums are on average traded at a premium, the premium is mainly attributed to the building age and quality. After controlling for relevant attributes, we find significant price discounts for newly constructed green condominiums. However, green condominiums experience little depreciation at least during the initial years. Using itemized scores, we find that the long-life design mitigates price discounts, but other factors such as the use of eco-friendly materials, renewable energy, water reuse, and greening exacerbate discounts. Several possibilities are discussed including high future maintenance costs of green condominiums. (JEL: Q51, R31)
Key words: sustainability, green building, hedonic pricing, transaction price, residential real estate, Japan
* We thank seminar participants at the workshop at the Ministry of Land, Infrastructure, Transport, and
Tourism (MLIT) for comments. We also thank Tokyo Association of Real Estate Appraisers for valuable comments and its support for data configuration. We gratefully acknowledge grant from MLIT that have supported this research.
† The Pennsylvania State University. 368 Business Building, University Park, PA 16802 USA. Email:
jiro@psu.edu
‡ Tokyo Association of Real Estate Appraisers, 1-1 Ichigaya Motomura-Cho, Shinjuku, Tokyo 162-0845
I.
Introduction
The green building is a concept for buildings with better environmental
performance. Green buildings typically emit less carbon dioxide (CO2). They
have been drawing more attention in recent years because construction and
operation of real estate account for a large share of total CO2. In Japan, about
40% of total CO2 emission is generated by the whole life cycle of real estate.
(Architectural Institute of Japan, 2000)
The definition of green buildings varies by the evaluation system. In
some systems it is defined merely by energy efficiency, but in others it is
defined by a combination of various sustainability factors. For example, many
green labeling systems such as LEED in the United States, CASBEE in Japan,
and Tokyo Green Building Program used in the present research, construct
comprehensive measures of environmental quality of real estate. Some of green
factors are not directly linked to CO2 emission.
An important question about green buildings is whether and how their
“greenness” is priced in the market. If green buildings are traded at sufficiently
high prices, developers would build such buildings for profit. Then the
transform of existing stock of real estate into green stock will be made
smoothly by the market mechanism under the current institutional setting. If
not, much stronger policy measures or further changes in consumers’
consciousness are called for.
There are several potential sources of value premium for green buildings.
The first is cost savings from purely technological reasons. If better heat
insulator and more energy-efficient equipments are used in a building, they
reduce operating expenses of the building. The reduced costs will be shared by
the buyer and the seller with a certain ratio. The seller gets her share from a
reflect not only current programs but also future ones. The third source is
increased revenue for commercial buildings or owner’s greater utility for
residential buildings. Tenants of commercial buildings may be willing to pay
higher rents if the use of green buildings is an important component of their
corporate social responsibility. Home buyers may also be willing to pay higher
prices if they are more satisfied by residing in green residential units.
However, the flip side is that there may be price discounts if these
sources are negatively combined; prices will be lower if green features increase
costs without much savings, public programs are not effective enough, and
consumers of building services are not willing to pay enough.
In this research we study what kind of “greenness” is valued in real
estate markets by using condominium data in Tokyo Metropolitan Area in
Japan. We combine a rich set of data on condominium transactions with
detailed evaluation of environmental performance that is mandated by Tokyo
Metropolitan government. This is one of the first academic researches on price
differentials of green buildings in Asia. In particular, this is the first in the
world to estimate effects of green labeling by different factor of environmental
scores.
More specifically, we first examine whether environmental evaluation
under Tokyo Green Building Program generates any price differentials. In
estimating the effect of green condominium indicator, we explore different
controls for building characteristics and different specifications. Furthermore,
we construct itemized relative scores in eight fields of environmental
evaluation to estimate effects of environmental friendliness by field.
We find that green condominiums are on average traded at a premium if
building characteristics are not controlled for, but the premium is mainly
attributed to the building age and quality. After controlling for relevant
green-labeled condominiums. The negative effects range from 6% to 11%. However,
green condominiums experience little depreciation at least during the initial
years.
Regarding estimates for itemized scores in green evaluation, we find
that the long-life design and mitigation of the heat-island phenomenon reduce
price discounts. However, other items such as the use of eco-friendly materials,
renewable energy, water reuse, and greening exacerbate price discounts. We
estimate that a newly constructed green condominium with median green
scores is traded roughly at 11% discount.
An explanation is based on user costs including those for maintenance
and replacement of equipments. The long life design lowers user costs for the
owner. The benefit can be significant in Japan where the average life of
buildings is short. In contrast, greening, the use of eco-friendly materials, and
water reuse may significantly increase future operating expenses and capital
expenditures. Such benefits and costs in the future would be capitalized into
the initial price of a condominium.
The price discount indicates that homeowners are not yet willing to pay
significantly higher prices for living in green condominiums. It also shows that
the current and expected future policy measures do not create a significant
benefit for green condominiums at this moment. Much stronger policy
measures are called for in order to overcome price discounts and even generate
price premia for autonomous diffusion of green buildings.
The paper is organized as follows. Section II is the review of related
literature. In Section III, we summarize data for transaction prices and green
building evaluation used in the study. Section IV presents the empirical
II.
Literature
More cases studies and research reports on green buildings are published as
concerns on global warming increase. However, the majority of previous
researches is non-academic ones from engineering perspectives, and focuses
more on cost issues than on values.
For example, California’s sustainable building task force (2003) conducts
case studies of 33 buildings on technical aspects of green buildings. Urban
Land Institute publishes a number of books on green buildings on costs of
construction and operation.
Some industry researches deal with values of and returns to green
buildings. (Pramerica Real Estate Investors, 2007; RREEF, 2007, 2008, 2009;
USGBC, 2008) Although some positive results on green building investments
are presented, the research methodologies are not necessarily satisfactory.
Our research is one of two first researches on a comprehensive measure
of green buildings, which is not restricted to energy efficiency. The other
research is done by Yoshida, Quigley, and Shimizu (2010) who use a different
set of data and analyze how itemized scores in Tokyo Green Labeling System
for Condominiums and CASBEE are associated with differentials in asking
price of new condominiums. They find that developers add a 4.7% premium on
asking prices of newly constructed green condominiums. The asking price is
discounted by about 5% when condominiums are actually sold for both green
and non-green ones. They do not find that the premium completely disappears
after sale negotiations; i.e., a part of the premium remains in transaction prices.
The different result may be arising due to the limited number of transaction
sample in their study.
Closely related researches are the following. By using an energy
efficiency measure, Dian and Miranowski (1989) reports that energy efficiency
analyze the effect of an energy-saving label in the Netherlands on transaction
prices of housing. They find about 3% premium in prices after controlling for
location and building quality.
On office buildings, Eichholtz et al. (2010) study US office markets by
using data from Energy-Star and LEED. They find about 3% rent premium for
694 green office buildings after controlling for differences in quality and
location. Fuerst and Patrick (2008) and Miller et al. (2008) also use
Energy-Star and LEED data to find premia in rents or prices. Miller et al. (2008) find
no rent premium but 6% to 10% premium on transaction prices. Fuerst and
Patrick (2008) report about 5% premium in rents and 30% premium in
transaction prices. Although LEED is a comprehensive evaluation system for
green buildings, they do not provide analysis of itemized effects.
III.
Data
A. Tokyo Building Environmental Plan
The Tokyo Metropolitan Government launched its Basic Plan for
Environmental Protection in 1997, and enacted the Tokyo Metropolitan
Environmental Security Ordinance in 2000.1 Based on the ordinance, the
government launched Tokyo Green Building Program in 2002, which was
reinforced in 2005, 2007, and 2009.2 The amendment in 2005 includes the
creation of Tokyo Green Labeling System for Condominiums, by which the
developer of a large-scale condominium project is required to announce its
itemized green scores to potential buyers.
1 The ordinance No. 215, whose formal name is, “Tomin no Kenko to Anzen wo Kakuho Suru Kankyo ni
Kansuru Jourei.”
2 Tokyo Green Building Guidelines are published in Tokyo Metropolitan Notification No. 384 on March 28,
2002. See http://www2.kankyo.metro.tokyo.jp/sgw/English/Tokyo%20Green%20BUilding%20Program.pdf
The purpose of the program is to require large building owners to submit
Tokyo Green Building Plan and announce the submitted plan and related
materials on Tokyo Metropolitan Government’s website and thereby to
encourage building owners to carry out voluntary environment-conscious
efforts and create a market that would highly rate environmentally sound and
high-quality buildings and structures.
A building owner is subject to the ordinance if the owner intends to newly
construct or expand a building whose total floor space exceeds 10,000 m2.
Regardless of whether the building owner is in the private sector or in the
public sector, the ordinance applies to all categories of buildings including
residential buildings and office buildings. The total floor space is calculated for
each building, and the building owner does not have to add up the floor spaces
of all buildings in the same promises. As of January 28, 2010, 1,154 buildings
are evaluated under the program.
A big advantage of Tokyo Green Building Program for this research is
that the program is mandatory to new construction or renovation exceeding
10,000 m2 in floor area. Therefore, unlike other green labeling systems on
voluntary basis, Tokyo’s program is in principle free from the sample selection
problem. Another advantage is that the Tokyo government publishes itemized
scores in eight fields: 1) reduction of thermal loads, 2) use of renewable energy,
3) energy-saving, 4) use of eco-friendly materials, 5) longer life of the building,
6) water circulation, 7) greening, and 8) mitigation of the heat island
phenomenon. A building is given one points to four points in each field. The
maximum points are different in each field and can be changed at each
amendment.
In our analysis, we first construct an indicator variable that identifies
I , 1 if Building i is evaluated,0 otherwise.
Next we construct a measure of relative scores for evaluated buildings in
each of the eight fields described above. The maximum possible points are
different by field. In some fields score is either 1 or 2, but in other fields score
can be 1, 2, 3, or 4. As a result, 1 point in a field can be different from 1 point in
other fields. Therefore, we construct the relative score by dividing raw score by
the maximum possible score in each field. If Building i gets a raw score of S ,
in Field m, in which the maximum possible score is S , the relative score, L ,,
is defined as L , S ,⁄S .
In addition to the relative score, we construct indicator variables for
each relative score. It is because the scores in the program are not cardinal.
The relative scores should be interpreted as categorical variables. If there are
N distinct values of relative scores in Field m, and if L , for Building i is the n-th lowest value in the field, the indicator variable, I ,, equals to unity. That
is,
I , 1 if L0 , is the n‐th lowest value in Field m, otherwise,
for m 1, … ,8; n 1, … , N
B. Transaction Price Data
The transaction price data of condominium units in Tokyo are obtained from
the Transaction Price Information Service (TPIS) that is jointly managed by
the Ministry of Land, Infrastructure, Transport, and Tourism (MLIT) and
transaction price information and associated attributes such as location, size,
zoning and property use. The MLIT produces the information by combining
three data sources: 1) the registry data obtained from the Ministry of Justice
(MOJ) on transactions of raw land, built property, and condominiums, 2)
survey results answered by property buyers, and 3) field survey conducted by
real estate appraisers.
A unique advantage of the TPIS data is their quality. The data set
contains extremely rich set of property attributes. The data set is a
combination of three distinct data sources, which allows us to check the
consistency and accuracy of the data.
The data collection scheme is the following. The MOJ, which administers
the national real estate registration system, provides MLIT the updated
information on ownership transfers.3 The MOJ’s registry information includes
location, plot number, type of land use, area, dates of receipt and contract, and
name and address of the new owner. However, the registry does not record
transaction prices. For each record on the registry, the MLIT sends
questionnaires to each of the new owners and collects information on the
transaction price, property size, and reason of the transaction. Based on the
collected data, real estate appraisers conduct field survey on each property to
record necessary information for appraisal such as building height, frontal road,
distance from the nearest station, site shape, and land use. The information is
finally compiled by MLIT.
The process typically takes three months. For example, registry data of
April 2008 are obtained from the Ministry of Justice at the end of May 2008,
and questionnaires are posted to buyers at the beginning of June 2008, which
are to be collected by the end of the same month. A small portion of the cases
3 There are ten different kinds of real property rights to be registered: exclusive and absolute right to real
(about 3% of the total) are omitted after the merged data are checked. Cases
are omitted if field survey results are obviously different from questionnaire
results or if the property size is below 10 m2.
For example, between July 2005 and December 2007, 6.3 million
transfers of ownership are registered for land, built property, and condominium
ownership, of which 1.34 million transfers are subject to the MLIT survey.
Eventually, 334 thousand replies are collected (29.2 % collection rate), and 220
thousand records are published after excluding errors.
In the original sample of condominiums in Tokyo, 41,560 transactions
are included between 2002 and 2009. However, in a part of the sample, some
necessary information is missing. After removing incomplete observations, we
maintain 34,862 observations.
The data set includes very rich information on the attributes of
condominium units and buildings. After dropping the variables that contain
significant number of missing values, we use the variables that are listed in
Table 1. The dependent variable is logarithm of price per square meter. The
explanatory variables are classified into five categories: 1) room attributes, 2)
transaction characteristics, 3) location, 4) building size, and 5) building quality.
It is noteworthy that we include indicator variables for jurisdictions and
railway lines as location variables in order to control for unobserved
heterogeneity in location. The jurisdiction is as important in Tokyo as
anywhere else because of local public services, amenities, and local taxes. But
the railway line is also important in Tokyo because frequent use of railway
system creates railway-based communities and railway-based residential
sorting. Transaction timing is also controlled for by indicator variables for
Table 1: List of explanatory variables
Variable Unit/Category
1) Room attributes
Log floor area ln (m2)
Floor number
Floor plan Indicators for 1K, 1DK, 2DK, 1LDK, 2LDK, 3LDK, & 4-LDK
2) Transaction
Transaction quarter Indicators for quarter-year of transaction
Buyer type Indicators for individual, company, real estate firm, and public
entity
Seller type Same as above
3) Location
Jurisdiction Indicators for 23 wards and cities
Station Size Number of railway lines coming to the nearest station
Railway Line Indicators for railway lines
Distance to Station Road distance in kilometers
Zoning Indicators for neighborhood commercial, commercial, exclusive
industrial, industrial, quasi industrial, low-rise residential 1, low-rise residential 2, medium-to-high-rise residential 1, medium-to-high-rise residential 2, residential 1, residential 2, and quasi residential.
Maximum Building
Coverage Ratio
%, as defined by zoning regulation
Maximum
Floor-to-Area Ratio
%, as defined by zoning regulation
4) Building Size
Lot area Square meters
Number of units Number of units in the building
Stories above ground Number of stories above ground Stories below ground Number of stories below ground 5) Building Quality
Building structure Indicators for steel-reinforced concrete, reinforced concrete, steel, wooden, and blocks
Building age Years after completion of the building
Table 2 summarizes the descriptive statistics for samples with and
without the green evaluation. The left column is for non-green condominiums
and the right column is for green condominiums. It is clear that green
condominiums are traded at significantly higher prices. The mean transaction
price of green condominiums is 56 million yen, which is more than the double of
27 million yen for non-green condominiums. However, green condominium
units also have larger floor area. After computing unit prices per square meter
of floor area, the price differential shrinks but still remains.
Green condominiums are also taller (Stories above ground), have larger
lot (Lot area), have more units (Number of units), and younger (Building age).
These differences in size and quality must be responsible for the price
differential. It is important to control for quality differences carefully in order
IV.
Empirical Analysis by Hedonic Approach
A. Hedonic Model
We adopt hedonic approach to the estimation of the green effect on transaction
prices. The hedonic approach is theoretically formalized by Rosen (1974), and is
widely used in the study of real estate valuation. The idea is to regard housing
[image:14.612.80.539.137.487.2]as a bundle of characteristics such as lot size, building size, and location. Then Table 2: Descriptive Statistics
Variables mean standard
deviation median mean
standard
deviation median
Transaction Price (yen) 2.72E+07 3.03E+07 2.27E+07 5.58E+07 5.52E+07 4.50E+07
Price (yen) per sq. m. 645500.0 482025.2 559451.5 772572.5 551089.2 711700.2 ln (Price per sq. m.) 13.2207 0.5772 13.2347 13.4681 0.3846 13.4754
Floor area (sq. m.) 0.4620 0.3086 0.4760 0.7255 0.4081 0.7201
ln (Floor area) -0.9393 0.5956 -0.7423 -0.3683 0.2917 -0.3284 Floor number 5.4662 4.6918 4 12.1841 10.0357 9
Station size (number of lines) 1.5302 1.1620 1 1.8132 1.3746 1
Distance to station (100m) 0.6173 0.4764 0.5200 0.6913 0.4736 0.6300 Max. building coverage ratio 0.6959 0.2165 0.6 0.6493 0.0956 0.6
Max. floor to area ratio 3.5357 1.5707 3 3.4056 1.4342 3 Lot area 0.3181 0.8961 0.0836 1.2491 1.1884 0.8499
Number of units 0.0995 0.1881 0.0530 0.4220 0.3227 0.3380
Stories above ground 9.7571 6.3896 9 23.7208 12.5745 20 Stories below ground 0.2491 0.5545 0 0.9524 0.9625 1
Building age 12.8447 11.0860 10 1.8116 2.1724 1
Superintendent 0.8921 0.3102 1 0.9959 0.0637 1 Non-Green Condominiums Green Condominiums
under some conditions, it is shown that housing prices in spatial equilibrium
implicitly reveal a real-valued pricing function p p z , … , z relating prices
and the n-vector of characteristics, z. Then, the market price associated with
characteristic, z , holding all else constant, is given by ∂p ∂z⁄ , assuming
continuity of z and differentiability of p.
We investigate how green buildings are evaluated in the market in two
ways. First, we estimate the effect of being evaluated in Tokyo Green Building
Program on transaction prices. The indicator variable, I ,, defined in Section
III is used as the indicator for the green building. Second, we estimate effects of
itemized scores in the program by using indicator variables, I ,, that are also
defined in Section III.
B. Analysis by Green Building Indicator
In our first analysis using the green indicator, we estimate six variations of the
following model by with different control variables. The logarithm of
transaction price of Room j in Building i at Time t (ln P ) is regressed on a
constant, the indicator variable, I ,, and various hedonic characteristics, X , .
Category k, k 1, … ,5, contains F variables indexed by f. The hedonic
characteristics variables X include indicator variables for jurisdiction and
railway to control for unobserved heterogeneity in location.
ln P b b I , b X ,
F
ε 1
The first variation does not include any attribute in order to measure
category of attributes at a time; only room characteristics are included in the
second variation, room and transaction characteristics are included in the third
variation, and so on. The sixth version is the full model under this specification.
Table 3 presents the OLS regression results for the green building
indicator. Column (1) reports the results for the first variation, in which no
hedonic characteristics are included. The estimated green coefficient, b ,
represents the mean difference between the green condominiums and the
non-green ones when differences in hedonic characteristics are ignored. The non-green
condominiums are on average traded for about 26% higher prices. As more
hedonic characteristics are added in Column (2) through Column (5), the
adjusted R-squared increases while the green coefficient gradually decreases.
In Column (5), the green coefficient is reduced to 0.1984, but remains
significantly positive, when 166 explanatory variables are used including
indicators for jurisdictions and railways.
When the variables for building quality are included, the result
fundamentally changes even though only one numeric variable and four
indicator variables are added. In Column (6), the green coefficient turns to
negative (-0.0563), which is statistically significant at 1% level, and the
adjusted R squared jumps up to 0.637. This result suggests that the estimated
green coefficient is significantly affected by correlations between the building
quality variables and the green building indicator. Without controlling for
building quality, the estimated coefficient for the green indicator is subject to
the omitted variables bias. After controlling for building quality, green
condominiums are found to be traded for about 5.6% lower prices. We will
discuss this negative effect after presenting the results of robustness checks
Table 3: Regression Results on the Green Building Indicator (dependent variable: logarithm of price per square meter)
(1) (2) (3) (4) (5) (6)
(Green Building) 0.2626*** (0.0104) 0.2590*** (0.0096) 0.2384*** (0.0102) 0.2176*** (0.0089) 0.1984*** (0.0099) -0.0563*** (0.0084) Controls
Room - Yes Yes Yes Yes Yes
Transaction - - Yes Yes Yes Yes
Location - - - Yes Yes Yes
Bldg. size - - - - Yes Yes
Bldg.
quality - - - Yes
Constant 13.2107***
(0.0030) 13.2977*** (0.0531) 13.1645*** (0.0540) 13.3578*** (0.0611) 13.3870*** (0.0593) 14.0386*** (0.0513)
Adjusted R2 0.00788 0.186 0.242 0.445 0.455 0.637
Number of explanatory variables
1 11 36 162 166 171
N 38680 37917 37914 37906 35927 34862
The signs of estimated coefficients for other control variables, which are
provided on the author’s website, are generally as expected.4 For the full model
shown in Column (6), the transaction price per square meter is higher if the
unit is on a higher floor (0.0068 per floor), the unit is smaller (0.0752 per log
floor area), the unit is a one-room type, the condominium is closer to a railway
station (0.1316 per kilometer), the nearest station has more railway lines
(0.0183 per line), zoning is residential, there are superintendents (0.0413), the
seller is a real estate firm or a company, and the buyer is an individual.
C. Robustness Checks and Additional Findings
Now we conduct additional investigations and robustness checks of the
previous result that green buildings negatively affect transaction prices. First,
we separate each variable for building quality to see which quality variable
affects the green coefficient most. The building quality variables are building
age, building structure, and superintendent.
Second, we estimate the full model with all the attributes by Least
Absolute Deviation (LAD) method in order to reduce the influence of outliers on
the estimation.5 The LAD estimator is a median estimator and is less affected
by the skewness or fat tails of the disturbance distribution. Third, we estimate
the full model in the sub-sample in which one-room units are excluded.
One-room units are often built and sold for rental purposes, and those units could be
traded for quite different motivations. We are concerned about the possibility
that such non-standard units are driving the result.
Given the result from the first robustness check that the building age is a
critical attribute in estimation, we include, as the fourth variation, quadratic
4 Please see www.personal.psu.edu/juy18.
5 The LAD estimator in our application is the solution to the problem,
terms of building age and building size. This specification allows for non-linear
relations between these variables and the log transaction price. Fifth, we
include an interaction term of the green building indicator and building age to
see if green buildings depreciate in a different manner. A different rate of
depreciation may well arise because a longer life of a building is evaluated in
Tokyo Green Building Program. Finally, we estimate the version with the
interaction term in a subsample in which projects completed before 2003 are
excluded. We limit the sample in order to focus on depreciation rates during
early years and to better match the sample of green buildings with that of
other buildings. Green condominiums are generally younger than seven years
old since Tokyo Green Building Program has only eight years of history.
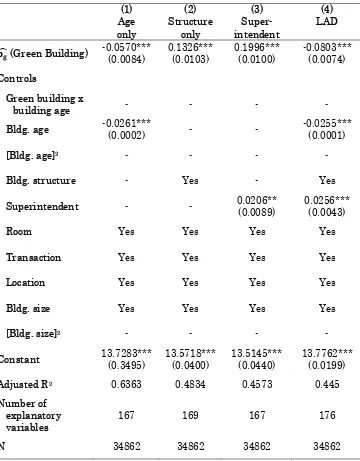
Table 4 presents the results of robustness checks. A clear conclusion is
that the estimated coefficient for the green building indicator is negative after
building age is taken into account. We obtain even larger effects of green
buildings on transaction prices when the model specification is more flexible in
building age.
Column (1), (2), and (3) compare which variable for building quality
affects the estimated green coefficient most. We find that the building age is
the key variable to be controlled for in estimating the green coefficient correctly.
Without any variable for building quality, the estimate of the green coefficient
is 0.1984 (Column (5) in Table 3.) The inclusion of building age changes the
sign of the estimate to -0.570, which is close to the one in the full model.
(Columin (1)) The inclusion of building structure variables also affects the
estimate, but to a lesser extent. (Column (2)) The inclusion of superintendent
indicator does not alter the estimate. (Column (3))
In column (4), we present the result estimated by LAD. Compared to the
Table 4: Robustness Checks of the Green Building Effect
(dependent variable: logarithm of price per square meter)
(1) Age only (2) Structure only (3) Super- intendent (4) LAD
(Green Building) -0.0570*** (0.0084) 0.1326*** (0.0103) 0.1996*** (0.0100) -0.0803*** (0.0074) Controls
Green building x
building age - - - -
Bldg. age -0.0261***
(0.0002) - -
-0.0255*** (0.0001)
[Bldg. age]2 - - - -
Bldg. structure - Yes - Yes
Superintendent - - 0.0206**
(0.0089)
0.0256*** (0.0043)
Room Yes Yes Yes Yes
Transaction Yes Yes Yes Yes
Location Yes Yes Yes Yes
Bldg. size Yes Yes Yes Yes
[Bldg. size]2 - - - -
Constant 13.7283***
(0.3495) 13.5718*** (0.0400) 13.5145*** (0.0440) 13.7762*** (0.0199)
Adjusted R2 0.6363 0.4834 0.4573 0.445
Number of explanatory variables
167 169 167 176
Table 4 (Continued): Robustness Checks of the Green Building Effect (dependent variable: logarithm of price per square meter)
(5) Studios excluded
(6) Quadratic size & age
(7) Green x age (8) Since 2003
(Green Building) -0.0757*** (0.0089) - 0.1206*** (0.0088) -0.1083*** (0.0100) -0.0604*** (0.0145) Controls Green bldg.
x Bldg. age - -
0.0279*** (0.0023)
0.0392*** (0.0050)
Bldg. age -0.0227***
[image:21.612.105.507.143.602.2](0.0002) -0.0456*** (0.0007) -0.0261*** (0.0002) -0.0513*** (0.0028)
[Bldg. age]2 - 0.0006***
(0.0000) - -
Bldg. structure Yes Yes Yes Yes
Superintendent Yes Yes Yes Yes
Room Yes Yes Yes Yes
Transaction Yes Yes Yes Yes
Location Yes Yes Yes Yes
Bldg. size Yes Yes Yes Yes
[Bldg. size]2 - Yes - -
Constant 13.6603***
(0.0349) 13.1473*** (0.0586) 13.6920*** (0.0364) 13.1537*** (0.0798)
Adjusted R2 0.640 0.653 0.637 0.604
Number of explanatory variables
171 175 172 172
N 24909 34862 34862 11703
Therefore, the outliers and distributional irregularity are not producing the
negative effect. Rather, such irregularity attenuates the estimate.
In column (5), when we exclude one-room units from the sample, the
estimate again exhibits a larger effect of -0.0757 than -0.0563 in the full sample.
For standard-sized units of condominium, greenness is associated with a
greater negative effect on price than for smaller one-room units. One-room
units are in fact found to be different from other standard-sized units, but
those units attenuate the negative effect. It may be the case that the green
design does not create a big difference for smaller one-room units.
In Columns (6), (7), and (8), the building age is treated with a greater care,
given its importance in estimating the green coefficient. When we include
quadratic terms of age and size variables in Column (6), the estimated green
coefficient doubles to -0.1206. The quadratic term of building age is significant
at 1% level and enters positively. The negative coefficient on age roughly
doubles to -0.0456. This shows that the depreciation rates are not constant over
ages but much faster for younger buildings. The omission of this nonlinear
effect of age creates a systematic pattern in the error term such that younger
buildings tend to have positive errors. The green condominiums, which are
generally younger, are associated with the positive errors. Therefore, the
estimated green coefficient is biased upward when nonlinearity of depreciation
rates are omitted. We confirm this by doubling green coefficient.
Column (7) shows the result when we include an interaction term of
building age and the green indicator. Again we obtain a stronger effect of the
green indicator, -0.1083. This value is the estimated green discount for new
buildings when age equals to zero.
An additional important finding is that depreciation rates are different for
green condominiums. Non-green condominiums depreciate on average at about
about zero. The interaction term is positive 0.0279 and significant at 1%. The
sum of the estimates for age and the interaction term becomes 0.0018, which
cannot be distinguished from zero. Green condominiums are sold initially at
11% discount, but do not depreciate much. Roughly four years later, the value
of green condominiums exceeds that of non-green ones.
Column (8) presents estimates of the differential depreciation rates in a
restricted sample of being built after 2002. The result generally agrees to the
previous one in Column (7). The depreciation rate for non-green condominiums
becomes higher at about 5.1% per year during initial seven years. The estimate
for the interaction term is again positive and significant at 1% level. The
estimated depreciation rate for green condominiums is about 1.2%. The initial
discount for green condominiums is reduced to about 6.0%. After five years
from sale, the value of green condominiums exceeds that of non-green ones.
D. Analysis by Itemized Green Scores
In this section we present estimation results for itemized green scores. As
summarized in Section III, there are eight fields of criteria in Tokyo Green
Building Program. We estimate coefficients of indicator variables for relative
scores in each of eight fields, in addition to the green indicator. Since the
baseline effect of green condominiums is captured by the green indicator,
coefficients for itemized scores capture deviations from the baseline effect. The
estimation equation is,
ln P b b I , b I ,
N
b X , F
where I , is the green indicator, and I , is the indicator variable that equals to
unity if the relative score for Building i in Field m is the n-th lowest value for
n 2, … , N . The lowest value is zero for each field.
Table 5 presents the estimation result. Estimated coefficients for
itemized green scores are shown only if they are significant at 0.1 or lower. We
estimate five variations of Equation (2). Columns (1) and (2) are results by OLS
and LAD, respectively. Column (3) is the OLS result when quadratic terms of
building age and building size variables are included. Column (4) is the OLS
result when heterogeneous depreciation is allowed by including the interaction
term between building age and the green indicator. Column (5) is the same as
Column (4) except that the sample is limited to condominiums built since 2003.
Among eight fields of green investments, the longer life of building (i.e.,
m=5) exhibits very strong positive effects. In Column (1), estimated effects are
about 0.134, 0.087, and 0.247 when relative scores are 0.33, 0.67, and 1,
respectively. The positive effects are even larger in Column (3), (4), and (5)
when the depreciation is better modeled. The median score in this field is 0.67,
for which effects range from 0.087 to 0.347 depending on estimation.
Large positive effects are also found for the mitigation of heat-island
phenomenon (i.e., m=8). For the relative score of 0.33, positive effects range
from 0.151 in Column (5) to 0.262 in Column (4). However, there are only 102
condominium units getting positive scores in this field, of which78 units, or 5%
of total green units, get 0.33 points. Therefore, such strong positive effects do
not affect the majority of green condominiums.
Other fields are generally associated with negative effects, which
augment the negative baseline effect. In particular, effects of the use of
eco-friendly materials are important for the overall green effect because about a
0.33 points are discounted by 0.050 to 0.098, and those receiving 0.5 points are
discounted by 0.029 to 0.054 in addition to the baseline discount.
The water circulation is also associated with large negative effects. The
estimated discounts range from 0.122 to 0.162 for those with full score, which
account for 14% of green condominium units. The remaining 86% of green units
receive either zero point or 0.5 point, in which case no additional discount is
estimated.
The greening also tends to result in discounts. In Column (1), estimated
effects range from -0.049 to -0.276. The estimated effects are stronger for the
LAD estimation shown in Column (2) and for the model with quadratic terms
shown in Column (3), but become insignificant in Columns (4) and (5).
The energy saving is also associated with large price discounts.
Discounts range from -0.114 to -0.197 for 0.5 point, and from -0.108 to -0.124
for 1 point. The effects tend to be stronger when the age variable is better
modeled. The reduction of thermal loads and renewable energy do not exhibit
consistent results across different variations. In most specifications, these
effects are insignificant.
The baseline effect of green condominiums (the first row) is negative for
each specification. At first glance, the effect looks stronger than in Tables 3 and
4. However, the baseline effect cannot be directly compared with the green
effect estimated without itemized scores. The baseline effect can be interpreted
as price differential for a hypothetical green condominium that gets zero point
Table 5: Regression Results on Itemized Green Scores (dependent variable: logarithm of price per square meter)
Score (1)
OLS
(2) LAD
(3) Quadratic Size & Age
(4) Green
x Age
b (Green Building) -0.1125*** -0.0868 -0.1966*** -0.1888***
1. Reduction of thermal loads
0.5 - - 0.0457* -
1 - - - -
2. Renewable energy 0.33 - 0.1481* - -
0.5 -0.0379* - - -
3. Energy saving 0.5 -0.1184* - -0.1143* -0.1148*
1 -0.1082* - -0.1244** -
4. Eco-friendly materials 0.33 -0.0642*** -0.0775*** -0.0977*** -0.0503**
0.5 -0.0393** -0.0287* -0.0286* -0.0319*
5. Longer life of building 0.33 0.1340*** - 0.1671*** 0.1542***
0.67 0.0869** - 0.1005*** 0.1099***
1 0.2468*** 0.1814* 0.2704*** 0.2830***
6. Water circulation 1 -0.1618*** -0.1224*** -0.1362*** -0.1483***
7. Greening 0.25 -0.2759*** -0.2953*** -0.3673*** -0.2273***
0.33 - -0.0469*** -0.0296* -
0.67 - - - 0.0777*
0.75 -0.1511** -0.1692** -0.2469*** -
1 -0.0488** -0.0977*** -0.0438* -
8. Mitigation of heat
island 0.33 0.2453*** 0.1690*** 0.2272*** 0.2624***
Contols
Green bldg x Bldg. age - - - 0.0266***
Bldg. age -0.0261*** -0.0255*** -0.0457*** -0.0261***
[Bldg. age]2 - - 0.0006*** -
Bldg. structure Yes Yes Yes Yes
Superintendent Yes Yes Yes Yes
Room, transaction, and
location Yes Yes Yes Yes
Bldg. size Yes Yes Yes Yes
[Bldg. size]2 - - Yes -
Constant 13.6901*** 13.7713*** 13.7499*** 13.6897*** 1
Adjusted R2 0.638 0.5549 0.651 0.638
Number of explanatory
variables 194 199 198 195
N 34859 34859 11700 34859
In Table 6, we compute the total green effect for a hypothetical
condominium that gets median scores for all fields. Median scores for fields 1
through 8 are 0.5, 0, 0, 0.5, 0.67, 0.5, 0.33, and 0, respectively. Median scores
are almost identical to modes. In general, a negative baseline effect tends to be
partially offset by a positive effect of longer life, but enhanced by negative
effects of eco-friendly materials and greening.
The total effect for the median condominium is -0.065 by OLS and -0.076
by LAD. (Columns (1) and (2)) When quadratic terms for building age and
building size are included, the total effect is magnified to -0.109. (Column (3))
When the interaction term between building age and the green indicator is
included, the total effect becomes -0.111, which does not change even if we limit
the sample to condominiums built since 2003. The results are consistent to
each other in Columns (3), (4), and (5) when the age-related depreciation is
better modeled.
Finally, estimated results on depreciation are similar to those in Tables
3 and 4; green condominiums are less subject to depreciation. With a constant
and homogeneous depreciation rate assumed in Columns (1) and (2), the
annual depreciation rate is about 2.6%. When age-dependent but homogeneous
depreciation rates are introduced by the quadratic term, the initial
depreciation rate is about 4.6% but rates become lower with age. For a 10
year-old building, the depreciation rate becomes about 3.5%.6 When heterogeneous
depreciation rates are allowed in column (4), the average rate is about 2.6% for
non-green condominiums, but about 0% for green ones. When the sample is
limited to newer condominiums, the average depreciation rate becomes about
5% for non-green ones and 1.5% for green ones. (Column (5))
E. Discussion
The results from itemized scores are summarized as follows. Overall, green
condominiums are traded at a discount. However, those having a long-life
design and contributing the mitigation of heat-island phenomenon are
associated with smaller price discounts. Those using eco-friendly materials,
circulating water, providing more green areas, and having energy saving
features are associated with greater price discounts. What is the reason for
[image:28.612.89.532.131.400.2]such different effects by item?
Table 6: Effects for a Condominium with Median Scores
Median Score
(1) OLS
(2) LAD
(3) Quadratic Size & Age
(4) Green
x Age 1. Reduction of thermal
loads 0.5 0.0457
2. Renewable energy 0
3. Energy saving 0
4. Eco-friendly materials 0.5 -0.0393 -0.0287 -0.0286 -0.0319
5. Longer life of building 0.67 0.0869 0.1005 0.1099
6. Water circulation 0.5
7. Greening 0.33 -0.0469 -0.0296
8. Mitigation of heat
island 0
(A) Sum of itemized
scores 0.0476 -0.0756 0.088 0.078
(B) Baseline effect -0.1125 -0.1966 -0.1888
Total effect (A+B) -0.0649 -0.0756 -0.1086 -0.1108
A leading explanation is based on future maintenance costs. If a feature of
a condominium incurs higher costs in maintenance and replacement of
equipments, the owner rationally discounts the initial transaction price by
subtracting the present value of future costs.
A longer life should be associated with a higher sale price because owner’s
costs of maintenance and renovation are significantly lower. The long life is
especially effective in Japan where condominiums have relatively short
economic lives. The estimated half life of condominium units is about 20 years
though not reported in the paper.
The use of eco-friendly materials can increase owner’s maintenance costs.
The durability of eco-friendly materials can be less than that of standard
materials, and it can be uncertain. If buyers expect higher maintenance costs
due to frequent replacements of more costly eco-friendly materials, initial
transaction prices can be discounted.
The water circulation system also requires more costly maintenance.
Additional machines and pipes need to be cleaned, fixed, and replaced more
frequently. Similarly, the greening-related discount can also be understood by
maintenance costs. A larger area with planting will cost owners for pruning
and cleaning.
A puzzling result is for the energy saving. The energy saving equipments
should lower the user cost of condominium owners, and thus it is more likely
associated with positive effects. However, there are only 190 units, or 13% of
total green units, that receive positive scores in this field. Given that energy
saving equipments are adopted widely even for non-green condominiums, the
energy saving criteria in the Tokyo Program may be too extreme. The required
level of energy savings in the program may be exceeding the break-even point
Another possible explanation is based on the omitted variables bias due
to unobservable quality differences. A condominium may be developed as a
green building in order to mitigate some negative factors in location or
developer characteristics. For example, if the development site is former
industrial site around which few green open spaces exist, the developer may
choose to make the project green in order to mitigate the unattractiveness of
the site. Another example is about developer’s negative characteristics. A less
competitive or less creditworthy developer may choose to develop green
condominiums in order to attract customers. Such less competitive developers
may be associated with price discounts via some unobservable factors. If such a
relation between unattractiveness and green developments systematically
exists, the green indicator may pick up negative effects of such omitted
negative characteristics.
On the first point on industrial sites, a massive amount of
redevelopments of former industrial sites actually occurred during the sample
period along newly opened Rinkai line in Koto ward. In our alalysis, we control
for unobservable negative impacts of such developments by indicator variables
for jurisdiction and railway line.
On the second point on developer characteristics, we do not have
developer information on all condominiums, but we do have developer
information on green condominiums. Based on casual investigations into
names of developers of green condominium, we do not find systematic tendency
that “low quality” developers develop green condominiums more frequently.
Rather we frequently observe large and creditworthy developers. It seems more
likely that developers of better quality are attenuating our negative estimates
V.
Conclusion
We find that green buildings may well be associated with price discounts
rather than premia. The value of green buildings critically depends on the
definition of green buildings, institutional settings, policy package, and user’s
preferences. Therefore, a particular result for a certain property type in a
jurisdiction or a country cannot be generalized without a condition. For
example, price premia that are reported in previous studies are mainly based
on energy efficient buildings. More empirical studies for different property
types in different areas are necessary in order to understand the value of green
buildings. Our list of extensions includes a study on commercial buildings in
Tokyo, and studies for other cities in Japan.
We also find that different environmental items result in very different
valuation. Each item is considered to have different effects in three dimensions;
technological effects on costs, policy-oriented effects on costs, and user’s
valuation. Our findings indicate that positive effects through policy and
preferences are still limited while increased technological costs are directly
capitalized. We conclude that much stronger policy measures are called for in
order to overcome the price discounts and even generate price premia for
Reference
Architectural Institute of Japan. 2000. Architectural Charter for a Global
Environment. Tokyo, Japan.
California’s Sustainable Building Task Force. 2003. The Costs and Financial
Benefits of Green Buildings. Sacramento, California.
Eichholtz, Piet M. and Kok, Nils and Quigley, John M. 2010. Doing Well by
Doing Good? Green Office Buildings. Forthcoming, American Economic
Review.
Fuerst, Franz & McAllister, Patrick. 2008. Green Noise or Green Value?
Measuring the Price Effects of Environmental Certification in Commercial
Buildings. MPRA Paper 11446, University Library of Munich, Germany.
Miller, N., Spivey, J. & Florance, A. 2008. Does Green Pay Off? Unpublished
Manuscript.
Pramerica Real Estate Investors. 2007. To Be Green or Not to Be Green? Why
that is Not the Question?
RREEF. 2007. The Greening of U.S. Investment Real Estate – Market
Fundamentals, Prospects and Opportunities.
RREEF. 2008. Globalization and Global Greening Trends in Green Real Estate
Investment.
RREEF. 2009. How Green a Recession? – Sustainability Prospects in the US
Real Estate Industry.
Rosen, Sherwin. 1974. Hedonic Prices and Implicit Markets: Product
Differentiation in Pure Competition, Journal of Political Economy, Vol.82,
pp34-55.
Yoshida, Jiro, John M. Quigley, and Chihiro Shimizu. 2010. The Effect of
Condominiums in Japan. University of Tokyo CSIS Discussion Paper, No.