http://dx.doi.org/10.4236/jep.2016.77095
Effects of Salt Pond Restoration on Benthic
Flux: Sediment as a Source of Nutrients to
the Water Column
Brent R. Topping
1, James S. Kuwabara
1, James L. Carter
1, Krista K. Garrett
1,
Eric Mruz
2, Sarah Piotter
3, John Y. Takekawa
31U.S. Geological Survey, Menlo Park, CA, USA 2U.S. Fish and Wildlife Service, Fremont, CA, USA 3U.S. Geological Survey, Vallejo, CA, USA
Received 13 May 2016; accepted 19 June 2016; published 22 June 2016
Copyright © 2016 by authors and Scientific Research Publishing Inc.
This work is licensed under the Creative Commons Attribution International License (CC BY).
http://creativecommons.org/licenses/by/4.0/
Abstract
B. R. Topping et al.
Keywords
Benthic Flux, Nutrients, Algal Blooms, Restoration
1. Introduction
Natural and anthropogenic processes accumulate surface-reactive solutes (i.e., certain organic and inorganic nu-trients and toxicants) in bed sediment over multiple (even decadal) time scales. While oxic, the sediments retain the solutes, but as reducing conditions occur (on a daily or seasonal basis), the solutes may desorb. As these so-lutes repartition and remobilize (sometimes becoming dissolved and thus part of the porewater), the resulting concentration gradient in interstitial waters drives benthic flux. Restoration efforts to expedite flushing and hence improve pond water quality may eventually lead to reduced porewater gradients for contaminants and/or macronutrients. However, these desired changes might not be seen for many years, lagging far behind any po-tential point-source (e.g., sewage treatment effluent) improvements. The decades-long accumulation of solutes in pond sediments will continue to support vertical concentration gradients across the sediment-water interface and the resultant benthic flux, until either the solute concentrations above and below the sediment-water inter-face re-equilibrate, or deposition of sufficient new sediment (with decreased solute concentrations of concern) diminishes the concentration gradient. In other words, nutrients sources in the sediment cannot be ignored when resource managers are proposing long-term water-quality improvements. Sediments may supply nutrients to the system, causing otherwise unexplained slow progress or even regression of water quality to undesirable condi-tions.
Prior to the mid-19th century, the San Francisco Bay estuary was surrounded by approximately 80,000 hec-tares of tidal wetlands. Beginning with the California Gold Rush in 1849, nearly 90% of these wetlands [1] were drained and diked. In terms of reclaiming wetlands, the salt production industry had a key role in converting ha-bitats surrounding the edge of the estuary. 20,000 hectares of wetlands were converted into a series of evapora-tion ponds [2]. Salt water from the estuary was used to fill the ponds for subsequent passive evaporation and salt harvesting. In 2003, a consortium of government and non-governmental organizations acquired ~16,000 hec-tares of San Francisco Bay salt ponds with the goal of restoration as wetlands [3]. All told, the project is the largest tidal marsh restoration on the Pacific Coast of the United States.
Specifically, after decades of use as evaporation ponds, the system would be gradually transitioned to allow steady flows through the ponds. The monitoring of water quality as part of the restoration process was given tremendous attention and resources. These now evolving ecosystems support terrestrial, aquatic and avian wild-life communities, as well as recreational areas of public interest and concern. In addition, pelagic and benthic algal communities, while less charismatic, form the base of the system’s food web. The nutrients and toxicants consumed by these organisms can be magnified up the food chain [4][5]. Therefore, collaborators were asked to examine the state of the sediment as a potential source or sink of toxicants and nutrients.
The primary objective of this study (from 2010 to 2012) is to determine if the sediment in decades-old salt ponds undergoing restoration to wetlands can represent a significant source or sink of nutrients for the overlying water relative to other solute-transport processes. The approach used here includes evaluating the diffusive ben-thic flux using a mechanical porewater sampler; a benben-thic flux comparison to an open water estuary; comparison between advective and benthic flux; and the role that macroinvertebrates may have on bioturbation to augment benthic solute flux.
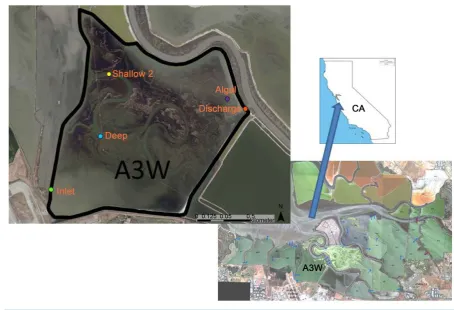
The Alviso Salt pond system, is located about 10 miles northwest of San Jose, California, and sits at the south end of the southernmost portion of San Francisco Bay, CA (Figure 1). A pond designated as “A3W” is shallow with an average depth of <1 m and a surface area of 2.27 km2. It is considered representative of many in the system by the authors and other agencies, and includes ongoing biological and water-column monitoring. Re-curring afternoon winds and its shallow depth keep the pond well-mixed, but it still exhibits frequent periods of anoxia during the summer [6].
Figure 1. Salt Pond A3W location, satellite photos, and sampling locations.
Secondary sites Discharge, Shallow 2 and Algal (located where 1 - 10 cm thick algal mats had been observed) were included for select analyses to account for biological heterogeneity in the pond (Figure 1). Salinity in the pond ranges from 15 to 26 PSU [6].
2. Materials and Methods
2.1. Field Methods
A non-metallic pore-water profiler [7][8] was used to determine the vertical concentration gradient of solutes near the sediment-water interface. Porewater samples were collected in acid-washed, all-plastic syringes at the Deep and Inlet sites on 30 June, 18 August, and 21 September 2010, and 27 June, 8 August, and 2 October 2012. These periods spanned the summer algal growth season, and those were the only years for which the work was funded. Porewaters were sampled at depths ranging from 1 - 10 cm. A vacuum, generated by pulling the syringe plunger mechanically via elastic tension, draws the sample in the syringe through a porous 30-µm frit followed by a 0.2-µm in-line syringe filter.
Concurrent with profiler deployments at Deep and Inlet sites, water-column samples were collected and con-tinuous measurements of water-column pH, temperature, dissolved oxygen, and salinity were recorded at 15-minute intervals [6]. Samples for benthic chlorophyll-a were collected by subcoring surface sediment grab samples.
B. R. Topping et al.
To estimate advection of nutrients in and out of the system, current velocities were measured and water-col- umn grab samples were collected at the “Inlet” and “Discharge” sites every 2 hours over a 24-hour cycle for both a neap and a spring tidal cycle [10]. Samples were filtered using 0.2 µm filters immediately after collection. Sediment cores (10 cm deep, 10 cm diameter) were collected in both sampling years at Inlet, Algal, Discharge, and Shallow 2 (Figure 1) to assess macroinvertebrate spatial variability, and thus the potential variability in bioturbation among sites.
2.2. Laboratory Methods
Sediment oxygen demand was determined by two methods: porewater diffusion and core incubation. Dissolved oxygen demand was difficult to accurately measure using porewater diffusion calculations due to the combina-tion of oxygen saturated overlying water and sediment that was anoxic at 1 cm depth. Thus, acrylic tubes were used to collect approximately 10 cm deep sediment cores from which overlying water was sampled at hourly in-tervals. Samples were analyzed for dissolved oxygen, and oxygen demand was calculated based on the concen-tration time series [11].
Dissolved (0.2-µm filtered) orthophosphate, ammonia, nitrate, nitrite and silica concentrations in both water- column and pore-water samples were determined in triplicate by low-volume, discrete single cuvette, spectro-photometric methods [12]. The method used for orthophosphate measured soluble reactive phosphate (SRP, i.e., only the soluble or 0.2-µm filtered fraction of total phosphate that can be measured by the established analytical reaction). Analytical and field blanks for all analyses used 18.2 MΩ water, UV-irradiated for removal of organ-ics.
Each sediment core was sieved at 500 µm for macroinvertebrates and sorted completely. Magnifications from 7× to 45× were used to sort and identify organisms, and macroinvertebrates were identified to Order or Class.
2.3. Calculations
Diffusive solute flux across the sediment-water interface was calculated using solute concentrations of the over-lying water and the first few centimeters of porewater using Fick’s Law [12][13].
The diffusive flux (Ji in units of µmoles of solute i per m2-hr) was calculated by the equation:
( )(
)
,
i i T
J =D
ϕ
dC dz ,where
Di,T is the diffusion coefficient of solute i at temperature T in cm2/s,
φ is the dimensionless sediment porosity, and
dCi/dz is the concentration gradient for solute i in the vertical direction in µmoles/L/cm.
These benthic-flux calculations (via solute-specific diffusion coefficients) assume that diffusion controls ben-thic flux [14]. Hence, the calculated benthic flux of dissolved solutes, based only on pore-water profiles, can be an underestimate (perhaps by an order of magnitude) due to processes that could increase mixing, such as bio-turbation, bioirrigation, wind resuspension, and potential groundwater inflows [15].
Values were normalized when necessary using log10 transformation prior to statistical comparisons. Compar-isons between sites or dates, or flux results from other studies, were assessed using paired t-tests. Differences are considered significant when p < 0.05, where p represents the probability that the differences are not significant. Data reported are means ± SD.
3. Results and Discussion
3.1. Benthic Flux Comparison with Open-Water Estuary
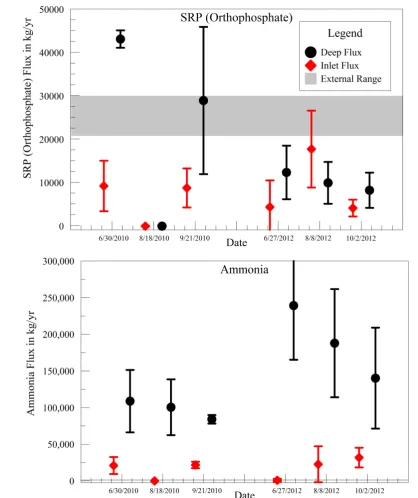
Benthic flux of SRP (orthophosphate) was frequently positive (i.e., out of the sediment into the water column,
Figure 2), occasionally negligible, but never negative. In other words, the pond sediment was typically a source, and never a sink for SRP in the overlying water column.
Figure 2. Orthophosphate and ammonia benthic flux load in kg/yr (based on 2.27 km2 area of pond A3W),
compared with estimate of external source.
within the pond exhibited a mean of 4.9 ± 1.4 g-P/m2/yr (n = 54), suggesting that the SRP flux in the pond sys-tem is much greater than that in the nearby open estuary. The seasonal and annual sys-temporal variability in SRP flux in the restoration pond is also greater than reported for the adjacent estuary. Weekly water-column sampling never showed orthophosphate to be depleted.
B. R. Topping et al.
water-column ammonia was intermittently near zero.
With the absence of any measurable concentration gradient, dissolved-nitrate fluxes were consistently neglig-ible in the pond (<0.1 g-N/m2/yr), in contrast to variable but generally positive nitrate fluxes reported for the ad-jacent estuary (mean of 2.7 ± 2.2 g-N/m2/yr; n = 18) [11][16]. Anoxic sediment, high oxygen demand and asso-ciated nitrate-reduction processes are consistent with the observed lack of nitrate in the pond porewater.
Dissolved-silica fluxes in the restoration pond exhibited a mean of 92 ± 38 g-SiO2/m2/yr (n = 53). The adja-cent estuary [11][16], using estimates that includebioturbation effects, exhibited a mean of 131 ± 32 g-SiO2/ m2/yr (n = 18), making silica the only macronutrient to have similar fluxes in the ponds and the open estuary. Si-lica concentrations in the water column gradually increased through the sampling period, perhaps due to algal succession from diatoms in June to other species which do not require silica [17].
The restoration pond exhibited orthophosphate and ammonia that are significantly larger than those previous-ly reported for southern San Francisco Bay. The combination of these fluxes, shallow water, moderate tempera-tures and abundant sunlight are consistent with observed eutrophic conditions [6]. Since these estimates do not account for other biogeochemical processes such as bioturbation, bioirrigation, wind resuspension, and potential groundwater inflows, they provide a conservative estimate of benthic flux in these shallow water ponds. Com-pared to nutrient fluxes measured in the northern component of San Francisco Bay (near Suisun Bay, approx-imately 100 km north of the pond) using the same porewater profiler approach [18], the pond benthic flux values were an order of magnitude higher for orthophosphate and ammonia. Significantly higher concentration of so-lutes in the pond porewater drives this diffusive-flux difference.
3.2. Nutrient Source Comparison: Advective vs. Benthic
To compare the relative importance of allochthonous and autochthonous sources of nutrients to the pond, both advective and benthic fluxes were scaled into kg/year units (based on the 2.27 km2 pond surface area). The mean benthic flux of ammonia over the period of study was about 49,900 ± 13,000 kg-N/yr. Advective flux estimates from the external exchange over the tidal cycle ranged from −50 to 1500 kg-N/yr of ammonia (Figure 2). This difference of nearly two orders of magnitude suggests that benthic flux is a major source of ammonia to the wa-ter column for primary production in the system. If nitrogen-fixing cyanobacwa-teria dominate primary production, this result may not be important because dissolved inorganic nitrogen would not be limiting. If non-nitrogen- fixing algal species are significant in the system, the magnitude of this benthic source also makes it unlikely that dissolved inorganic nitrogen would be a limiting nutrient.
In contrast to ammonia, the average benthic flux of SRP, 11,100 ± 3200 kg-P/yr, was below, but in the same order of magnitude as the advective flux range of 21,500 to 30,000 kg-P/yr. Although allochthonous SRP sources to the pond appear to dominate, the benthic SRP source should not be disregarded, especially if non- diffusive processes contribute significantly to the availability of SRP to the water-column.
3.3. Algal Growth and Limitation
The average mass ratio of nitrogen to phosphorous in the water column over all sampling sites and dates is 1.0 ± 0.5 or 7-times lower than the Redfield N:P ratio in phytoplankton of 7.2:1.0, indicating the possibility of N limi-tation. However, the reported presence of Anabaenopsis sp. and Anabaena sp., both N-fixing cyanobacteria [19], suggest that nitrogen is not consistently limiting. Shallow ponds are unlikely to exhibit significant light limita-tion of primary produclimita-tion [20], even during episodic sediment resuspension events.
Within the A3W pond system, autotrophic activity can generate benthic algal mats that are centimeters thick [13]. Water-column chlorophyll concentrations increased of the course of sampling each year, usually peaking in the early fall. Upon degradation, that biomass creates a benthic oxygen demand [21] that can bring about anoxia. If the timing of extended bloom periods can be identified, the subsequent senescence can be monitored in anticipation of oxygen depletion in the water-column. Resource and water-quality managers would thereby have a monitoring tool for responding to predicted events critical to habitat restoration (e.g., anoxic conditions, associated fish kills and degradation in avian habitat) [22].
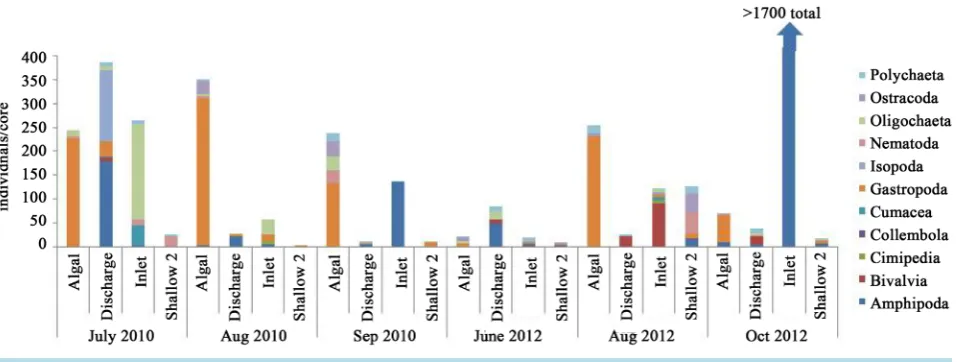
3.4. Macroinvertebrates: Potential Effects on Flux
Figure 3. Variable macroinvertebrate densities.
water interface. Unlike other benthic flux studies where benthic organisms were absent [23], macroinvertebrate assemblages were active throughout the study, though with densities that varied by 2 - 3 orders of magnitude among sites and times (Figure 3). This high variability suggests that benthic flux might vary on relatively short time scales (e.g. weekly to monthly) with changes in the abundance of benthic invertebrates (sometimes by avian predation) and species-specific activities.
4. Conclusions
Nutrients in shallow, estuarine, managed ponds, similar to shallow lakes, are influenced more by their benthic sources than deep water bodies due, at least in part, to the lower ratio of volume to bed-surface area. Benthic flux, even when calculated only from diffusion, can represent an important and potentially dominant nutrient source to the water column. This nutrient source should be regularly considered along with the focus on water flow through the system of ponds (i.e., advective transport). Despite management efforts to improve hydrologic exchange between the pond and adjacent estuary, it is likely that any return to natural conditions will take many years, possibly decades, similar to the time scales of solute accumulation in the pond beds.
As this large pond restoration project ends its first decade, we have only begun to understand the biogeo-chemical implications of restoration actions. However, these results do warrant consideration for restoration of any lentic system experiencing a legacy of contaminant deposition and accumulation, regardless of the mitiga-tion strategy adopted.
Acknowledgements
The authors are grateful for critical logistical support from J. Chiu, and personnel from the U.S. Geological Survey (USGS) including Stacy Moskal, Lacy Smith, Greg Shellenbarger and Francis Parchaso. Thanks also go to Melisa Helton of the Don Edwards San Francisco Bay National Wildlife Refuge, for their project support. The U.S. Fish and Wildlife Service, USGS WERC in Vallejo, California, USGS San Francisco Bay Priority Ecosystems Study, USGS Toxic Substances Hydrology Program, San Francisco Regional Water Quality Control Board and the National Research Program within the USGS Water Mission Area are also acknowledged for support of this work.
References
[1] Nichols, F.H., Cloern, J.E., Luoma, S.N. and Peterson, D.H. (1986) The Modification of an Estuary. Science, 231, 567- 573. http://dx.doi.org/10.1126/science.231.4738.567
[2] Nichols, D.R. and Wright, N.A. (1971) Preliminary Map of Historic Margins of Marshlands, San Francisco Bay, Cali-fornia. Open-File Report 71-216, 12 p. http://pubs.er.usgs.gov/publication/ofr71216
B. R. Topping et al.
[4] Kelly, B.C., Ikonomou, M.G., Blair, J.D., Morin, A.E. and Gobas, F.A. (2007) Food Web-Specific Biomagnification of Persistent Organic Pollutants. Science, 317, 236-239. http://dx.doi.org/10.1126/science.1138275
[5] Goodyear, K.L. and McNeill, S. (1999) Bioaccumulation of Heavy Metals by Aquatic Macro-Invertebrates of Different Feeding Guilds: A Review. Science of the Total Environment, 229, 1-19.
http://dx.doi.org/10.1016/S0048-9697(99)00051-0
[6] Helton, M., Brand, A., Piotter, S. and Takekawa, J.Y. (2011) 2010 Annual Self-Monitoring Report for South San Fran-cisco Bay Low Salinity Salt Ponds. U.S. Fish and Wildlife Service, 298 p. http://southbayrestoration.org/monitoring [7] Murphy, F., Kuwabara, J.S., Topping, B.R., Parchaso, F. and Myhre, R.C. (2011) Pore-Water Profiler. U.S. Patent
8,051,727 B1.
[8] Kuwabara, J.S., Lynch, D.D., Topping, B.R., Murphy, F., Carter, J.L., Simon, N.S., Parchaso, F., Wood, T.M., Lin-denberg, M.K., Wiese, K. and Avanzino, R.J. (2007) Quantifying the Benthic Source of Dissolved Nutrients to the Water Column of Upper Klamath Lake, Oregon. U.S. Geological Survey Open-file Report 2007-1276, 40 p.
http://pubs.usgs.gov/of/2007/1276/
[9] Parsons, T.R., Maita, Y. and Lalli, C.M. (1984) A Manual of Chemical and Biological Methods for Seawater Analysis. Pergamon Press, New York.
[10] Garret, K. (2012) Nutrient Fluxes of a Restored Salt Pond in San Francisco Bay. Senior Thesis, Whitman College.
[11] Topping, B.R., Kuwabara, J.S., Marvin-DiPasquale, M.C., Agee, J.L., Kieu, L.H., Flanders, J.R., Parchaso, F., Hager, S.W., Lopez, C.B. and Krabbenhoft, D.P. (2004) Sediment Remobilization of Mercury in South San Francisco Bay, California. U.S. Geological Survey Scientific Investigations Report 2004-5196, 59 p.
http://pubs.water.usgs.gov/sir2004-5196/
[12] Kuwabara, J.S., Topping, B.R., Lynch, D.D., Carter, J.L. and Essaid, H.I. (2009) Benthic Nutrient Sources to Hypereu-trophic Upper Klamath Lake, Oregon. Environmental Toxicology & Chemistry, 28, 516-524.
http://dx.doi.org/10.1897/08-207.1
[13] Topping, B.R., Kuwabara, J.S., Athearn, N.D., Takekawa, J.Y., Parchaso, F., Henderson, K.D. and Piotter, S. (2009) Benthic Oxygen Demand in Three Former Salt Ponds Adjacent to South San Francisco Bay, California. U.S. Geologi-cal Survey Open-File Report 2009-1180, 21 p. http://pubs.usgs.gov/of/2009/1180/
[14] Li, Y.-H. and Gregory, S. (1974) Diffusion of Ions in Sea Water and in Deep-Sea Sediments. Geochimicaet Cosmo-chimica Acta, 38, 703-714. http://dx.doi.org/10.1016/0016-7037(74)90145-8
[15] Boudreau, B.P. and Jorgensen, B.B. (2001) The Benthic Boundary Layer, Transport Processes and Biogeochemistry. Oxford University Press, New York.
[16] Topping, B.R., Kuwabara, J.S., Parchaso, F., Hager, S.W., Arnsberg, A.J. and Murphy, F. (2001) Benthic Flux of Dis-solved Nickel into the Water Column of South San Francisco Bay. U.S. Geological Survey Open-File Report 01-89, 50 p. http://pubs.water.usgs.gov/ofr01089/
[17] Lin, C.K. (1972) Phytoplankton Succession in a Eutrophic Lake with Special Reference to Blue-Green Algal Blooms.
Hydrobiologia, 39, 321-334. http://dx.doi.org/10.1007/BF00046648
[18] Kuwabara, J.S., Topping, B.R., Parchaso, F., Engelstad, A.C. and Greene, V.E. (2009) Benthic Flux of Nutrients and Trace Metals in the Northern Component of San Francisco Bay, California. U.S. Geological Survey Open-File Report 2009-1286, 26 p. http://pubs.usgs.gov/of/2009/1286
[19] Thebault, J., Schraga, T.S., Cloern, J.E. and Dunlavey, E.G. (2008) Primary Production and Carrying Capacity of For-mer Salt Ponds after Reconnection to San Francisco Bay. Wetlands, 28, 841-851. http://dx.doi.org/10.1672/07-190.1
[20] Cloern, J.E. (2001) Our Evolving Conceptual Model of the Coastal Eutrophication Problem. Marine Ecology Progress Series, 210, 223-253. http://dx.doi.org/10.3354/meps210223
[21] Shellenbarger, G.G., Schoellhamer, D.H., Morgan, T.L., Takekawa, J.Y., Athearn, N.D. and Henderson, K.D. (2008) Dissolved Oxygen in Guadalupe Slough and Pond A3W, South San Francisco Bay, California, August and September 2007. U.S. Geological Survey Open-File Report 2008-1097, 27 p. http://pubs.er.usgs.gov/publication/ofr20081097 [22] Takekawa, J.Y., Ackerman, J.T., Brand, L.A., Graham, T.R., Eagles-Smith, C.A., Herzog, M.P., Topping, B.R.,
Shel-lenbarger, G.G., Kuwabara, J.S., Mruz, E., Piotter, S.L. and Athearn, N.D. (2015) Unintended Consequences of Man-agement Actions in Salt Pond Restoration: Cascading Effects in Trophic Interactions. PLoS ONE, 10, e0119345.
http://dx.doi.org/10.1371/journal.pone.0119345