Munich Personal RePEc Archive
Human Capital Externalities and
Employment Differences across
Metropolitan Areas of the U.S.
Winters, John V
Auburn University Montgomery
1 May 2010
Online at
https://mpra.ub.uni-muenchen.de/22434/
Human Capital Externalities and Employment Differences across
Metropolitan Areas of the U.S.
John V. Winters*
May 2010
ABSTRACT
It has been well documented that employment outcomes often differ considerably across areas.
This paper examines the extent to which the local human capital level, measured as the share of
adults with a college degree, has positive external effects on labor force participation and
employment for U.S. metropolitan area residents. We find that the local human capital level has
positive externalities on participation for women, but an inconsistent effect on participation for
men. However, the local human capital level reduces unemployment for both men and women.
We also find that less educated workers generally receive the largest external benefits.
JEL Classification: J21, J24, R23
Keywords: employment; unemployment; human capital externalities; agglomeration
*Department of Economics, Auburn University Montgomery,PO Box 244023, Montgomery, AL 36124-4023, Phone (334) 244-3471, E-mail jwinter3@aum.edu
1
1. Introduction
Employment outcomes differ quite considerably across countries and regions. Even
within a developed country like the United States, there are still large differences in wages, labor
force participation, and unemployment across local labor markets. These geographic differences
in labor outcomes have powered a large literature seeking to explain their determinants. One
such determinant is the aggregate stock of human capital. The stock of human capital in a local
labor market is likely to be an important source of geographic differences in labor outcomes
because of both direct and external effects. The direct effects are obvious. Workers with greater
human capital are more productive, earn higher wages, and are more likely to be employed
(Psacharopoulos and Patrinos 2004). A number of researchers, however, have suggested that the
local level of human capital might have positive external effects on its residents.1 That is, high
human capital workers are thought to improve employment outcomes for other workers in the
area.
Much of the literature on human capital externalities has focused on differences in wages
and wage growth. A number of such studies have shown that wages in an area are positively
correlated with average education levels, even after controlling for individual worker
characteristics (e.g., Rauch 1993; Moretti 2004a; Glaeser and Saiz 2004). Whether this is causal,
though, is unclear. Workers likely sort into labor markets based on employment opportunities,
and the highly skilled are likely to be the most mobile and seek out areas with high quality
business environments (Chen and Rosenthal 2008; Combes, Duranton and Gobillon 2008).
Areas with otherwise strong labor markets, therefore, are likely to attract educated workers and
see their average education levels rise. Some studies such as Moretti (2004a) and Dalmazzo and
1
2
Blasio (2007a,b) use instrumental variables to try to isolate the effects of exogenous increases in
average education levels, but Lange and Topel (2006) question whether commonly used
instruments are valid.
Several studies also suggest a number of other important external effects of education.
Lochner and Moretti (2004) find that education decreases criminal activity and Milligan, Moretti
and Oreopoulos (2004) find that education increases civic participation. More generally, Shapiro
(2006) suggests that an educated populace increases the overall quality of life in an area. Doms,
Lewis, and Robb (2010) argue that more educated areas have higher rates of entrepreneurship
and more positive business outcomes. Researchers have also suggested that the positive external
effects of human capital cause initially highly educated areas to experience faster population and
employment growth as individuals flock to be near the highly educated (Glaeser, Scheinkman
and Shleifer 1995; Simon 1998, 2004; Black and Henderson 1999; Simon and Nardinelli 2002).
Furthermore, Berry and Glaeser (2005) and Winters (forthcoming) suggest that it is mostly
educated individuals who are moving to high human capital areas.2
Largely overlooked, however, have been the external effects of human capital on labor
force participation, employment, and unemployment rates.3 This paper seeks to fill that void by
examining the extent to which the local level of human capital has positive external effects on
the probability of labor force participation and employment for residents of metropolitan areas in
the U.S.4 In other words, controlling for an individual’s own education and other characteristics,
this paper seeks to address whether being in a highly educated labor market makes individuals
2
Florida (2002) also suggests that the concentration of Bohemians in an area plays an important role in attracting high human capital individuals.
3
A recent exception is a New York Times blog post by Ed Glaeser (2010), in which he shows that actual
unemployment in highly educated cities is less than what would be predicted based on national unemployment rates by education level and city-specific population shares by education level.
4
3
more likely to be employed. In much of the previous literature and in this paper, the local level
of human capital is measured as the share of the adult population with at least a four-year college
degree, sometimes referred to as the college share. There are surely elements of human capital
besides formal education (Bacolod, Blum and Strange 2009, 2010), but education is certainly an
important component of human capital.
A few previous studies have examined the effects of human capital measures on
aggregate employment outcomes (e.g., Simon 1988; Partridge and Rickman 1995; Nistor 2009),
but such results include direct effects as well as external effects. This study focuses on the
external effects of human capital on employment outcomes. We examine both the
cross-sectional relationship in 2000 and the relationship for metropolitan-level changes between 1980
and 2000. We also explore using the location of land grant institutions of higher education as an
instrumental variable for the local human capital level as suggested by previous literature. We
find that the local human capital level has positive externalities on the labor force participation of
women, but a less consistent effect on participation for men. However, the local human capital
level reduces unemployment for both men and women, with slightly larger effects for men.
Combining the two effects, we find fairly large positive externalities on the probability of
employment for both men and women. We also find that less educated workers generally
receive the largest external benefits.
2. Conceptual Framework
2.1 Human Capital Externalities on Productivity and Wages
A number of previous researchers have shown that there may be important external
4
education, experience and demographic characteristics. These external effects of the college
share are thought to occur for at least three reasons. First, there may be pecuniary externalities
due to imperfect substitution between high skilled and low skilled workers in the production
process (Katz and Murphy 1992; Moretti 2004a; Ciccone and Peri 2006). For example, suppose
that the aggregate production function can be represented by a constant returns to scale
Cobb-Douglas function of high skilled labor ( ), low skilled labor ( ), and capital ( ):
Holding all else constant, an increase in the quantity of high skilled workers will increase the
marginal productivity of low skilled workers, but will decrease the marginal productivity of high
skilled workers. If markets are competitive workers will be paid their marginal products.
Imperfect substitution will cause the wages of low skilled workers to rise with the share of high
skilled workers and cause the wages of high skilled workers to fall with the share of high skilled
workers.
A second source of human capital externalities comes from what Moretti (2004a) calls
human capital spillovers. Human capital spillovers occur when being near highly skilled
workers increases the skills of other workers.5 In other words, an individual’s productivity is
increased by learning from high skilled workers (Jovanovic and Rob 1989; Glaeser 1999;
Glaeser and Maré 2001).6 Spillovers, therefore, are thought to have positive effects on
productivity for all workers, though the magnitudes of spillovers may differ across types of
workers. For example, by having less knowledge and skills, low skill workers may have more
opportunities to learn from high skill workers and receive larger spillovers. Alternatively, if high
5
Skill accumulation results in both higher wages and faster wage growth (Glaeser and Maré 2001; Wheeler 2006). 6
5
skill workers are better at learning from other workers, they may learn more even if they have
fewer opportunities to learn. Therefore, the external effects of human capital are likely to differ
across worker skill levels both because of imperfect substitution and differential magnitudes of
spillovers. Moretti (2004a) finds that human capital externalities on wages are positive for
workers of all skill levels, but largest for the least skilled workers. This could be consistent with
both imperfect substitution and low skilled workers having more opportunities to learn.
A third source of human capital externalities discussed by Acemoglu (1996) results from
a pecuniary externality due to costly bilateral search between firms and workers. According to
Acemoglu (1996) skilled workers increase the productivity of physical capital, and an increase in
the skill level of workers causes firms to invest more in physical capital.7 The higher level of
physical capital then makes both high skill and low skill workers more productive. This results
in higher wages for all workers.
2.2 Human Capital Externalities on Employment
The external effects of human capital on productivity are also likely to affect the
probability of labor force participation, unemployment, and employment in a metropolitan area.
To illustrate, we present a simple labor supply model where workers gain skills through work
experience, skill accumulation increases both present and future wages, and skill accumulation is
greater in more skilled labor markets. Individual i must choose whether to supply his labor, ,
to the market. is a binary variable equal to one if the individual chooses to participate in the
labor force and 0 otherwise. For simplicity, this modeling abstracts from the fact that individuals
can choose how much labor to supply, i.e., how many hours to work. Individual i’s labor supply
decision will depend on the market wage that he is offered in the current period, , the net
7
6
present value of higher future wages from the skills that he acquires from working in the
present8, , and the individual’s opportunity cost of working, , i.e., the monetary value
of the utility that he would get from not working in the market. Individuals who do not work in
the market receive utility from producing and consuming non-market goods such as leisure and
family life. The individual’s labor supply decision can be represented as follows:
0 1
That is the individual will supply his labor if the benefits from doing so, , exceed the
costs, . Human capital externalities are, therefore, likely to affect labor force participation
both through the wage and through . High human capital cities pay higher wages and
facilitate greater skill accumulation through spillovers. Both of these will tend to increase labor
supply.
Human capital externalities will also affect unemployment if some component of
unemployment is “voluntary.” That is, when an individual is looking for a job and receives an
offer, he will take the job if the benefits of doing so exceed the costs, i.e., .
However, if the benefits are too low, he will reject the job offer and continue to look. Human
capital externalities increase wages and skill accumulation and make it more likely that an
individual will receive an acceptable offer. Together the external effects of human capital on
participation and unemployment suggest that there will be external effects of human capital on
the overall likelihood of employment. This paper examines the external effects of human capital
on all three outcomes: labor force participation, unemployment, and employment.
8
7
3. Empirical Framework and Data
This paper examines the external effects of the local human capital level on labor force
participation ( ), unemployment ( ), and employment ( ) using a two-step estimation procedure
for each.9 In the first stage, we model the separate probability of each outcome for individual
of gender in city in year as a linear function of a vector of individual characteristics, , and
a vector of city by year by gender fixed effects, :
,
,
.
The individual characteristics consist of a number of variables commonly found to affect
individual participation and employment outcomes and include dummy variables for highest
level of education completed, five year age group, marital status, the presence and number of
own children in the household, nonwage income10, whether an individual is Black, Hispanic,
Asian, or Other, citizenship status, and whether the individual lives in his or her state of birth.
We also allow the parameters for the individual characteristics, , to vary by year and gender.
The second step of the estimation for each outcome variable involves regressing the city
fixed effects for each outcome and gender on the share of adults in the city with a college degree,
, and a number of other city characteristics, . The second-stage regressions are weighted by
the metropolitan area sums of the individual weights from the first stage regressions. We first
examine the external effects of human capital using cross-sectional variation:
9
The two-step approach produces consistent estimates but is less efficient than an on e-step approach in which city-level variables are included in the first step. The two-step approach is implemented because the large number of observations make estimating the one-step approach impractical (e.g., infeasible using Stata/SE 10 with 1000 MB of memory) for the time-differenced models discussed below.
10
8 ,
,
.
However, if there are unobserved city characteristics that are correlated with both the college
share and the employment outcomes, the cross-sectional estimates of the s may be biased and
inconsistent. We attempt to obtain consistent estimates using two separate methods, instrumental
variables and differences over time.
Following Moretti (2004a) and Iranzo and Peri (2009), we use the presence of a
land-grant higher education institution in the metropolitan area as an instrument for the share of adults
in the metro area with a college degree or higher in the cross-sectional estimates. The presence
of a land-grant institution will be a valid instrument if it is correlated with the local human
capital level and uncorrelated with the error term. We can test for the first part of the
requirement, but not for the second if we have only one instrument. Land-grant institutions are
often thought to be a good instrument for the local human capital level because they were
established in the late 19th century and therefore are not affected by recent events. However, it
still could be the case that land-grant institutions improve local labor market opportunities
beyond the effect that they have on creating an educated population. For example, land grant
institutions may also bring external dollars into the local area through research grants or parental
transfers to students attending college. Such an inflow of dollars from outside the area might
strengthen the local demand for labor and improve employment outcomes for local residents. If
so, the presence of a land-grant institution would not be a valid instrument.
Our second approach is to estimate differenced models that remove any
9
Δ Δ Δ Δ ,
Δ Δ Δ Δ ,
Δ Δ Δ Δ ,
where Δ indicates differences over time. Some cities may have above average labor market
outcomes and a highly educated population because of time-invariant characteristics such as the
presence of a state or federal capital. The time-differenced models remove such time-invariant
characteristics. As a third approach, one might like to estimate time-differenced models that also
instrument for the human capital level. However, this approach is not adopted in the current
study. The presence of a land-grant institution does not change over time and it does not predict
changes in the human capital level over time, so it cannot be used as an instrument in
time-differenced models. Other instruments have been used to explain variations in the human capital
level over time such as the lagged age structure of the population (Moretti 2004a; Dalmazzo and
Blasio 2007a,b) and the push-driven immigration of highly educated workers (Iranzo and Peri
2009), but we are not confident in their appropriateness as instruments. The age structure of the
population for example has been suggested to have its own effect on wage and employment
outcomes by at least a few studies (e.g., Elhorst 1995; Shimer 2001). Similarly, immigrants are a
small part of the skilled labor force in most local labor markets and it is unclear if the external
effects of skilled immigrants are the same as the external effects of skilled natives.
The data in this study come primarily from the 1980 and 2000 decennial census 5%
microdata samples available from IPUMS (Ruggles et al. 2008). There are a couple of important
limitations with the use of this data. First, the IPUMS data do not allow identification of
geographic areas with populations less than 100,000. Consequently, the lowest level of
10
include both metropolitan and non-metropolitan areas. We, therefore, assign each county group
(PUMA in 2000) to a metropolitan area if more than 50 percent of the population of the county
group (PUMA) is contained within the metropolitan area. Using this procedure, results in 283
metropolitan areas that can be identified in both 1980 and 2000. The second limitation, which is
closely related to the first, is that metropolitan area definitions change over time, but the data
limitations discussed above prevent us from being able to use perfectly consistent geographic
definitions for all metropolitan areas. Thus, the inconsistency in geographic definitions could
lead to measurement error and add considerable noise to our estimations.
The sample investigated includes all individuals between the ages of 25 and 55 who
resided in one of the 283 metropolitan areas that are identified in both 1980 and 2000. We limit
the sample to prime-age workers because the young and old often have weaker attachment to the
labor force. Note also that all regressions include all prime-age individuals regardless of their
labor force participation status. Thus the effect on employment will be equal to the effect on
labor force participation minus the effect on unemployment. While the sample is limited to
prime-age individuals, the construction of the city-level explanatory variables often are not. For
example, the share of adults with college degrees is constructed using all persons age 25 and
over.
Additional city-level explanatory variables include a number of factors thought to affect
labor supply, labor demand, or both.11 As outlined in the theoretical framework, the wage is one
important variable. Juhn, Murphy and Topel (1991, 2002) argue that the national decrease in
male employment rates since 1967 can be largely explained by falling real wages. In the present
study, wages are measured as the regression-adjusted average log wage in the city computed as
11
11
the city fixed effects, , in a gender-specific log wage regression on individual characteristics
and city fixed effects:
.
Higher wages are expected to increase the supply of labor and reduce the demand for labor.12
Therefore, the wage is expected to increase participation but also increase unemployment
(Blackaby and Manning 1992; Partridge and Rickman 1995, 1997). The overall effect on
employment is the difference between these two effects and is somewhat ambiguous.
The next variable is the mean commute time for persons who commute to work. Black,
Kolesnikova, and Taylor (2008a) argue convincingly that longer commute times in a city reduce
labor force participation rates, especially for married women. Similarly, we also expect longer
commutes will increase unemployment and decrease employment. We also include the log of
employment density in the city as an explanatory variable. Dense concentrations of economic
activity have been consistently shown to increase productivity, and it may also be true that
employment density positively affects participation and employment. Furthermore, workers with
unobserved skills might sort into dense areas. Thus, we expect that the log of employment
density will have a positive effect on participation and employment and a negative effect on
unemployment.
Our next two city-level variables are based on labor demand effects due to the industry
mix in the city. The first of the two is the predicted unemployment rate, , in city in year
based on the city’s current industry mix and the industry-specific national unemployment rate
for industry in year , , as follows:
12
12
, where measures the share of the labor force in city and year that is currently employed
in or was most recently employed in industry . The predicted unemployment rate is expected to
have a negative effect on participation and employment and a positive effect on unemployment
in a city (Armstrong and Taylor 2000). Previous literature has also suggested that industrial
diversity might reduce unemployment in an area (e.g., Simon 1988; Diamond and Simon 1990;
Neumann and Topel 1991; Partridge and Rickman 1995, 1997). Following previous literature
we construct a city-specific industry Herfindahl Index, , as a measure of industrial diversity
as follows:
, where is the share of employment in city and year that is in industry . In other words,
is computed as the sum of the squared city- and year-specific industrial shares. Larger values
of the Herfindahl Index mean that employment is relatively more concentrated in a few
industries. Therefore, is expected to have a negative effect on participation and employment
and a positive effect on unemployment.
A few studies have also suggested that the age structure of the population might affect
employment outcomes, though there is disagreement on the expected effects. Elhorst (1995)
suggests that a relatively young population will increase unemployment and a relatively older
population will reduce unemployment. Shimer (2001), however, argues that a larger share of
young workers actually decreases unemployment and increases participation and employment.
13
we measure the youth share as the share of the population between the ages of 16 and 24.
Second, we measure the elderly population as the share of the population ages 65 and older.
Previous literature has also suggested that unemployment rates are increased by the
generosity of unemployment insurance benefits (e.g., Partridge and Rickman 1995; Moomaw
1998). We, therefore, next include a measure of the generosity of unemployment benefits in the
local labor market. We measure unemployment generosity for each state by dividing total state
expenditures on unemployment insurance, computed from census of government data, by the
total number of weeks workers were unemployed during the year, computed from March Current
Population Survey (CPS) data. We then assign the unemployment generosity of states to
metropolitan areas wholly within the state’s boundaries. If a metro area crosses states, its
unemployment generosity is computed as a population weighted average of the unemployment
generosity of the states it spans. The variable is then converted to logs.
Finally, we also include a measure of the cost of housing in the metropolitan area.
Housing costs are measured as the regression-adjusted average log rent in the city computed as
the city fixed effects, , in a regression of log rents on a vector of housing characteristics, , and
city fixed effects:
.
Rents are used instead of housing values because the former is a better measure of the present
user cost of housing (Winters 2009).13 Higher rents reflect higher land costs, which are expected
to reduce the demand for labor and increase unemployment. However, higher rents may also
increase participation, especially for women, if households need a second earner to pay for the
more expensive housing (Black, Kolesnikova, and Taylor 2008b; Johnson 2009). The effect of
rents on the probability of employment is ambiguous.
13
14
Summary statistics for the city-level cross-sectional variables are provided in Table 1.
The labor force, unemployment, and employment ratios are city-level means and do not account
for differences in individual characteristics across cities, i.e., these are not the city fixed effects
used as the dependent variables in the second step of the estimations. Ratios are reported by
gender and education levels. By definition, the percentage of the population that is employed is
equal to the percentage of the population in the labor force minus the percentage of the
population that is unemployed. As seen, men have higher mean participation and employment
rates than women, but mean unemployment ratios are similar for men and women. The table
also shows that participation, unemployment, and employment ratios vary considerably across
education groups with participation and employment increasing with education and
unemployment decreasing with education. Finally, the table also shows that there is meaningful
variation across cities for all of the ratios, but the variation across cities decreases with the
education level. In other words, the variation in employment outcomes across cities is largest for
the least educated workers suggesting that they might be the most affected by local labor market
conditions.
4. Empirical Results
This section discusses the empirical results for the external effects of human capital on
the probability of labor force participation, unemployment, and employment. We first present
cross-sectional results for the year 2000 that treat the local human capital level as exogenous,
which we often refer to as the OLS results. We then present cross-sectional results for 2000 in
which we instrument for the local human capital level using the presence of a land-grant
15
those for 2000 both when we treat the human capital level as exogenous and when we instrument
for it using land-grant institutions; these results are not presented to conserve space. Finally, we
present results for differences over time between 1980 and 2000, which remove any
time-invariant characteristics of cities, but treat changes in the human capital level between 1980 and
2000 as exogenous. Equations are estimated separately for women and men.
4.1 Cross-Sectional OLS Results
Tables 2a and 2b present OLS results for women and men both without and with the
additional city-level controls discussed above. All results include the individual controls, and the
results can be interpreted as external effects of human capital. The results in Tables 2a and 2b
suggest that the share of adults with a college degree has a positive external effect on the
probability of labor force participation (LFP) for both men and women that is statistically
significant at the one percent level. The effects on LFP are larger for women than men,
especially when the additional city-level controls are included. The effects are also larger with
additional controls for both men and women. The female coefficient of 0.158 with additional
controls suggests that a 0.10 increase in the share of adults with college degrees externally
increases female LFP by 0.0158, i.e., by about 1.6 people per 100. For males a 0.10 increase in
the share of adults with college degrees externally increases LFP by 0.0093. These are both
economically significant effects.
The results in Table 2a and 2b also suggest that the college share externally decreases
unemployment for both men and women, both with and without additional city-level controls.
The effects are again larger with the additional controls but are now slightly larger for men than
for women. The coefficient of -0.071 for men suggests that a 0.10 increase in the share of adults
16
per 1000. The effect for women is 6.5 women per 1000. Again, these effects are quite
meaningful, especially given that less than 3.5 percent of the sample is unemployed.
The results so far suggest that the human capital level externally increases labor force
participation and decreases the percentage of the population that is unemployed. Together these
effects mean that the human capital level will externally increase the percent of the population
that is employed. By definition, the effect on employment is equal to the effect on LFP minus
the effect on unemployment. According to the results, the effects on employment are larger with
the additional controls than without, and the effects are larger for women than for men. The
results with additional controls suggest that a 0.10 increase in the college share externally
increases the share of the population that is employed by 0.0223 for women and by 0.0164 for
men. Again, these effects have considerable economic significance.
Tables 2a and 2b also report the results for the additional city-level explanatory variables.
The log wage has a positive effect on participation for both women and men with statistically
significant coefficients of 0.095 and 0.039. The log wage has a positive coefficient in both of the
unemployment regressions, but the effects are not statistically significant at conventional levels.
The overall effect of the log wage on employment is positive for both women and men, but the
effect is only significant for women with a coefficient of 0.076. The mean commute time
reduces participation for both men and women with significant coefficients of -0.005 and -0.002.
Similarly, mean commute time has a positive coefficient in the unemployment equations, though
is only significant for females with an effect of 0.0004. Commute time also significantly reduces
employment with coefficients of -0.005 and -0.002 for women and men. Log employment
density has a statistically insignificant effect in all of the female regressions, but a significantly
17
-0.004 for male employment; this result for men is in contrast to our initial expectations. The
predicted unemployment rate has the expected sign in the regressions for both women and men
but is only statistically significant for men. Predicted unemployment decreases male
participation with a coefficient of -1.646, increases male unemployment with a coefficient of
0.807, and decreases male employment with a coefficient of -2.453. The industry Herfindahl
Index has the expected sign in all of the regressions except female unemployment but is not
statistically significant in any of the regressions. The percent of the population age 16-24
significantly worsens outcomes for both men and women. The youth share reduces participation
with coefficients of -0.279 for women and -0.249 for men, increases unemployment with
coefficients of 0.099 and 0.085, and decreases employment with coefficients of -0.378 and
-0.334. This is contrast to the results in Shimer (2001). Somewhat surprisingly, the share of the
population age 65 and over also worsens outcomes, though the effects are only significant for
male participation and male employment. The senior share reduces both with coefficients of
-0.169 for participation and -0.170 for employment. Unemployment insurance generosity has an
insignificant effect on participation for both women and men, but significantly increases
unemployment with a coefficient of 0.006 for women and 0.010 for men. Unemployment
insurance also reduces employment for both, though the effect is only significant for men with a
coefficient of -0.013. Finally, log rent has a statistically insignificant effect in all of the
regressions. The remaining regressions in this paper all include the additional city-level
explanatory variables, but we do not present their results. Results for these variables are
available by request.
We next examine OLS external effects of human capital by education level. Moretti
18
also suspect that less skilled individuals receive larger external effects of human capital on
participation and employment due to greater spillovers. We separate individuals into four groups
by education: 1) those with less than a high school degree, 2) those with a high school degree or
equivalent but no college, 3) those with some college but without a four-year degree, and 4)
those with a four-year college degree or higher. Table 3 presents OLS results for the external
effects of human capital for the total population and for each of the four education groups
separately for men and women. These results include all of the individual controls as well as the
additional city-level controls. In the education group regressions the log wage variable is also
education-specific. Each result is from a separate regression.
The results in Table 3 are generally consistent with the expectation that less skilled
workers receive the largest human capital externalities. For women, the effect on LFP is largest
for the two least educated groups, with coefficients of 0.251 and 0.300, which are nearly twice as
large as the average effect for the total population. For females with some college the effect is
still important with a coefficient of 0.183, but for four-year college graduates there appears to be
no effect on LFP. For men, the effects on LFP vary by education to a lesser extent. The two
least educated groups have coefficients of 0.133 and 0.148, while the two most educated groups
have coefficients of 0.110 and 0.062, all of which are statistically significant at the one percent
level. The effects on unemployment are also decreasing in absolute value with education for
both men and women and are statistically significant for all groups. For women the
unemployment coefficients decrease from -0.112 to -0.085 to -0.062 to -0.025. For men the
respective unemployment coefficients by education group are -0.118, -0.094, -0.065, and -0.019.
Again, the effect on employment is equal to the effect on LFP minus the effect on
19
four-year college degree. The female coefficients for employment by education group are 0.364,
0.385, 0.245, and 0.000. These effects are very large for the two lowest education groups.
These magnitudes suggest that a 0.10 increase in the college share externally increases the share
of the female population with no college that is employed by nearly 0.04, i.e., by nearly 4 people
per 100. For men the employment coefficients by education are 0.251, 0.242, 0.175, and 0.081.
Though smaller than the effects for women (except for college graduates), these are still large
and meaningful effects.
The results thus far paint an interesting picture of external effects of human capital on
LFP, unemployment, and employment. We view these as important relationships that have gone
largely unnoticed. Importantly though, the local human capital level is unlikely to be completely
exogenous. Workers sort into the labor market that gives them the highest utility and highly
educated workers are generally the most mobile across areas. Thus while the results in Tables 2
and 3 are certainly interesting, we cannot be certain that the external effects of human capital are
truly causal. We next pursue two complementary approaches intended to provide some insight
into the causal link between the local human capital level and employment externalities. Our
first approach is to instrument for the local human capital level using the presence of a land-grant
institution in the metropolitan area. Our second approach is to examine the relationship between
differences over time in employment outcomes and the local human capital level. Neither
approach is definitive, but together they are quite suggestive.
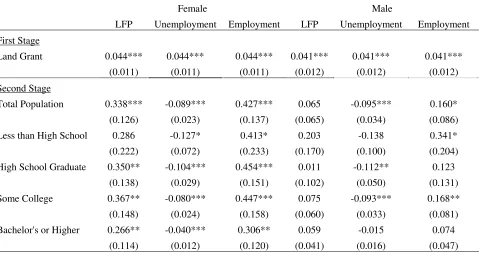
4.2 Cross-Sectional IV Results
Table 4 presents the IV estimates of the external effects of human capital on LFP,
unemployment, and employment by gender and education. The regressions include all of the
20
show that the land-grant variable is a significant predictor of the college share at the one percent
level. The presence of a land-grant institution increases the share of adults with a four-year
college degree by 0.044 in the female regressions and by 0.041 in the male regressions. The
land-grant coefficients differ slightly across gender because the city-level wage variable included
as a control is gender-specific. Although not shown, the land-grant coefficients also vary slightly
in the education-specific regressions because in these regressions the wage variable is also
education-specific. However, the land-grant coefficients for each gender by education group do
not vary among the three outcomes because the first-stage is the same for each.
Looking at the second stage results, we see that the external effects of the local human
capital level on female labor force participation are significantly increased relative to the OLS
results in Table 3. The coefficient for the total population is 0.338 which is quite large. The
female LFP coefficients are also quite large for each education group and are statistically
significant for all except high school dropouts. From the least educated to the most educated, the
female LFP IV coefficients are 0.286, 0.350, 0.367, and 0.266. Given the magnitude of the
coefficient, we interpret the lack of statistical significance for high school dropouts as due to
imprecision rather than there being no effect. The result for female college graduates also differs
from the OLS estimates where the coefficient was slightly negative and not statistically
significant. For male LFP, the story is quite different from the OLS estimates. While the IV
coefficients are positive for the total population and for all education groups, the effects are not
statistically significant for any of the groups. Thus the land-grant instrument suggests a strong
positive external effect of the college share on female LFP but a weaker and less consistent effect
21
Turning to the unemployment results, the IV coefficients for women are larger in
absolute value than their OLS counterparts for the total population and for each education group.
The female unemployment coefficient for the total population is -0.089. The coefficients from
the least educated group to the most educated are -0.127, -0.104, -0.080, and -0.040, with all
being significant at the 10 percent level or greater. For males, the IV unemployment coefficients
are significant for the total population and for high school graduates and those with some
college. The coefficient for the total population is -0.095, and the coefficients from the least to
most educated are -0.138, -0.112, -0.093, and -0.015. The IV estimates, therefore, suggest that
the human capital level decreases unemployment for most groups with effects decreasing with
the level of education.
The IV estimates also suggest large external effects of the college share on employment.
For women the employment coefficient is 0.427 for the total population suggesting that a 0.10
increase in the share of adults with a college degree increases female employment by nearly 4.3
women per 100. This is a very economically meaningful effect. The effects on female
employment are also large and significant for each education group with coefficients of 0.413,
0.454, 0.447, and 0.306. For men, the effects of the college share on employment are
statistically significant for the total population and for high school dropouts and those with some
college. The coefficient for the total population is 0.160 and the coefficients by education group
are 0.341, 0.123, 0.168, and 0.074. The IV estimates, therefore, suggest that the external effects
of the local human capital level on employment are meaningful for both sexes but considerably
22
4.3 Time-Differenced Results
Table 5 presents the results from the time-differenced models in which the dependent and
explanatory variables are measured as city-level differences between 1980 and 2000. The time
differencing removes any time-invariant characteristics of cities that might bias estimates. All
regressions include the additional individual and city-level controls. The results suggest that the
human capital level externally increases female labor force participation for the total population
with a coefficient of 0.154. The time-differenced female LFP coefficients by education group
are significant at the 10 percent level for all groups except college graduates (p=0.171) with
coefficients of 0.182, 0.211, 0.183, and 0.070. For male LFP, though, the story told by the
time-differenced coefficients is somewhat different. The coefficient for the total population is
relatively small (0.046) and not quite statistically significant (p=0.135). The male LFP
coefficients by education group (-0.092, 0.078, 0.086, and 0.051) are statistically significant for
the three most educated groups but negative (though not significant) for high school dropouts.
The time-differenced estimates, therefore, paint an inconsistent picture of human capital
externalities on male participation.
The unemployment results from the time-differenced regressions suggest that changes in
the local human capital level significantly reduce female unemployment with a coefficient of
-0.072 for the total population. The female unemployment coefficients by education group are
-0.077, -0.103, -0.066, and -0.007 and are statistically significant for all but college graduates.
For males the time-differenced unemployment effects are larger than those for females and are
even larger than the male OLS cross-sectional effects. The time-differenced male
unemployment coefficient is -0.117 for the total population and -0.178, -0.164, -0.088, and
time-23
differenced estimates do not consistently support the existence of human capital externalities on
male LFP, they do provide considerable support for the existence of human capital externalities
on male unemployment.
We last examine the time-differenced estimates of human capital externalities on
employment. Recall that the effect on employment equals the effect on LFP minus the effect on
unemployment. For females the human capital level has a statistically significant external effect
on employment for the total population with a coefficient of 0.226. The female employment
coefficients from the least educated to the most educated are 0.259, 0.314, 0.249, and 0.077, all
of which are statistically significant but the last (p=0.193). Increases in the human capital level
increase male employment for the total population with a significant coefficient of 0.163. The
male employment coefficients by education group from the lowest to highest are 0.085, 0.243,
0.174, and 0.078, all of which are statistically significant except for high school dropouts.14
The time-differenced estimates, therefore, generally suggest positive human capital
externalities on employment for men and women with larger effects for women. Interestingly,
the contributions of participation effects and unemployment effects appear to differ by gender.
For men most of the effect comes through decreased unemployment. For women, though, the
participation effect contributes more to the overall effect on employment. Similar results hold
for the IV estimates as well. This is consistent with labor force participation being more
responsive to labor market conditions for females than for males.
14
24
5. Conclusion
This paper investigates the extent to which the local level of human capital, as measured
by the share of adults with a college degree, has positive external effects on the probability of
labor force participation and employment for residents of metro areas. Previous literature has
given considerable attention to human capital externalities on wages, but the external effects on
participation, employment, and unemployment have been largely overlooked. However, if
proximity to skilled workers increases skill accumulation, the local human capital level is also
likely to affect participation, unemployment and employment.
We first document the external effects of human capital on participation, unemployment,
and employment using cross-sectional data from the 2000 census and treating the local human
capital level as exogenous. However, the local human capital level at a point in time is unlikely
to be exogenous. We try to offer additional insight into the causal effect of human capital
externalities on employment outcomes using two approaches, instrumental variables and
differences over time. Neither is definitive, but together they provide some important results.
This paper finds that the local human capital level has positive externalities on the
probability of employment for both men and women, with effects generally larger for women.
For men most of this effect is due to decreased unemployment, and there is inconsistent evidence
of human capital externalities on male labor force participation. For women, though, the
increase in employment from human capital externalities is due to both increased labor force
participation and decreased unemployment, with the majority of the effect due to increased
participation. There are also important differences by education level. Less educated individuals
generally receive the largest external benefits and four-year college graduates often receive very
25
References
Acemoglu, Daron. 1996. “A Microfoundation for Social Increasing Returns in Human Capital
Accumulation,” Quarterly Journal of Economics, 111(1), 779–804.
Armstrong, Harvey and Jim Taylor. 2000. Regional Economics and Policy, Third Edition.
Oxford: Blackwell.
Bacolod, Marigee, Bernardo Blum, and William C. Strange. 2009. “Skills and the City,” Journal
of Urban Economics, 65(2), 2009, 127-135.
Bacolod, Marigee, Bernardo Blum, and William C. Strange. 2010. “Elements of Skill: Traits,
Intelligences, Education, and Agglomeration,” Journal of Regional Science, 50(1),
245-280.
Berliant, Marcus, Robert R. Reed III, and Ping Wang. 2006. “Knowledge Exchange, Matching,
and Agglomeration,” Journal of Urban Economics, 60, 69-95.
Berry, Christopher R. and Edward L. Glaeser. 2005. "The Divergence of Human Capital Levels
across Cities," Papers in Regional Science, 84, 407-444.
Black, Dan, Natalia Kolesnikova, and Lowell J. Taylor. 2008a. “Why Do So Few Women Work
in New York (and So Many in Minneapolis)? Labor Supply of Married Women Across
U.S. Cities,” Federal Reserve Bank of St. Louis Working Paper 2007-043C.
Black, Dan, Natalia Kolesnikova, and Lowell J. Taylor. 2008b. “Local Price Variation and Labor
Supply Behavior,” Federal Reserve Bank of St. Louis Working Paper 2008-016A.
Black, Duncan and Vernon Henderson. 1999. “A Theory of Urban Growth,” Journal of Political
Economy,107, 252-284.
Blackaby, D. H. and D. N. Manning. 1992. “Regional Earnings and Unemployment – A
26
Chen, Yong and Stuart S. Rosenthal. 2008. “Local Amenities and Life-Cycle Migration: Do
People Move for Jobs or Fun?” Journal of Urban Economics, 64, 519-537.
Ciccone, Antonio and Giovanni Peri. 2006. “Identifying Human Capital Externalities: Theory
with Applications,” Review of Economic Studies, 73, 381-412.
Combes, Pierre-Philippe, Gilles Duranton, and Laurent Gobillon, 2008, “Spatial Wage
Disparities: Sorting Matters!” Journal of Urban Economics, 63, 723-742.
Dalmazzo, Alberto and Guido de Blasio. 2007a. “Production and Consumption Externalities of
Human Capital: An Empirical Study for Italy,” Journal of Population Economics, 20,
359-382.
Dalmazzo, Alberto and Guido de Blasio. 2007b. “Social Returns to Education in Italian Local
Labor Markets,” Annals of Regional Science, 41, 51–69.
Diamond, Charles A. and Curtis J. Simon. 1990. “Industrial Specialization and the Returns to
Labor,” Journal of Labor Economics, 8(2), 175-201.
Doms, Mark, Ethan Lewis, and Alicia Robb. 2010. “Local Labor Force Education, New
Business Characteristics, and Firm Performance,” Journal of Urban Economics, 67(1),
61-77.
Elhorst, J. Paul 1995. “Unemployment Disparities between Regions in the European Union,” In
H. W. Armstrong and R. W. Vickerman (eds.), Convergence and Divergence among
European Unions, London: Pion.
Elhorst, J. Paul. 2003. “The Mystery of Regional Unemployment Differentials: Theoretical and
Empirical Explanations,” Journal of Economic Surveys, 17(5), 709-748.
Florida, Richard. 2002. “Bohemia and Economic Geography,” Journal of Economic Geography,
27
Fu, Shihe. 2007. “Smart Café Cities: Testing Human Capital Externalities in the Boston
Metropolitan Area,” Journal of Urban Economics, 61, 86-111.
Glaeser, Edward L. 1999. “Learning in Cities,” Journal of Urban Economics, 46(2), 254-277.
Glaeser, Edward L. 2010. “Teach Your Neighbors Well.” New York Times blog post on March
30, 2010, Accessed on April 10, 2010.
Glaeser, Edward L. and D.C. Maré. 2001. “Cities and Skills,” Journal of Labor Economics,
19(2), 316-342.
Glaeser, Edward L. and Albert Saiz. 2004. “The rise of the Skilled City,” Brookings-Wharton
Papers on Urban Affairs, 47-94.
Glaeser, Edward L., Jose A. Scheinkman, and Andrei Shleifer. 1995. “Economic Growth in a
Cross-Section of Cities,” Journal of Monetary Economics,36, 117-143.
Henderson, J. Vernon. 2007. “Understanding Knowledge Spillovers,” Regional Science and
Urban Economics, 37, 497-508.
Iranzo, Susana and Giovanni Peri. 2009. “Schooling Externalities, Technology, and Productivity:
Theory and Evidence from U.S. States,” Review of Economics and Statistics, 91(2), 420–
431.
Johnson, William R. 2009. “House Prices and Female Labor Force Participation,” University of
Virginia Working Paper.
Jovanovic, Boyan and Rafael Rob. 1989. “The Growth and Diffusion of Knowledge,” Review of
Economic Studies, 56(4), 569-582.
Juhn, Chinhui, Kevin M. Murphy, and Robert H. Topel. 1991. “Why Has the Natural Rate of
Unemployment Increased over Time?” Brookings Papers on Economic Activity, 1991(2),
28
Juhn, Chinhui, Kevin M. Murphy, and Robert H. Topel. 2002. “Current Unemployment,
Historically Contemplated,” Brookings Papers on Economic Activity, 2002(1), 79-116.
Katz, Lawrence F. and Kevin M. Murphy. 1992. “Changes in Relative Wages, 1963–1987:
Supply and Demand Factors,” Quarterly Journal of Economics, 107(1), 35–78.
Lange, Fabian, and Robert Topel. 2006. “The Social Value of Education and Human Capital,” in
Eric. Hanushek and Finis Welch (Eds.), Handbook of the Economics of Education.
Amsterdam: Elsevier.
Lochner, Lance and Enrico Moretti. 2004. “The Effect of Education on Crime: Evidence from
Prison Inmates, Arrests, and Self-Reports,” American Economic Review, 94(1), 155-189.
Milligan, Kevin, Enrico Moretti, and Philip Oreopoulos. 2004. “Does Education Improve
Citizenship? Evidence from the U.S. and the U.K.,” Journal of Public Economics, 88(9),
1667–1695.
Moomaw, Ronald L. 1998. “Experience Rating and the Generosity of Unemployment Insurance:
Effects on County and Metropolitan Unemployment Rates,” Journal of Labor Research,
19(3), 543-560.
Moretti, Enrico. 2004a. “Estimating the Social Return to Higher Education: Evidence from
Longitudinal and Repeated Cross-Sectional Data,” Journal of Econometrics,121,
175-212.
Moretti, Enrico. 2004b. “Human Capital Externalities in Cities,” in J. Vernon Henderson and
Jacques-Franois Thisse (Eds.), Handbook of Regional and Urban Economics.
Amsterdam: Elsevier.
Neumann, George R. and Topel, Robert H. 1991. “Employment Risk, Diversification, and
29
Nistor, Adela. 2009. “Assessing the Effectiveness of Human Capital Investments on the
Regional Unemployment Rate in the United States: 1990 and 2000,” International
Regional Science Review,” 32(1), 65-91.
Partridge, Mark D. and Dan S. Rickman. 1995. “Differences in State Unemployment Rates: The
Role of Labor and Product Market Structural Shifts,” Southern Economic Journal, 62,
89–106.
Partridge, Mark D. and Dan S. Rickman. 1997. “The Dispersion in US State Unemployment
Rates: The Role of Market and Non-market Equilibrium Factors,” Regional Studies, 31,
593–606.
Psacharopoulos, George and Harry A. Patrinos. 2004. “Returns to Investment in Education: A
Further Update,” Education Economics, 12(2), 111-134.
Rauch, James E. 1993. “Productivity Gains from Geographic Concentration of Human Capital:
Evidence from the Cities,” Journal of Urban Economics,34, 380-400.
Rosenthal, Stuart S., and William C. Strange. 2008. “The Attenuation of Human Capital
Spillovers,” Journal of Urban Economics, 64, 373-389.
Ruggles, Steven, Matthew Sobek, Trent Alexander, Catherine A. Fitch, Ronald Goeken, Patricia
Kelly Hall, Miriam King, and Chad Ronnander. 2008. Integrated Public Use Microdata
Series: Version 4.0 [Machine-readable database]. Minneapolis, MN: Minnesota
Population Center [producer and distributor].
Shapiro, Jesse M. 2006. “Smart Cities: Quality of Life, Productivity, and the Growth Effects of
Human Capital,” Review of Economics and Statistics, 88, 324-335.
Shimer, Robert. 2001. “The Impact of Young Workers on the Aggregate Labor Market,”
30
Simon, Curtis J. 1988. “Frictional Unemployment and the Role of Industrial Diversity,”
Quarterly Journal of Economics, 103, 715–728.
Simon, Curtis J. 1998. “Human Capital and Metropolitan Employment Growth,” Journal of
Urban Economics,43, 223-243.
Simon, Curtis J. 2004. “Industrial Reallocation across U.S. Cities, 1977–97,” Journal of Urban
Economics,56, 119-143.
Simon, Curtis J. and Clark Nardinelli. 2002. “Human Capital and the Rise of American Cities,
1900–1990,” Regional Science and Urban Economics, 32, 59-96.
Wheeler, Christopher H. 2001. “Search, Sorting, and Urban Agglomeration,” Journal of Labor
Economics, 19, 879-899.
Wheeler, Christopher H. 2006. “Cities and the Growth of Wages among Young Workers:
Evidence from the NLSY,” Journal of Urban Economics, 60(2), 162-184.
Winters, John V. 2009. “Wages and Prices: Are Workers Fully Compensated for Cost of Living
Differences?” Regional Science and Urban Economics, 39(5), 632-643.
Winters, John V. Forthcoming. “Why Are Smart Cities Growing? Who Moves and Who Stays,”
31
Table 1: Summary Statistics for Metropolitan-Level Variables, 2000
Variable Mean Std. Dev. Min Max
% of Females in Labor Force, Total Population 0.744 0.049 0.530 0.876 % of Females in Labor Force, Less than High School 0.540 0.066 0.337 0.780 % of Females in Labor Force, High School Graduate 0.714 0.050 0.518 0.903 % of Females in Labor Force, Some College 0.784 0.038 0.636 0.892 % of Females in Labor Force, Bachelor's or Higher 0.828 0.033 0.667 0.915 % of Females Unemployed, Total Population 0.031 0.011 0.009 0.086 % of Females Unemployed, Less than High School 0.062 0.025 0.000 0.175 % of Females Unemployed, High School Graduate 0.036 0.012 0.002 0.095 % of Females Unemployed, Some College 0.027 0.009 0.000 0.056 % of Females Unemployed, Bachelor's or Higher 0.015 0.006 0.000 0.043 % of Females Employed, Total Population 0.713 0.056 0.490 0.851 % of Females Employed, Less than High School 0.479 0.071 0.290 0.735 % of Females Employed, High School Graduate 0.678 0.056 0.486 0.878 % of Females Employed, Some College 0.757 0.043 0.612 0.866 % of Females Employed, Bachelor's or Higher 0.813 0.034 0.656 0.906
% of Males in Labor Force, Total Population 0.862 0.040 0.638 0.936 % of Males in Labor Force, Less than High School 0.698 0.074 0.404 0.862 % of Males in Labor Force, High School Graduate 0.842 0.044 0.629 0.939 % of Males in Labor Force, Some College 0.892 0.033 0.732 0.962 % of Males in Labor Force, Bachelor's or Higher 0.941 0.021 0.857 0.991 % of Males Unemployed, Total Population 0.035 0.012 0.012 0.083 % of Males Unemployed, Less than High School 0.066 0.024 0.008 0.150 % of Males Unemployed, High School Graduate 0.042 0.015 0.013 0.085 % of Males Unemployed, Some College 0.030 0.010 0.000 0.067 % of Males Unemployed, Bachelor's or Higher 0.016 0.007 0.000 0.044 % of Males Employed, Total Population 0.827 0.047 0.590 0.911 % of Males Employed, Less than High School 0.632 0.079 0.329 0.831 % of Males Employed, High School Graduate 0.801 0.050 0.579 0.907 % of Males Employed, Some College 0.862 0.036 0.695 0.933 % of Males Employed, Bachelor's or Higher 0.925 0.023 0.844 0.986
% of Adults with Bachelor's or Higher 0.264 0.080 0.113 0.546 Ln Wage FE Females 0.193 0.111 -0.032 0.546 Ln Wage FE Males 0.182 0.109 -0.046 0.577 Mean Commute Time 22.983 3.794 15.496 38.922 Ln Employment Density 4.181 0.910 1.984 7.803 Predicted Unemployment Rate 0.050 0.002 0.038 0.058 Industry Herfindahl Index 0.154 0.023 0.113 0.260 % of Population Age 16-24 0.134 0.036 0.073 0.341 % of Population Age 65+ 0.125 0.030 0.052 0.284 Ln Unemployment Insurance Benefits 4.633 0.411 3.326 5.561 Ln Rent FE 0.142 0.217 -0.312 0.936 Notes: N=283. All variables are for 2000.
32
Table 2a: OLS External Effects of Human Capital on LFP, Unemployment, and Employment for Females, 2000
LFP Unemployment Employment
% of Adults with Bachelor's or Higher 0.093*** 0.158*** -0.034*** -0.065*** 0.128*** 0.223*** (0.032) (0.035) (0.008) (0.008) (0.037) (0.037) Ln Wage FE Females 0.095** 0.018 0.076*
(0.042) (0.012) (0.046)
Mean Commute Time -0.005*** 0.0004*** -0.005***
(0.001) (0.0001) (0.001)
Ln Employment Density -0.002 0.001 -0.003
(0.003) (0.001) (0.003)
Predicted Unemployment Rate -0.665 0.220 -0.885
(1.021) (0.213) (1.084)
Industry Herfindahl Index -0.042 -0.010 -0.032
(0.142) (0.028) (0.149)
% of Population Age 16-24 -0.279*** 0.099*** -0.378***
(0.105) (0.024) (0.111)
% of Population Age 65+ -0.053 0.022 -0.075
(0.073) (0.016) (0.079)
Ln Unemployment Insurance Benefits -0.001 0.006*** -0.007
(0.005) (0.001) (0.006)
Ln Rent FE -0.021 -0.001 -0.020
(0.019) (0.005) (0.019)
R2 0.06 0.47 0.12 0.45 0.09 0.52
Notes: N=283. Robust standard errors in parentheses. *Significant at 10%; **Significant at 5%; ***Significant at 1%.
33
Table 2b: OLS External Effects of Human Capital on LFP, Unemployment, and Employment for Males, 2000
LFP Unemployment Employment
% of Adults with Bachelor's or Higher 0.085*** 0.093*** -0.035*** -0.071*** 0.120*** 0.164*** (0.020) (0.025) (0.010) (0.012) (0.028) (0.033) Ln Wage FE Females 0.039** 0.004 0.035
(0.019) (0.011) (0.025)
Mean Commute Time -0.002*** 0.0002 -0.002***
(0.0003) (0.0002) (0.0005)
Ln Employment Density -0.002 0.002* -0.004*
(0.002) (0.001) (0.002)
Predicted Unemployment Rate -1.646** 0.807** -2.453***
(0.660) (0.380) (0.924)
Industry Herfindahl Index -0.133 0.054 -0.186
(0.085) (0.046) (0.115)
% of Population Age 16-24 -0.249*** 0.085** -0.334***
(0.061) (0.034) (0.080)
% of Population Age 65+ -0.169*** 0.001 -0.170**
(0.049) (0.027) (0.067)
Ln Unemployment Insurance Benefits -0.003 0.010*** -0.013***
(0.003) (0.001) (0.003)
Ln Rent FE -0.002 0.004 -0.006
(0.010) (0.005) (0.013)
R2 0.14 0.45 0.08 0.40 0.15 0.47
34
Table 3: OLS External Effects of Human Capital by Gender and Education, 2000
Female Male
LFP Unemployment Employment LFP Unemployment Employment Total Population 0.158*** -0.065*** 0.223*** 0.093*** -0.071*** 0.164***
(0.035) (0.008) (0.037) (0.025) (0.012) (0.033) Less than High School 0.251*** -0.112*** 0.364*** 0.133** -0.118*** 0.251***
(0.064) (0.026) (0.066) (0.053) (0.026) (0.062) High School Graduate 0.300*** -0.085*** 0.385*** 0.148*** -0.094*** 0.242***
(0.045) (0.010) (0.050) (0.038) (0.017) (0.048) Some College 0.183*** -0.062*** 0.245*** 0.110*** -0.065*** 0.175***
(0.035) (0.008) (0.037) (0.022) (0.015) (0.032) Bachelor's or Higher -0.025 -0.025*** 0.000 0.062*** -0.019** 0.081*** (0.031) (0.007) (0.032) (0.017) (0.008) (0.022) Notes: Each result is from a separate regression and includes the additional city-level controls. N=283. Robust
35
Table 4: IV Estimates of External Effects of Human Capital by Gender and Education, 2000
Female Male
LFP Unemployment Employment LFP Unemployment Employment First Stage
Land Grant 0.044*** 0.044*** 0.044*** 0.041*** 0.041*** 0.041*** (0.011) (0.011) (0.011) (0.012) (0.012) (0.012)
Second Stage
Total Population 0.338*** -0.089*** 0.427*** 0.065 -0.095*** 0.160* (0.126) (0.023) (0.137) (0.065) (0.034) (0.086) Less than High School 0.286 -0.127* 0.413* 0.203 -0.138 0.341*
(0.222) (0.072) (0.233) (0.170) (0.100) (0.204) High School Graduate 0.350** -0.104*** 0.454*** 0.011 -0.112** 0.123
(0.138) (0.029) (0.151) (0.102) (0.050) (0.131) Some College 0.367** -0.080*** 0.447*** 0.075 -0.093*** 0.168**
(0.148) (0.024) (0.158) (0.060) (0.033) (0.081) Bachelor's or Higher 0.266** -0.040*** 0.306** 0.059 -0.015 0.074 (0.114) (0.012) (0.120) (0.041) (0.016) (0.047) Notes: Each result is from a separate regression and includes the additional city-level controls. N=283. Robust
36
Table 5: Time Differenced External Effects of Human Capital on LFP, Unemployment, and Employment, 1980-2000
Female Male
LFP Unemployment Employment LFP Unemployment Employment Total Population 0.154* -0.072*** 0.226** 0.046 -0.117*** 0.163***
(0.080) (0.025) (0.093) (0.031) (0.037) (0.059) Less than High School 0.182* -0.077* 0.259** -0.092 -0.178*** 0.085
(0.106) (0.046) (0.120) (0.059) (0.059) (0.095) High School Graduate 0.211** -0.103*** 0.314*** 0.078** -0.164*** 0.243***
(0.103) (0.030) (0.116) (0.039) (0.049) (0.072) Some College 0.183** -0.066*** 0.249** 0.086*** -0.088** 0.174***