http://dx.doi.org/10.4236/ojic.2015.51003
How to cite this paper: Wang, L.M., Zhuang, L.Q., Xin, H., Huang, Y.X. and Wang, D.Q. (2015) Semi-Quantitative Estimation of Ce3+/Ce4+ Ratio in YAG:Ce3+ Phosphor under Different Sintering Atmosphere. Open Journal of Inorganic Chemistry, 5, 12- 18. http://dx.doi.org/10.4236/ojic.2015.51003
Semi-Quantitative Estimation of Ce
3+
/Ce
4+
Ratio in YAG:Ce
3+
Phosphor under Different
Sintering Atmosphere
Lianming Wang, Liqiang Zhuang, Hao Xin, Yuexia Huang, Deqiang Wang
*Key Laboratory for Ultrafine Materials of Ministry of Education, School of Materials Science and Engineering, East China University of Science and Technology, Shanghai, China
Email: *[email protected]
Received 17 November 2014; revised 5 December 2014; accepted 5 January 2015
Copyright © 2015 by authors and Scientific Research Publishing Inc.
This work is licensed under the Creative Commons Attribution International License (CC BY).
http://creativecommons.org/licenses/by/4.0/
Abstract
In order to confirm the relationship between the luminescence and the ratio of Ce3+/Ce4+ more
clearly, a series of YAG:Ce3+ (Yttrium Aluminum Garnet, Y2.94Al5O12:0.06Ce3+) phosphors were pre-
pared under different sintering atmosphere. A semi-quantitative analysis based on X-ray photoe-lectron spectroscopy (XPS) was introduced to study the mole ratio of Ce3+/Ce4+ in the as-synthe-
sized YAG:Ce3+ phosphors. The results indicated that the percentage of Ce3+/(Ce3+ + Ce4+) reached
88.46% under the reduction atmosphere. The emission intensity of YAG:Ce3+ phosphors was
in-creased significantly with the increasing of Ce3+ concentration.
Keywords
YAG:Ce3+ Phosphor, Semi-Quantitative Estimation, Luminescence, Ratio of Ce3+/Ce4+, XPS,
Reduction Atmosphere
1. Introduction
As a classic yellow emission phosphor, YAG:Ce3+ is one kind of widely used phosphor due to its high quantum efficiency, good thermal conductivity and wide wave band properties. It has been extensively studied in both the preparation methods and luminescence properties. However, the prepared material always contains Ce4+ which does not contribute to luminescence theoretically. In order to strengthen the emission intensity, sintering under reduction atmosphere and charge compensation are usually adopted method to increase the Ce3+ content in YAG:Ce3+ materials.
Generally, cerium compounds exhibit complex features due to hybridization with ligand orbitals and fraction-al occupancy of the vfraction-alence 4f orbitfraction-als. Although some theory and researches have been elaborated, absolute as-signment of the features has not been made. In the study of Edmond Abi-aad et al. [1], the Ce 3d XPS spectra of the CeO2 prepared with different alkali solutions (KOH, NH4OH) have the same shape with six peaks at Bes (Binding Energies) 882.5, 888.7, 898.2, 900.7, 907.6 and 916.5 (±0.2) eV, respectively. In the case of M. Cabala et al. [2], they observed splitting of cerium 3d core level in two doublets corresponding to configuration 3d94f1 components at binding energies of 904.5 eV, 886.0 eV and 3d94f2 at 900.3 eV, 881.9 eV, respectively. CHAI Chunlin et al. [3] carried out the XPS analysis of sample CeO2/Si, they believed the peak of 881.34 eV was at-tributed to Ce3d signal of non stoichiometric CeO2 and the characteristic peak of Ce3+—884.9 eV and 903.4 eV were obtained. In order to determine the oxidation state of Ce in Ce0.9Fe0.1O1.97, Ying Zuo et al. [4] evaluated the XPS spectra of Ce (3d) region and three doublets from CeO2 and two doublets from Ce2O3 could be identified. The assignment of Ce4+ 3d component (3d5/2: 882.6 eV, 888.6 eV, 898.3 eV; 3d3/2: 901.1 eV, 907.3 eV, 916.8 eV) and Ce3+ 3d component (3d5/2: 885.4 eV; 3d3/2: 903.7 eV) from XPS spectra were collected. A number of related works have been done [5]-[9].
In this paper, the proportion of Ce3+/Ce4+ was measured using the XPS method. In a word, there will be dis-placement of the BEs and the analysis should be carried out on the basis of different cerium compounds. In or-der to confirm the relationship between the luminescence and the ratio of Ce3+/Ce4+ more clearly, a series of YAG:Ce3+ phosphors were prepared under different sintering atmospheres. The relationship between the ratio of Ce3+/Ce4+ and the luminescence was studied by XPS as a semi-quantitative method.
2. Experimental
YAG:Ce3+ phosphors were synthesized via the conventional high temperature solid-state reaction method. The stoichiometric amount of Y2O3 (99.999%), Al2O3 and Ce2O3 (99.999%) were weighted accurately (Y2.94Al5O12: 0.06Ce) and then well mixed and grinded using planetary ball mill. The samples were placed in a ceramic heater at 1550˚C for 2 h. The only difference is the sintering atmosphere: with both carbon powder and flowing nitro-gen atmosphere, with carbon powder but no nitronitro-gen, with nitronitro-gen atmosphere but no carbon powder, the last with neither of them.
Both emission spectrum and excitation spectrum of the phosphor were measured by a ZOLIX Omni-λ lumi-nescence photolumilumi-nescence (PL) spectrophotometer (Xe lamp). We also measured the surface states of cerium electrodes by using a AXIS Ultra DLD X-ray photoelectron spectroscopy (XPS). The Al Kα line was used as an X-ray source. The minimum resolution was 0.48 eV (Ag 3d5/2). Microscopy of the phosphor was measured on a Hitachi S4800 scanning electron microscope (SEM).
3. Results and Discussion
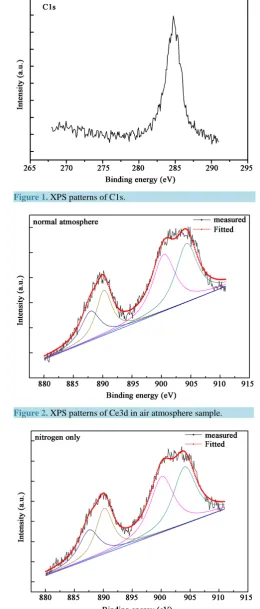
The binding energies were generally using the C 1s peak (284.7 eV) as a standard (Figure 1). According to the standard XPS spectra, the characteristic peak of Ce3+ 3d5/2 and Ce3+ 3d3/2 is 884 eV and 902 eV, respectively. Then for Ce4+ is eV and respectively. When the chemical environment of atomic changed, there will be dis-placement of the BEs of inner electrons.
In our case, the instrument automatically identified the Ce3d5/2 at 899.9eV. Although the displacement of BEs happens, according to related reports [10], the maximum value would be 17.9 eV. So combined with measured data we inferred the peak of 899.9 eV was consist of Ce3+ 3d5/2 and Ce4+ 3d3/2. In consideration of these factors and the obtained data, we identify the 882 eV, 888 eV, 899 eV and 903 eV as the fitting peaks.
Figures 2-5 show the XPS spectra of Ce 3d of four YAG:Ce3+ samples, by a binding energy scan from 880 to
910 eV at a rate of 100 meV per step and a 40 eV pass energy. The dwell time was 120 ms. All the spectra were fitted and the areas of each fitting peak were measured. It is well known that the fraction of Ce3+ ions can be ob-tained by calculating the ratio of peak areas: f (Ce3+) = area (Ce3+)/area (Ce3+ + Ce4+). The linear background was subtracted before curve fitting.
Figure 2 showed the XPS patterns of Ce3d sintered in air. Four peaks of binding energy were observed to be
Figure 1. XPS patterns of C1s.
Figure 2. XPS patterns of Ce3d in air atmosphere sample.
[image:3.595.179.418.499.704.2]Figure 4. XPS patterns of Ce3d in carbon monoxide only atmosphere sample.
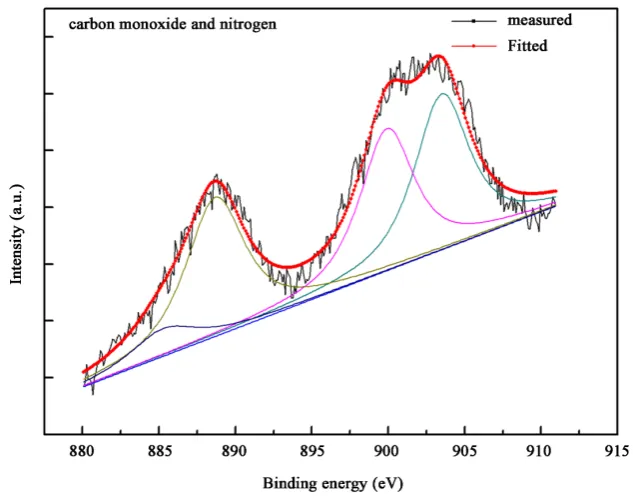
Figure 5. XPS patterns of Ce3d in carbon monoxide and nitrogen atmosphere sample.
Table 1. Calculation of the ratio of Ce3+/(Ce3+ + Ce4+) sintered in air.
Ce3+ 3d5/2 Ce3+ 3d3/2 Ce4+ 3d5/2 Ce4+ 3d3/2
Peak eV 890.301 904.47 888.131 900.611
Half-widths 3.09 4.07 4.01 4.83
Area 9007.23 6529.135 3961.859 3301.55
Sum 15536.365 7263.409
[image:4.595.88.538.620.721.2]The XPS patterns of Ce3d sintered in nitrogen atmosphere was showed in Figure 3. Peaks at 887.5111 eV was for Ce4+ 3d5/2, 890.151eV for Ce3+ 3d5/2, 900.131 eV for Ce4+ 3d3/2 and 904.061 eV for Ce3+ 3d3/2, respec-tively.Table 2 showed the calculated result. The ratio of Ce3+ is about 75.33% while Ce4+ is about 24.67%. The concentration of O2 was low in nitrogen atmosphere. This reason will prevent some Ce3+ oxidized to Ce4+. So the ratio of Ce3+ sintered in nitrogen is bigger than sintered in air.
Figure 4 indicated the XPS patterns of Ce3d sintered in carbon monoxide atmosphere. Peaks at 889.181eV
was for Ce4+ 3d5/2, 891.811 eV for Ce 3+
3d5/2, 902.131 eV for Ce 4+
3d3/2 and 905.601 eV for Ce 3+
3d3/2, respec-tively. Table 3 showed the calculated result. The ratio of Ce3+ is about 77.55% while Ce4+ is about 22.45%. Some Ce4+ was reduced to Ce3+ by carbon monoxide in carbon monoxide atmosphere under high temperature. So the ratio of Ce3+ sintered in carbon monoxide atmosphere is bigger than sintered in the two kinds of atmos-phere referred above.
Figure 5showed the XPS patterns of Ce3d sintered in carbon monoxide and nitrogen mixed atmosphere. The
peaks at 885.262 eV and 899.923 eV were for Ce4+ 3d5/2, and 888.669 eV, 903.507 eV were for Ce3+ 3d5/2, re-spectively. The calculated result was showed in Table 4. The ratio of Ce3+ is about 88.46% while Ce4+ is about 11.54%. In the mixed atmosphere, oxidation of some Ce3+ to Ce4+ were prevented due to the lack of O2, while some Ce4+ were reduced to Ce3+ by carbon monoxide. So the ratio of Ce3+ was the largest sintered in mixed at-mosphere.
Figure 6 showed the emission spectra of samples prepared under different sintered atmosphere. The YAG:
Ce3+ phosphor sintered under carbon monoxide and nitrogen atmosphere showed the strongest luminescence. The sample has the biggest ratio of Ce3+/(Ce3++Ce4+) (88.46%) in the four conditions. The lowest luminescent was sintered in air, which possess the ratio of Ce3+/(Ce3+ + Ce4+) 68.14%. It can be preliminary confirmed that with the increasing of the ratio of Ce3+, the emission intensity increases gradually.
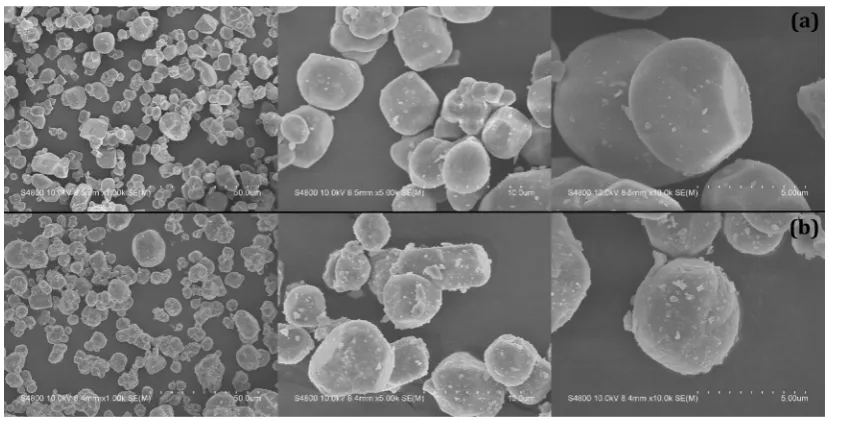
Figure 7gives the SEM images of YAG:Ce3+ phosphors prepared with: a) normal atmosphere and b) carbon
monoxide and nitrogen, respectively. We can see that the different sintering atmosphere has no influence on the SEM pictures. Both of them have some conglomeration phenomenon which is common in high temperature sol-id state reaction method and the crystallites were irregular spheres.
Figure 6. The emission spectra of YAG:Ce3+ phosphors under different sintering atmosphere.
Table 2. Calculation of the ratio of Ce3+/(Ce3+ + Ce4+) sintered in nitrogen atmosphere.
Ce3+ 3d5/2 Ce3+ 3d3/2 Ce4+ 3d5/2 Ce4+ 3d3/2
Peak eV 890.151 904.061 887.511 900.131
Half-widths 3.53 4.75 4.15 4.88
Area 12864.954 9900.169 4474.192 2982.79
Sum 22765.123 7456.982
Figure 7. SEM images of YAG:Ce3+ phosphors prepared with: (a) Air atmosphere; (b) Carbon monoxide and ni-trogenatmosphere.
Table 3. Calculation of the ratio of Ce3+/(Ce3+ + Ce4+) sintered in carbon monoxide atmosphere.
Ce3+ 3d5/2 Ce3+ 3d3/2 Ce4+ 3d5/2 Ce4+ 3d3/2
Peak eV 891.811 905.601 889.181 902.131
Half-widths 3.97 4.48 3.48 4.5
Area 15664.42 14062.6 5163.849 3442.57
Sum 29727.02 8606.419
Ratio % 77.55 22.45
Table 4. Calculation of the ratio of Ce3+/(Ce3+ + Ce4+) sintered in carbon monoxide and nitrogen mixed atmosphere.
Ce3+ 3d5/2 Ce3+ 3d3/2 Ce4+ 3d5/2 Ce4+ 3d3/2
Peak eV 888.669 903.507 885.262 899.923
Half-widths 4.622 4.259 5.125 4.247
Area 14898.14 8591.221 1838.019 1225
Sum 23489.361 3063.019
Ratio % 88.46 11.54
4. Conclusion
In conclusion, XPS was used as a semi-quantitative method to determined the mole ratio of Ce3+/(Ce3+ + Ce4+) in phosphor. The percentage of Ce3+ was 88.46%, 77.55%, 75.33% and 68.14% under four different sintering atmosphere. It confirmed that under the same preparation conditions and within the quenching concentration, the high ratio of Ce3+/(Ce3+ + Ce4+) could enhance the emission intensity in phosphor.
Acknowledgements
[image:6.595.89.538.475.577.2]References
[1] Abi-Aad, E., Bechara, R., Grimblot, J., et al. (1993) Preparation and Characterization of CeO2 under an Oxidization
Atmosphere. Thermal Analysis, XPS, and EPR Study. Chemistry of Materials, 5, 793-797.
http://dx.doi.org/10.1021/cm00030a013
[2] Cabala, M., Veltruská, K. and Matolín, V. (2007) Adsorption Properties of Ce/Ag System. WDS’07 Proceedings of Contributed Papers, Part III, 134-139.
[3] Chai, C.L., Yang, S.Y., Liu, Z.K., et al. (2003) Violet/Blue Photoluminescence from CeO2 Thin Film. Chinese Science
Bulletin, 48, 1198-1200. http://dx.doi.org/10.1007/BF03183935
[4] Zuo, Y., Li, L.P., Huang, X.S., et al. (2014) Ce0.9Fe0.1O1.97/Ag: A Cheaper Inverse Catalyst with Excellent Oxygen
Storage Capacity and Improved Activity towards CO Oxidation. The Royal Society of Chemistry, 4, 402-410.
[5] Mullins, D.R., Overbury, S.H. and Huntley, D.R. (1998) Electron Spectroscopy of Single Crystal and Polycrystalline Cerium Oxide Surfaces. Surface Science, 409, 307-319. http://dx.doi.org/10.1016/S0039-6028(98)00257-X
[6] Yu, X.W., Yan, C.W., Cao, C.A., et al. (2003) XPS Analysis of the Cerium Conversion Coating on the Anodized Al6061/SiCp. Journal of Materials Science and Technology, 19, 157-160.
[7] Wen, M.F., Yu, B., Wang, Q.P., et al. (2004) Study on the Properties of Nanometer CeO2 Doped with Zr4+, La3+, Pr3+.
Journal of Materials Science and Technology, 20, 357-360.
[8] Luo, L.Z., Wang, X.L., Fu, X.G., et al. (2004) Study on Surface and Bulk Properties of Ce-5% Lanthanum Alloy.
Journal of Rare Earths, 22, 22-25.
[9] Wang, P., Wang, D.-J., Song, J., et al. (2012) Incorporation of Si-O Induced Valence State Variation of Cerium Ion and Phase Evolution in YAG:Ce Phosphors for White Light Emitting Diodes. Journal of Materials Science: Materials Electronic, 23, 1764-1769. http://dx.doi.org/10.1007/s10854-012-0659-z