© 2018, IRJET | Impact Factor value: 6.171 | ISO 9001:2008 Certified Journal | Page 3052
SEISMIC EVALUATION OF BUILDINGS WITH POSTTENSIONED BEAMS BY
NON-LINEAR STATIC ANALYSIS
T.Hari prasadh
1, T.Anand
21PG Student, Department of Civil Engineering, Kumaraguru college of Technology, Coimbatore-641049.
2Assistant Professor, Department of Civil Engineering, Kumaraguru college of Technology, Coimbatore-641049.
---***---ABSTRACT: The present study compares the seismic performance of a typical RC framed structure of an overall plan dimension of 24m x 24m having panel size of 8m x 8m with the following three variations in its frame modelling. The first model consists of a conventional RC frame with all beams and columns as RCC. RCC peripheral beams consider as a second model and interior beams with PT (Post Tensioned) tendons and beams having PT tendons in third model. The models studied are varied in height from Ground + eleven stories to Ground + fifteen stories with square shaped cross section of columns. The column height is considered as 3m for each floor. If fifteen models is carried out a Static Nonlinear Pushover analysis generated in SAP2000 software. The post tensioned members are analyzed using ADAPT software. G+11 to G+15 story frames are performed Seismic with peripheral RC beams and internal PT beams is found to be the best, followed by frames with all RC beams because the formation of “collapse” hinge is less observed. Frames are Performed with all PT beams is slightly below that with all RC beams. Finally, observed all PT beams with frames are performed quite good even without any separate lateral force resisting system.
Key Words: Seismic evaluation, pushover analysis of reinforced concrete floors and post-tensioned floors, pre-compression, performance point.
1. INTRODUCTION
If many concrete structures are faint severely by earthquakes, have indicated the need for evaluating the seismic adequacy of existing buildings. About 60% of the land area of our country is susceptible to damaging levels of seismic hazard. Don't abstain from future earthquakes, but preparedness and safe building construction practices can certainly reduce the extent of damage and loss. In order to strengthen and resist the buildings for future earthquakes, some procedures have to be adopted. If Static pushover analysis is mostly used for seismic performance evaluation of existing and new structures. In particular, the seismic rehabilitation of older concrete structures in high seismically areas is a matter of growing concern, since structures vulnerable to damage must be identified and an acceptable level of safety must be determined. To make such computation, simplified linear-elastic methods are not sufficient.
Post tensioned concrete floor has become quite popular now-a-days because of its distinct advantages such as low cost due to ease of construction, low floor-to-floor height because of shallow beams known as “fat” beams, and flexible use of space due to large span., Since the PT flat floor systems provide improved crack and deflection control, and allow relatively large span-to-thickness ratios of the order of 35 to 45 and also very efficient in particular PT flat floor systems. Mostly gravity loads are resist only PT floor systems in high seismic regions however, they may be utilized as intermediate moment frames (ACI 318-2005, Section 21.12.6)2 in areas with moderate seismic demands. Given the broad potential applications, a detailed study, understanding and analysis of flat floor system behaviour subjected to lateral forces and/or displacements is important.
In the present work, a series of nonlinear pushover analysis is carried out by using SAP2000 software which allows the modelling of PT tendons. If the analysis is carried out by the following guidelines are given in ATC-403 and FEMA-273/2744, where several important factors such as P-Delta effects, strength and stiffness contribution, and soil parameters are taken into consideration.
2. BUILDING DESCRIPTIONS
2.1 DIMENSIONS OF BUILDING AND MEMBERS
[image:1.612.366.522.591.703.2]The present study compares the seismic performance of a typical RC framed structure of an overall plan dimension of 24m x 24m having panel size of 8m x 8m with the following three variations in its frame modelling.
© 2018, IRJET | Impact Factor value: 6.171 | ISO 9001:2008 Certified Journal | Page 3053
(i). Conventional RC frame with all beams as RCC.
From trial and error method using ETABS software, arrived the dimension as 300mmx600mm.
(ii). Peripheral beams as RCC and interior beams as post tensioned.
From trial and error method using ETABS software, arrived the dimension as 300mmx600mm.
(iii). All beams having post tensioned
From trial and error method using ETABS software, arrived the dimension as 1200mmx600mm.
(iv) Column
For all the three models:
(i) 1000mm*1000mm (up to G+3 floors). (ii) 800mm*800mm (up to G+7 floors). (iii) 600mm*600mm (above G+7 floors).
(v) Slab
In all the fifteen models, slab is modeled as a shell element accounting for diaphragm action to be considered for seismic analysis. The columns are considered to be fixed at the foundation level. In case of PT beams the tendons are modeled as per the selected profile and a post tension stresses to account for 25% to 35% of the dead load is considered for analysis. The column height is considered as 3m for each floor. Static Nonlinear Pushover analysis is carried out for all the fifteen models generated using SAP2000 software.
TYPICAL MODEL
Fig 2 - G+11 All beams as post tensioned
2.2 LOAD DEFINITION
Each of the models is subjected to a floor load of 2kN/m2 as dead load and 3kN/m2 as live load on all the typical floors. All beams are subjected to a uniform distributed 230mm thick wall load of 15 kN/m. being a symmetric structure plan, seismic load in only one lateral direction is considered as per IS 1893.
2.3 POST TENSION DESIGN PARAMETERS
[image:2.612.318.584.255.369.2]All Post tensioned members are designed by ADAPT software.
Table 1- Post tension design parameters
[image:2.612.321.572.422.531.2]2.4 TYPICAL TENDON PROFIL
Fig 3 - Tendon profile
3.1 PUSH OVER ANALYSIS
The Combined Axial and Flexural (PMM) type of hinges are defined at 0.05L and 0.95L for all the column elements and Flexural (M3) hinges are defined at 0.05L, 0.5L and 0.95L for all beam elements where L is the length of the beam element. The 0.5L flexural hinge in beams is typically defined to capture the effects due to maximum sagging moment developed at mid span of beams during the push in the gravity direction.
[image:2.612.92.226.520.704.2]© 2018, IRJET | Impact Factor value: 6.171 | ISO 9001:2008 Certified Journal | Page 3054 the case in which the gravity loads are applied up to their
total force magnitude. It may be noted here that the jacking force applied at the ends of the PT cables as per Table 1 is already in effect simultaneously. PUSH2 is defined as the push in the lateral X-direction, and it starts from the end of PUSH1. The X-displacement of the roof level node is monitored up to the magnitude of 4 percent of the building height, when push is given as per the earthquake force profile in the X direction. Once the displacement is noted down at performance point, which is much less than 4 percent of the height of the building for all cases,one more cycle of push over analysis is carried out by modifying the target displacement of roof level node to the displacement obtained at performance point. This is typically done to get the relevant data like number and state of hinges at the performance point as one stops pushing the structure beyond performance point in the second cycle of push over analysis.
3.2 PERFOMANCE BASED DESIGN
There are generally three performance levels:
1. Immediate occupancy level in which relatively little damage of the structure occurs
2. Collapse prevention level, in which near complete damage of the structure occurs.
[image:3.612.319.570.425.668.2]3. Life safety level is defined as a condition of severe damage, but a state in which margin remains against collapse.
Fig 1- Capacity curve
3.3 THE HINGES
Types of hinges are flexural hinges, shear hinges and axial hinges. The first two is inserted into the ends of beams and columns. Since the presence of masonry infill have significant influence on the seismic behavior of the
structure, modelling them using equivalent diagonal struts is common in PA, unlike in the conventional analysis, where its inclusion is a rarity. The axial hinges are inserted at either ends of the diagonal struts thus modelled, to simulate cracking of infill during analysis.
Basically a hinge represents localized force-displacement relation of a member through its elastic and inelastic phases under seismic loads. For example, a flexural hinge represents the moment-rotation relation of a beam. The linear elastic range from unloaded state A to its effective yield B represented by AB followed by an inelastic but linear response of reduced (ductile) stiffness from B to C. a sudden reduction in CD shows of load resistance, followed by a reduced resistance from D to E, and finally a total loss of resistance from E to F. Hinges have defined as „Immediate Occupancy‟ (IO), „Life Safety‟ (LS) and „Collapse Prevention‟ (CP) within its ductile range.
4. RESULT AND DISCUSSIONS
4.1 GENERAL
The results which are required based upon the requirements are to be determined using both SAP2000 software.
4.2 RESULTS OBTAINED FROM SAP2000
[image:3.612.54.246.480.591.2]© 2018, IRJET | Impact Factor value: 6.171 | ISO 9001:2008 Certified Journal | Page 3055
[image:4.612.34.574.30.725.2]4.3 TYPICAL RESULTS FOR G+15 FLOOR (ALL BEAMS HAVING CONVENTIONAL RCC)
Fig 4 - Deformed shape with hinges at performance point
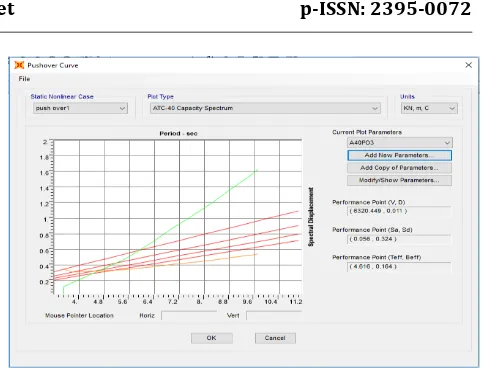
Fig 5 - Pushover curve
[image:4.612.324.566.67.251.2]Fig 6 - Spectral acceleration (Sa) Vs Time (T)
Fig 7 - Spectral displacement (Sd) Vs Time (T)
4.4 NO OF HINGES DEVELOPED AT PERFOMANCE LEVEL
Table 3 - No of hinges developed at performance level
4.5 CHARTS
[image:4.612.89.248.131.302.2]© 2018, IRJET | Impact Factor value: 6.171 | ISO 9001:2008 Certified Journal | Page 3056
Fig 9 - Collapse level of members at different types of building
CONCLUSION
From the above results obtained from the seismic performance of RC framed structures having conventional RC beams on the periphery of the building and PT beams in the interior grids of the structure is the best for G+11 to G+15 storey structures. The stress value in the plastic hinges in case of frames with peripheral RC beams and internal PT beams is observed to be not exceeded the collapse stage for all defined hinges in G+11 to G+14 storey building frames and after G+14 the collapse level is increased. If further indicate that the seismic performance for an RC framed structure with all the beams considered as PT beams is also within acceptable level. In spite of the fact that the depth of PT beams is considered to be shallow the seismic performance of frames with all the beams as PT beams is also well within acceptable level for G+11 to G+15 structures.
REFERENCES
[1]. Applied teleology council, ATC-40. Seismic evaluation and retrofit of concrete buildings, vols. 1 and 2, California, 1996.
[2]. CSI, SAP2000, integrated finite element analysis and design of structures basic analysis reference manual. Berkeley (ca, usa): computers and structures mc, 2006.
[3]. Mwafy and. Elnashai(2001), -static pushover versus dynamic collapse analysis of RC buildings “engineering structures magazine, 2001, pp. No. 407- 424.
[4]. FEMA273 (1997),"guidelines for the seismic rehabilitation of buildings “building seismic safety council, Washington, D.C., October 1997
[5]. IS1893:2002,"criteria for earthquake resistant design of structures", bureau of Indian standards, New Delhi.
[6]. IS13935:1993,"repair and seismic strengthening of buildings", bureau of Indian standards, New Delhi.
[7]. Anil k. Chopra,"dynamics of structures “Pearson prentice hall, 2005.
[8]. Ashraf habibullah and stephen pyle(1998),"practical three-dimensional nonlinear static pushover analysis “structure magazine, winter, 1998.
[9]. Virote boonyapinyo1, nuttawut intaboot2, pennung warnitchai3 and nguyen hong tam4,” seismic capacity evaluation of post-tensioned concrete slab-column frame buildings by pushover analysis”, august 1-6, 2004, paper no. 827.
[10]. B. A. Shah* d. A. Mistry* and s. C. Patodi, “seismic evaluation of buildings with post-tensioned floors by pushover analysis”, vol. 38, no. 5, December 2011-january 2012.
[11]. Alidad hashemi and khalid m.mosalam university of California, Berkeley, “seismic evaluation of reinforced concrete buildings including effects of masonry infill walls”, peer 2007/100 , July 2007. 31 [12]. Amalu paul1, yedu krishnan, “lateral load analysis of post tensioned and RCC building using pushover analysis”, volume: 03 issue: 09 | sep-2016.
[13]. ADAPT -structural engineering consultants -structural calculations for post-tensioned beam and one-way slab construction.
[14]. CSI – ETABS – integrated analysis, design and drafting for building system.
[15]. B. K. Raghu Prasad, A. Seetha Ramaiah and A. K. Singh, “capacity spectrum for structures asymmetric in plan”, August 1-6, 2004, Paper No. 2653.
[16]. Nilesh M. Kashid, pune , Maharashtra, India, “performance based seismic analysis for buildings in India”.