Ewing sarcoma cells and thereby contributes to
oncogenesis
Anna Rocchi, … , Piero Picci, Katia Scotlandi
J Clin Invest. 2010;120(3):668-680. https://doi.org/10.1172/JCI36667.
Ewing sarcoma (EWS) is an aggressive bone tumor of uncertain cellular origin. CD99 is a
membrane protein that is expressed in most cases of EWS, although its function in the
disease is unknown. Here we have shown that endogenous CD99 expression modulates
EWS tumor differentiation and malignancy. We determined that knocking down CD99
expression in human EWS cell lines reduced their ability to form tumors and bone
metastases when xenografted into immunodeficient mice and diminished their tumorigenic
characteristics in vitro. Further, reduction of CD99 expression resulted in neurite outgrowth
and increased expression of b-III tubulin and markers of neural differentiation. Analysis of a
panel of human EWS cells revealed an inverse correlation between CD99 and
H-neurofilament expression, as well as an inverse correlation between neural differentiation
and oncogenic transformation. As knockdown of CD99 also led to an increase in
phosphorylation of ERK1/2, we suggest that the CD99-mediated prevention of neural
differentiation of EWS occurs through MAPK pathway modulation. Together, these data
indicate a new role for CD99 in preventing neural differentiation of EWS cells and suggest
that blockade of CD99 or its downstream molecular pathway may be a new therapeutic
approach for EWS.
Research Article
Oncology
Find the latest version:
CD99 inhibits neural differentiation
of human Ewing sarcoma cells and thereby
contributes to oncogenesis
Anna Rocchi,1 Maria Cristina Manara,1 Marika Sciandra,1 Diana Zambelli,1 Filippo Nardi,1 Giordano Nicoletti,1 Cecilia Garofalo,1 Stefania Meschini,2 Annalisa Astolfi,3 Mario P. Colombo,4
Stephen L. Lessnick,5 Piero Picci,1 and Katia Scotlandi1
1Laboratory of Experimental Oncology, CRS Development of Biomolecular Therapies, SSN Emilia Romagna Istituti Ortopedici Rizzoli IRCCS, Bologna, Italy. 2Department of Technology and Health, Italian National Institute of Health, Rome, Italy. 3Centro Interdipartimentale di Ricerche sul Cancro “G. Prodi,”
Università di Bologna, Italy. 4Molecular Immunology Division, Department of Experimental Oncology, Fondazione IRCCS Istituto Nazionale Tumori, Milan, Italy. 5Center for Children’s Cancer Resarch, Huntsman Cancer Institute, and Division of Pediatric Hematology/Oncology, University of Utah, Salt Lake City.
Ewing sarcoma (EWS) is an aggressive bone tumor of uncertain cellular origin. CD99 is a membrane protein
that is expressed in most cases of EWS, although its function in the disease is unknown. Here we have shown
that endogenous CD99 expression modulates EWS tumor differentiation and malignancy. We determined
that knocking down CD99 expression in human EWS cell lines reduced their ability to form tumors and bone
metastases when xenografted into immunodeficient mice and diminished their tumorigenic characteristics in
vitro. Further, reduction of CD99 expression resulted in neurite outgrowth and increased expression of
β
-III
tubulin and markers of neural differentiation. Analysis of a panel of human EWS cells revealed an inverse
correlation between CD99 and H-neurofilament expression, as well as an inverse correlation between neural
differentiation and oncogenic transformation. As knockdown of CD99 also led to an increase in
phosphory-lation of ERK1/2, we suggest that the CD99-mediated prevention of neural differentiation of EWS occurs
through MAPK pathway modulation. Together, these data indicate a new role for CD99 in preventing neural
differentiation of EWS cells and suggest that blockade of CD99 or its downstream molecular pathway may be
a new therapeutic approach for EWS.
Introduction
Ewing sarcoma (EWS) is the second most common bone tumor of children and young adults (1). These tumors are very aggressive and require either surgery and/or radiation therapy for control of the primary tumor site, along with intensive chemotherapy to treat micrometastatic deposits. These treatments are associated with significant short- and long-term side effects. New therapeutic approaches are likely to come from an improved understanding of the molecular basis of this tumor.
EWSs have a “small round blue cell tumor” histologic phenotype that is characterized by predominantly undifferentiated sheets of cells with relatively little stroma (1). This lack of differentiation has led to difficulty in understanding the tumor cell of origin. In some cases, however, EWSs have evidence of limited neural differ-entiation, including Homer-Wright rosettes, neural processes, neu-rosecretory granules, and neural immunohistochemical markers (2–6). This phenotype has suggested that EWSs may arise from the neural crest. Recently, a number of investigators have suggested that the tumor has a mesenchymal stem cell origin (7–11).
EWS is characterized by the presence of recurrent chromosomal translocations that fuse the EWSR1 gene (encoding the EWS pro-tein) on chromosome 22 with various ETS genes (12). The most common fusion, EWS/FLI, is present in 85% of cases, with other fusions accounting for the remaining cases (13). In each case, the DNA-binding domain of the ETS factor and a transcriptional activation domain contributed by EWS are retained, supporting
experimental data suggesting that EWS/FLI functions as an aber-rant transcription factor (14, 15).
The effects of EWS/FLI expression are strongly dependent on cellular background (reviewed in ref. 16). For example, EWS/FLI transforms immortalized murine NIH3T3 fibroblasts and is required for the oncogenic phenotype of patient-derived EWS cells (14, 17). Conversely, introduction of EWS/FLI into primary human or murine fibroblasts leads to growth arrest or cell death, respec-tively (18, 19). In other contexts, EWS/FLI expression induces transdifferentiation and thus induces cells to exhibit a neural phe-notype (20–22). These data suggest that oncogenic transforma-tion by EWS/FLI requires a permissive cellular background. The critical factors in the permissive background are largely unknown but may include disruption of the p53 and RB pathways and the presence of an intact IGF pathway (18, 19, 23). Furthermore, these studies suggest that EWS/FLI itself may induce the neural pheno-type of EWS, rather than the phenopheno-type resulting from the cell of origin of the tumor.
While assays for EWS/FLI expression are becoming widely used as a molecular diagnostic approach for EWS, the most commonly used diagnostic marker is CD99 (1). CD99 (also known as MIC2, and recognized by antibodies 12E7, HBA71, and O13) is a 32-kDa integral membrane glycoprotein that is highly expressed in most cases of EWS (24). CD99 has a key role in several biological pro-cesses, including cell adhesion, migration, and apoptosis; differ-entiation of T cells and thymocytes; diapedesis of lymphocytes to inflamed vascular endothelium; maintenance of cellular morphol-ogy; and regulation of intracellular membrane protein trafficking (25–30). While the expression of CD99 is high in EWS, and in some
Conflict of interest: The authors have declared that no conflict of interest exists.
cases of rhabdomyosarcoma, mesenchymal chondrosarcoma, and T-lineage leukemias and lymphomas, in other tumors, such as osteosarcoma and Hodgkin lymphoma, CD99 is expressed at low levels and may function as a tumor suppressor (24, 31–38).
In EWS, engagement of CD99 with antibodies results in apopto-sis and enhances sensitivity to chemotherapeutic agents (39, 40). However, the normal function of CD99 in EWS is unknown. In this study, we found that CD99 is required for EWS transforma-tion. Reduction of CD99 expression in patient-derived EWS cells abrogated oncogenic transformation and induced cells toward a neural differentiation phenotype. Interestingly, we found that CD99 is normally expressed on the surface of human mesenchymal stem cells, which have been recently suggested to be the EWS cell of origin, indicating that CD99 is a key component of the cellular context that allows ongoing EWS/FLI expression without growth arrest or cell death. Furthermore, gene expression profiling studies identified a CD99 signature that contributed to previously report-ed EWS/FLI signatures and supportreport-ed the hypothesis that CD99 affects differentiation and malignancy of EWS cells. These data define a new role for CD99 as an inhibitor of neuronal differentia-tion and suggest that blockade of basal CD99 funcdifferentia-tion may be a new therapeutic approach for EWS.
Results
CD99 contributes to cell proliferation, migration, and metastasis of EWS cells and inhibits their neural differentiation. To define the role of CD99
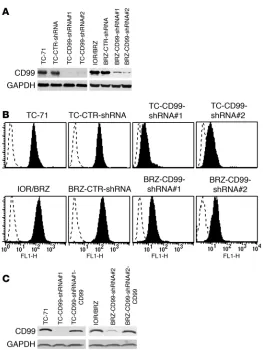
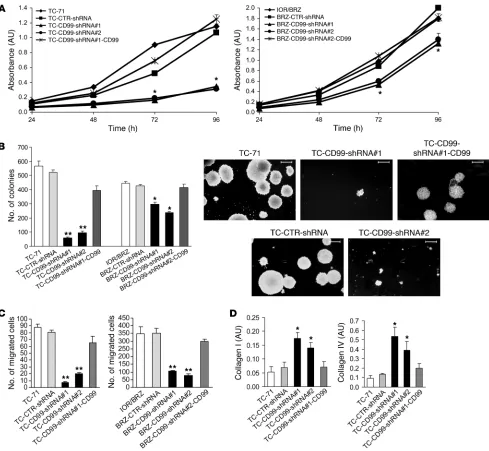
expression in EWS, we took a loss-of-function approach. Plasmids expressing either an shRNA targeting the 3ʹ untrans-lated region (UTR) of CD99 (called CD99-shRNA) or a scram-bled shRNA control (CTR-shRNA) were used to generate stable transfectants of TC-71 and IOR/BRZ patient-derived EWS cell lines. Efficient knockdown of CD99 was confirmed at the RNA level (data not shown) and at the protein level using Western blot analysis and flow cytometry (Figure 1, A and B). In addition, to verify that the biological effects were dependent on diminished CD99 expression, and to exclude off-target or other nonspecific effects, we performed “knock-down/rescue” experiments. TC-71 and IOR/BRZ cells express-ing the CD99-shRNA construct were transfected with a CD99 cDNA that did not contain the endogenous 3ʹ UTR and was thus resistant to the RNAi effect (Figure 1C). We found that cells with reduced expression of CD99 showed a concomitant reduction in both monolayer and anchorage-independent growth (Figure 2, A and B) and reduced cell motility (Fig-ure 2C). Additionally, these cells demonstrated an increase in adhesion to extracellular matrix components, including collagen I and IV (Figure 2D). The magnitude of the effects correlated with the level of CD99, with TC-71 exhibiting the strongest effects and IOR/BRZ showing a more modest effect. The reexpression of CD99 in silenced clones (Figure 1C) com-pletely rescued growth and migratory capacities to the same level as in the parental cell lines (Figure 2, A–C). Nearly identical results were obtained using 3 additional siRNA constructs in a transient transfection assay, in which EWS cells demonstrated reduced cell motility and increased cell adhesion to collagen I and IV (Supple-mental Figure 1; supple(Supple-mental material available online with this article; doi:10.1172/JCI36667DS1). These effects were not simply due to global changes in cellular membrane protein content, as the expression levels of integrins β1 and αVβ3 and several growth
factor receptors were unchanged in response to CD99 knockdown (data not shown).
To determine the effects of CD99 knockdown in vivo, we per-formed mouse xenograft experiments (Table 1). Reduction of CD99 expression in either TC-71 or IOR/BRZ EWS cells with the CD99-shRNA construct resulted in a reduction in local tumor growth, as measured by an increased time to tumor development and a reduction in tumor size. Furthermore, the development of bone metastasis was also significantly reduced. Both tumorigenic-ity and metastasis abiltumorigenic-ity of EWS cells were regained when CD99 was reexpressed. Taken together, these data demonstrate that ongoing CD99 expression is required for the oncogenic phenotype of EWS cells in vitro and in vivo.
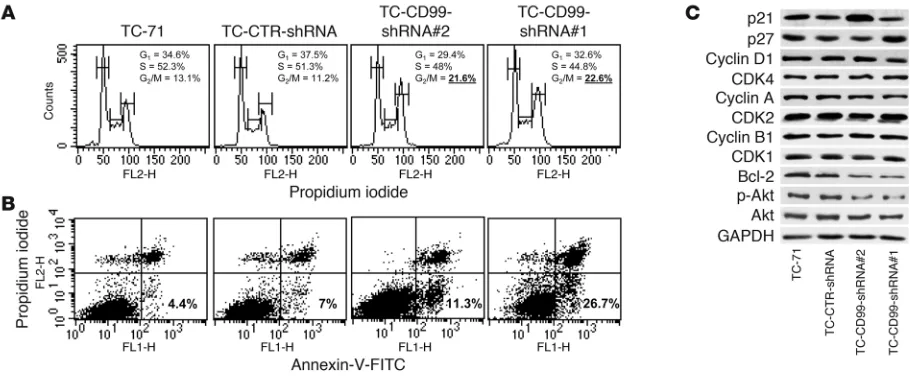
The cell growth inhibition induced by CD99 knockdown was due to a block at the G2/M phase of cell cycle (Figure 3A) and increased
[image:3.585.41.304.77.427.2]apoptosis (Figure 3B). In fact, the analysis of some cell cycle regu-lators and apoptosis mediators indicated an upregulation of p21
Figure 1
Silencing of CD99 by shRNA plasmid. (A) Stable transfection of
TC-71 and IOR/BRZ cells with CD99-shRNA plasmid results in a substantial reduction in CD99 protein levels as determined by Western blotting. GAPDH is shown as loading control. (B) CD99
expression in derived TC-71 and IOR/BRZ clones by cytofluorom-etry. (C) Reexpression of CD99 in knockdown/rescue cells
or p27, two molecular effectors that participate in the G1 and G2
checkpoints causing cell arrest (41), as well as a downregulation of the antiapoptotic protein Bcl-2 in cells deprived of CD99 (Figure 3C). No differences were observed with respect to expression of cyclins and cyclin-dependent kinases (CDKs). However, this was
[image:4.585.48.537.80.531.2]expected, since most of these genes are downstream targets of EWS/FLI, which is present on the CD99-knockdown cells (data not shown). Upregulation of p21 or p27 is reported to be sufficient to compensate cyclin D1 activity, thus allowing cell arrest (42). Increased expression of p21 is independent of p53 activity in these
Figure 2
In vitro growth features of EWS cells silenced for CD99. (A) CD99-silenced cells showed reduced growth in monolayer conditions compared
with controls. Reexpression of CD99 rescued the growth inhibition caused by CD99 knockdown in TC-71 and IOR/BRZ cells. Data are pre-sented as mean ± SEM of experiments performed in triplicate. Absorbance was measured at a wavelength of 550 nm. *P < 0.05, Student’s t test with respect to parental and CD99-reexpressing cells. (B) CD99-silenced cells showed reduced growth in anchorage-independent conditions.
Reexpression of CD99 rescued the growth inhibition. Data are presented as mean ± SEM of experiments performed in triplicate. *P < 0.05, **P < 0.001, Student’s t test versus parental and CD99-reexpressing cells. Representative photomicrographs are shown for TC-71–derived cells. Digital images were taken under identical conditions at the same time. Scale bars: 600 μm. (C) Migratory ability of CD99-silenced cells was
significantly reduced compared with that of controls. Reexpression of CD99 rescued the migration deficit caused by CD99 knockdown in TC-71 and IOR/BRZ cells. Data are presented as mean ± SEM of experiments performed in triplicate and indicate the number of cells that migrated 12 hours after cell seeding. **P < 0.001, Student’s t test versus parental and CD99-reexpressing cells. (D) Cell adhesion tests to extracellular
cells, since both the 2 parental cell lines (TC-71 and IOR/BRZ) have truncated and inactive forms of p53 (data not shown). In addition, the increased expression of p21 and p27 in CD99-deprived cells was observed despite the presence of EWS/FLI, which was reported to attenuate p21 and/or p27 expression levels (41, 43, 44), and may be due to inhibition of PI3K/Akt pathway (Figure 3C), which is known to negatively regulate these 2 cell cycle inhibitors (45).
Not only are both p21 and p27 necessary to restrain cell cycle progression, but they may also exert positive or negative effects on apoptosis, cell movement, and differentiation (41) through a complex and still not entirely understood network of molecu-lar mechanisms. Here we found that introduction of the CD99-shRNA construct induced a phenotype consistent with neural differentiation. Reduction of CD99 expression resulted in neurite outgrowth and increased expression of β-III tubulin and H-neuro-filament (H-NF), a late and very specific marker of neuronal
differ-entiation (7–11, 46) (Figure 4, A and B). Neurofilaments are composed of 3 groups of microheterogeneous sub-units with molecular mass-es of 65 kDa (L-NF), 160 kDa (M-NF), and 200 kDa (H-NF). L-NF and M-NF are expressed at early stages of neuronal development, while H-NF is expressed later in the terminal phase. Exposure of cells to nerve growth factor (NGF; 20 ng/ml) or low-serum medi-um (1% Iscove’s modified Dulbecco’s medium [IMDM]) for 72 hours induced high expres-sion of H-NF in cells with reduced expresexpres-sion of CD99 but not in parental cells (Figure 4C), further sustaining the association between CD99 expression and neural differentiation. Quantita-tive analysis of neurite outgrowth showed modulation of neu-ritis number according to the expression of CD99. A significant increase in cells with long cytoplasmic extensions was observed in cells silenced for CD99 (40 of 282, 14% in TC-71 vs. 123 of 290, 42% in TC-CD99-shRNA#1; P < 0.001, χ2 test). Reexpression of
[image:5.585.65.520.451.642.2]CD99 reversed the morphologic changes (number of neurites: 50 of 294, 17% in TC-CD99-shRNA#1-CD99 cells) and expression of H-NF or β-III tubulin back to baseline, again demonstrating that this was not due to off-target or other nonspecific effects (Figure 4A). A similar trend was observed for IOR/BRZ cells: the percent-age of cells that stained for H-NF increased from 32% in control to 90% in BRZ-CD99-shRNA#1 cells. Transient downregulation of
Table 1
Tumorigenicity and metastasis of CD99-silenced cells
Cells Tumorigenicity Bone metastasis
Incidence Latency (d) Mean volume Incidence Latency (d) Total
TC-71 5/5 (100%) 16 ± 2 2.09 ± 0.6 4/8 (50%) 50 ± 0 7 TC-CTR-shRNA 4/5 (80%) 28 ± 4 1.87 ± 0.8 3/10 (30%) 75 ± 4 3 TC-CD99-shRNA#1 2/5 (40%) 45 ± 14 0.04 ± 0.02A 0/9 (0%) – –
TC-CD99-shRNA#2 nd – – 0/10 (0%) – –
TC-CD99-shRNA#1-CD99 5/5 (100%) 15 ± 2 3.23 ± 1.52 3/8 (38%) 60 ± 5 3 BRZ-CTR-shRNA 4/5 (80%) 19 ± 3 3.17 ± 0.9 4/8 (50%) 59 ± 9 5 BTZ-CD99-shRNA#2 4/5 (80%) 31 ± 6 0.37 ± 0.2A 1/6 (16%) 43 1
AP < 0.01, Student’s t test, compared with controls. Volume was measured when the first control mice were sacrificed due
to maximum tumor volume achievement. Latency and volume values are shown as mean ± SEM. nd, not determined.
Figure 3
CD99 influences cell proliferation and apoptosis of EWS cells. (A) Cell cycle analysis of TC-71–derived cells. Cells were stained with propidium
iodide (a DNA stain) and DNA content analyzed by ModFit LT software. Data are from an experiment representative of 2 independent experi-ments. Percentages of cells in G2/M phase were significantly different in CD99-silenced cells compared with controls; P < 0.05, Student’s t test.
(B) Detection of annexin V–FITC–labeled apoptotic cells by flow cytometric analysis in TC-71–derived cells. The simultaneous application of
propidium iodide as a DNA stain allows the discrimination of necrotic cells (upper right) from the apoptotic cells positively stained for annexin V (lower right). Data are from an experiment representative of 2 independent experiments. Percentages of apoptotic cells (annexin V–positive and propidium iodide–negative) were significantly different in CD99-silenced cells compared with controls; P < 0.05, Student’s t test. (C) Western blot
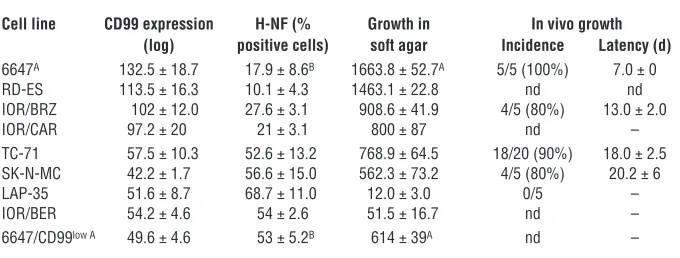
p21 in TC-CD99-shRNA#2 cells was associated with a decrease in H-NF expression (Figure 4B), thus indicating in p21 one possible functional connector between CD99-induced cell cycle inhibition and neural differentiation. Indeed, in specific cellular systems, p21 has been reported to have a role in the process of commitment to terminal differentiation (47). To assess the relationship among CD99 expression, transformation, and neural differentiation more broadly in EWS, we analyzed a panel of patient-derived EWS cells for CD99 and H-NF expression (Table 2). We found an inverse cor-relation between CD99 and H-NF expression (Pearson corcor-relation test, r = –0.93; P = 0.0003) and a positive association between CD99 and oncogenic transformation (Pearson correlation test, r = 0.85;
P = 0.005 with respect to soft agar). There was also an inverse corre-lation between neural differentiation (as measured by H-NF expres-sion) and oncogenic transformation in vitro and in vivo (Pearson correlation test, r = –0.82; P = 0.04,
with respect to soft agar growth). A further confirmation comes from the EWS cell line 6647. By continuous exposure of 6647 cells to the anti-CD99 mAb 0662 (40), we obtained a cell variant with stable downregulation of CD99 (Table 2). This cell variant, here named 6647/CD99low, displayed
significantly increased expres-sion of H-NF (P = 0.03, Student’s
t test) and reduced soft agar growth (P = 0.001, Student’s t test). These data suggest that CD99 contrib-utes to oncogenic transformation by preventing terminal neural dif-ferentiation of EWS cells.
To determine whether these results were specific to EWS cells
or were more generalized, we analyzed the relationship between CD99 and neural differentiation in human mesenchymal stem cells (MSCs). MSCs have recently been proposed to be the cell of origin of EWS (7–11). We first confirmed that our preparation of human bone marrow–derived MSCs expressed cell surface mark-ers that have been previously reported for this cell type, including CD166, CD105, and CD29 (48–50) (Supplemental Figure 2A). As expected, these cells did not express the hematopoietic markers CD45 and CD34. We found that MSCs expressed CD99 at levels comparable to those found on patient-derived 6647 EWS cells. Seven additional independent preparations of MSCs demonstrated moderate to high levels of CD99 expression (data not shown). These data suggest that the putative EWS cell of origin has an appropriate cellular background to tolerate EWS/FLI expression without undergoing terminal differentiation.
We next assessed the levels of CD99 under differentiating condi-tions. MSCs can be induced to differentiate toward various lin-eages, including osteocytes, chondrocytes, and adipocytes (49, 50). MSCs can also be induced to differentiate toward a neural phe-notype under specific conditions (51, 52). We found that under osteoblastic differentiating conditions, MSCs retained basal lev-els of CD99 protein expression (Supplemental Figure 2B). How-ever, CD99 expression was significantly reduced when MSCs were induced to undergo neural differentiation (Figure 4E). These data suggest that neural differentiation cannot proceed without down-regulation of CD99 levels.
We also confirmed a functional role for CD99 in a recently described murine model of EWS (53, 54). Because there is no well-defined CD99 allele in the mouse genome (54), this system allows for an analysis of CD99 activity in the absence of endogenous CD99 expression. The C3H10T1/2 murine mesenchymal multipo-tent cell line loses its ability to differentiate down osteoblastic and adipocytic lineages following EWS/FLI transfection but instead acquires a neural phenotype and tumorigenic properties (53).
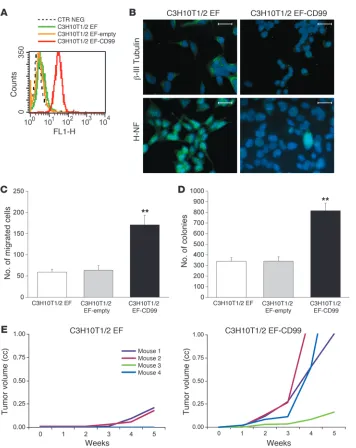
Introduction of the CD99 cDNA into this model system (Fig-ure 5A) repressed feat(Fig-ures of neural differentiation, as shown by reduced expression of β-III tubulin and H-NF (Figure 5B). Fur-thermore, CD99 expression increased both cell motility (Figure 5C) and soft agar colony formation (Figure 5D). In vivo, CD99 expression increased tumor growth. The C3H10T1/2-CD99 cells
Figure 4
CD99 influences neural differentiation in EWS and human MSCs. (A)
H-NF and β-III tubulin expression in CD99-silenced cells that were maintained in standard culture conditions. Neural differentiation was reversed when CD99 was reexpressed in knockdown/rescue cells. Representative photomicrographs are shown for TC-71–derived cells. Scale bars: 120 μm. (B) Western blot analysis of H-NF and β-III tubulin expression in CD99-silenced cells that were maintained in standard culture conditions. Expression of H-NF was observed only in CD99-deprived cells, while β-III tubulin expression was induced. (C)
West-ern blot analysis of H-NF TC-71 and TC-CD99-shRNA#1 cells after exposure to low-serum medium (1% IMDM) or NGF (20 ng/ml) for 72 hours. Again, expression of H-NF was observed only in CD99-silenced cells. (D) Downregulation of p21 in TC-CD99-shRNA#2 by transient
silencing of the molecule, as detected by Western blotting, resulted in inhibition of the neural differentiation, as shown by H-NF expres-sion. Cells were exposed to shRNA against p21 for 24 hours and then evaluated for H-NF expression. Representative photomicrographs are shown for TC-71–derived cells. Scale bars: 120 μm. (E) MSCs were
[image:7.585.191.531.584.713.2]cultured in neural differentiation medium, and terminal differentiation was monitored by H-NF and β-III tubulin staining that visualized neural development. The expression of CD99 is lost during neural develop-ment, as shown by avidin-biotin immunostaining. All digital images were taken under identical conditions, at the same time, and using the same image analysis software (Quips-XL genetic workstation). Scale bars: 600 μm; enlarged sections, 300 μm.
Table 2
Relationship among level of CD99 expression, neural differentiation, and malignancy in a panel of EWS cell lines
Cell line CD99 expression H-NF (% Growth in In vivo growth (log) positive cells) soft agar Incidence Latency (d)
6647A 132.5 ± 18.7 17.9 ± 8.6B 1663.8 ± 52.7A 5/5 (100%) 7.0 ± 0
RD-ES 113.5 ± 16.3 10.1 ± 4.3 1463.1 ± 22.8 nd nd IOR/BRZ 102 ± 12.0 27.6 ± 3.1 908.6 ± 41.9 4/5 (80%) 13.0 ± 2.0 IOR/CAR 97.2 ± 20 21 ± 3.1 800 ± 87 nd – TC-71 57.5 ± 10.3 52.6 ± 13.2 768.9 ± 64.5 18/20 (90%) 18.0 ± 2.5 SK-N-MC 42.2 ± 1.7 56.6 ± 15.0 562.3 ± 73.2 4/5 (80%) 20.2 ± 6 LAP-35 51.6 ± 8.7 68.7 ± 11.0 12.0 ± 3.0 0/5 – IOR/BER 54.2 ± 4.6 54 ± 2.6 51.5 ± 16.7 nd – 6647/CD99low A 49.6 ± 4.6 53 ± 5.2B 614 ± 39A nd –
Values are shown as mean ± SEM. AP = 0.001, Student’s t test, 6647 versus 6647/CD99low. BP = 0.03;
gave rise to tumors in all of the animals, compared with 50% of mice when the parental cells were injected, and the tumor growth rate was significantly increased (Figure 5E). Taken together, these data suggest that CD99 blocks neural differentiation in multiple cell types and contributes to the oncogenic phenotype of EWS.
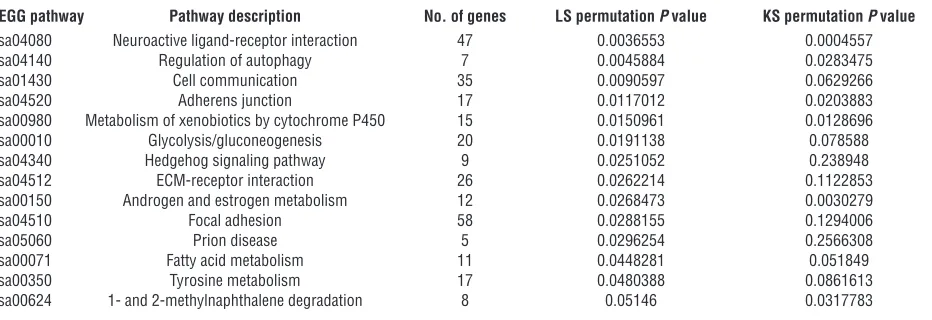
Expression profiling of CD99 in EWS identifies MAPK pathway modula-tion. To determine the molecular basis for CD99 function in EWS, we analyzed the gene expression profile of EWS cells expressing the CD99-shRNA construct and compared it with that of cells express-ing a control construct usexpress-ing Agilent G4110B oligonucleotide microarrays. We identified the pathways differentially expressed in CD99-shRNA cells with respect to control by a functional class scoring analysis (see Supplemental Methods) applied to gene lists selected in a blinded manner on TC-71 and IOR/BRZ cells (Supplemental Table 1). Analysis of the most silenced TC-71 cells confirmed the role of CD99 on differentiation and transforma-tion. Analysis using Kyoto Encyclopedia of Genes and Genomes (KEGG) annotations identified a number of pathways that were
significantly modulated by CD99 (P < 0.05) (Table 3). The most differentially regulated pathway was neuroactive ligand receptor interaction. The hedgehog signaling pathway, which is associated with neuronal differentiation in the central nervous system, was also modulated, as were pathways involved in oncogenic transfor-mation, such as adhesion, metabolism, and signaling. Clustering analysis also indicated that among the 30 most deregulated genes (P < 0.05, log ratio >2 or <0.5), 19 (63%) are expressed in and/or functionally connected with nervous system development (listed in bold in Supplemental Figure 3A; Supplemental Table 2). To gain new insights into functional mechanisms underlying the CD99-mediated phenotype, we considered together the genetic profiles of TC-71 and IOR/BRZ cells (Supplemental Table 3). KEGG and BioCarta pathway analysis revealed that the expression level of genes involved in the MAPK pathway are significantly altered in CD99-silenced cells (Supplemental Figure 3B). This was of interest because the MAPK pathway is known to be involved in neuronal development and differentiation (55–59). Furthermore, while
tran-Figure 5
Analysis of CD99 activity in the absence of endogenous CD99 expression. (A) Induction of CD99 expression in
a murine model of EWS. The murine mesenchymal multipotent C3H10T1/2 cell line was transfected with EWS/FLI1 (C3H10T1/2 EF) (53) and with CD99 (C3H10T1/2 EF-CD99). (B) CD99
expression repressed neural differen-tiation, as shown by β-III tubulin and H-NF immunostaining. Digital images were taken under identical condi-tions, at the same time and using the same image analysis software (Quips-XL genetic workstation). Scale bars: 120 μm. (C) Expression of CD99 in
C3H10T1/2 EF increased cell migration. Data are presented as mean ± SEM of experiments performed in triplicate. **P < 0.001, Student’s t test. (D)
Expres-sion of CD99 in C3H10T1/2 EF increased colony formation in soft agar. Mean val-ues and standard errors obtained for triplicate experiments are indicated. **P < 0.001, Student’s t test. (E) In vivo
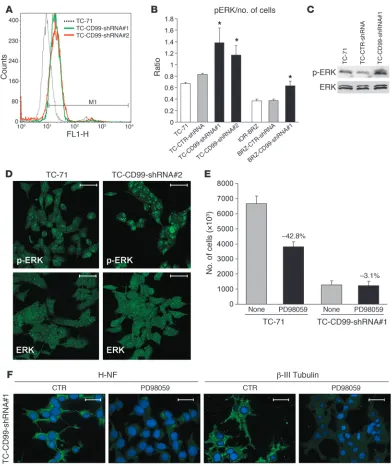
[image:8.585.43.399.77.525.2]sient activation of the MAPK pathway induces cellular proliferation of PC12 cells, prolonged activation promotes neural differentiation of these cells (60). We therefore asked whether the MAPK pathway might be involved in the neural differentiation blockade mediated by CD99. We observed an increase in ERK1/2 activation in CD99-silenced cells by cytofluorometric analysis (Figure 6A), ELISA cell-based tests (Figure 6B), and Western blotting (Figure 6C). Confocal microscopy confirmed that knockdown of CD99 led to an increase in levels of phosphorylated ERK1/2 (Figure 6D), which was par-ticularly evident in the nucleus (Supplemental Figure 3C), whereas total ERK1/2 protein was distributed uniformly throughout the cytoplasm and nucleus. We next used the ERK inhibitor PD98059 to determine the functional consequences of MAPK pathway activ-ity (Supplemental Figure 3D). In parental TC-71 cells, PD98059 treatment resulted in diminished proliferation (Figure 6E), as expected. In TC-71 cells containing the CD99-shRNA construct, however, PD98059 did not prevent the observed growth inhibition but prevented the neural differentiation induced by CD99 knock-down (Figure 6, E and F). Both H-NF and β-III tubulin staining were in fact reversed by 48-hour treatment with PD98059. These effects were reversed when expression of CD99 was regained (data not shown). These data suggest that CD99 prevents neural differ-entiation of EWS via a MAPK-dependent pathway.
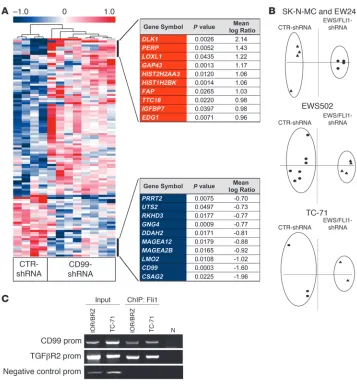
CD99 and EWS/FLI interact in sustaining the EWS phenotype. Both EWS/FLI and CD99 are required for the oncogenic phenotype of EWS. We first considered the epistatic relationship between EWS/ FLI and CD99 using gene expression profiling data. We reasoned that if one protein alters the expression of the other, then there will be significant similarities in their gene expression profiles. We used the CD99 signature that included 106 genes (76 upregulated and 30 downregulated in both TC-71 and IOR/BRZ CD99-silenced cells; Figure 7A and Supplemental Table 3) and compared that with Affymetrix microarray platform gene expression data for EWS/FLI generated by RNAi experiments in SK-N-MC and EW-24 cells (10) and in EWS502 and TC-71 cells (61). Genes were mapped to their UniGene identifiers to allow for comparison across different microarray platforms. The EWS/FLI knockdown datasets were first limited to those genes that represent the CD99 expression
signa-ture and subsequently used to perform Spearman correlation tests (P = 0.02, r = 0.23), principal component analysis (PCA) (Figure 7B), and hierarchical clustering (Supplemental Figure 4A). Using these approaches, we found that the CD99 signature allowed for a clear separation of EWS/FLI knockdown cells from controls, suggesting that the CD99 signature overlaps with the EWS/FLI signature.
Previous studies have suggested that EWS/FLI induces a neural phenotype in a variety of cellular contexts (20–22). Interestingly, in some studies, EWS/FLI also induces CD99 expression (18, 20, 62). While regulation of CD99 by EWS/FLI was not reported in EWS cells that were treated with RNAi against the fusion protein (17, 63), inspection of the raw data from one of these studies (17) demonstrated that knockdown of EWS/FLI resulted in a modest decrease in CD99 expression (data not shown). Here we provide evidence that CD99 is a putative target of EWS/FLI1. A ChIP assay was performed in TC71 and IOR/BRZ EWS cell lines, and we found that EWS/FLI1 was associated to CD99 promoter (Figure 7C). Taken together, these data suggest that CD99 is regulated by EWS/FLI and thus contributes to the oncogenic phenotype medi-ated by the fusion.
Discussion
EWS has served as a paradigm for translocation-associated tumors because it is highly associated with the expression of the EWS/FLI (and other EWS/ETS) translocation oncoproteins. In this regard, it has been thought that understanding the function of EWS/FLI would be the key to understanding the process of oncogenesis for this unusual tumor, which may then provide a new understanding for oncogenic pathways in general. It has become clear in recent years, however, that EWS/FLI is not the whole story in EWS and that studying both downstream and parallel pathways will be required for a full comprehension of oncogenesis in this tumor.
[image:9.585.59.525.114.274.2]Cell surface expression of CD99 is a very consistent feature of EWS (24, 31, 34). Indeed, CD99 is currently considered to be one of the best diagnostic immunohistochemical markers for this dis-ease (1). In this report, we demonstrate that CD99 expression is critical for the oncogenic phenotype of EWS. We provide evidence that modulations in the expression levels of CD99 significantly
Table 3
Significant variations in TC-CD99-shRNA cells compared with controls for KEGG pathways according to the gene set comparison toolA
KEGG pathway Pathway description No. of genes LS permutation P value KS permutation P value
hsa04080 Neuroactive ligand-receptor interaction 47 0.0036553 0.0004557 hsa04140 Regulation of autophagy 7 0.0045884 0.0283475
hsa01430 Cell communication 35 0.0090597 0.0629266
hsa04520 Adherens junction 17 0.0117012 0.0203883
hsa00980 Metabolism of xenobiotics by cytochrome P450 15 0.0150961 0.0128696 hsa00010 Glycolysis/gluconeogenesis 20 0.0191138 0.078588 hsa04340 Hedgehog signaling pathway 9 0.0251052 0.238948 hsa04512 ECM-receptor interaction 26 0.0262214 0.1122853 hsa00150 Androgen and estrogen metabolism 12 0.0268473 0.0030279
hsa04510 Focal adhesion 58 0.0288155 0.1294006
hsa05060 Prion disease 5 0.0296254 0.2566308
hsa00071 Fatty acid metabolism 11 0.0448281 0.051849 hsa00350 Tyrosine metabolism 17 0.0480388 0.0861613 hsa00624 1- and 2-methylnaphthalene degradation 8 0.05146 0.0317783
AThe gene set comparison tool analyzes predefined gene sets (based on Gene Ontology categories, BioCarta pathways, KEGG pathways) for differential
modify cell growth in anchorage-independent conditions and also cell migration, tumorigenesis, and metastasis ability. CD99 participates in the transformed phenotype by serving to prevent terminal differentiation of EWS cells toward a neural phenotype.
This effect is important because EWS/FLI itself appears to drive cells toward a neurally differentiated fate.
The cell of origin of EWS remains uncertain, but emerging evi-dence suggests that it arises from an MSC. For example,
RNAi-Figure 6
Insights into the mechanisms of CD99-silenced cells. (A) Increased expression of activated p-ERK in cells deprived of CD99 as shown by
cytofluorometric analysis. (B) Cell-based ELISA evaluation of activated p-ERK. Once normalized to cell number, the phosphorylation level is
directly related to the extent of activation. Cells deprived of CD99 showed a higher levels of p-ERK. Wavelength, 550 nm. Data are presented as mean ± SEM of experiments performed in triplicate; *P < 0.05 versus controls, Student’s t test. (C) Western blot analysis of ERK and p-ERK
confirmed the higher levels of activation in CD99-silenced cells. (D) Confocal microscopy further confirmed higher expression of the activated
[image:10.585.91.483.79.545.2]mediated silencing of EWS/FLI in EWS cells allows those cells to exhibit a gene expression pattern that is similar to that of MSCs (10). Furthermore, silencing of EWS/FLI allows EWS cells to be differentiated toward adipocytic, chondrocytic, and osteocytic lineages (10). Conversely, introduction of EWS/FLI into murine MSCs blocked their ability to differentiate into osteocytic or adi-pocytic lineages, induced markers of neural differentiation, and resulted in oncogenic transformation (9, 11). Introduction of EWS/FLI into human MSCs induced a gene expression pattern
that was similar to that of EWS cells (including the expression of NKX2.2, a neural marker that is critical for EWS oncogenesis; ref. 17) and caused them to adopt a more invasive phenotype in a Matrigel invasion assay (8).
Introduction of EWS/FLI into other nontransformed cell types results in growth arrest (reviewed in ref. 16). Our observation that human MSCs express CD99 at baseline suggests a mechanism by which MSCs serve as a permissive cellular environment for EWS/FLI expression. We propose that EWS/ FLI induces cells to undergo neural differentiation but that the basal and possibly inducible expression of CD99 prevents terminal differ-entiation. The net result of these balancing effects is a cell that exhib-its some features of the neural phe-notype but maintains its growth capacity. Subsequent activation or repression of other molecular pathways would then be required for these cells to express the full oncogenic phenotype of EWS.
Previous studies showed that CD99 was capable of eliciting modulation of several intracellular pathways, including PI3K/Akt and RAS/MAPK (64, 65) We found that CD99 knockdown inhibited Akt while increasing ERK1/2 phos-phorylation. The effects on PI3K/ Akt may explain the blockade of CD99-silenced cells in G2/M cell
cycle phase and their increased expression of the growth inhibi-tors p21 and/or p27, since this pathway has been shown to be required for G2/M phase
progres-sion and to play a key role in the stabilization of p21 and p27 (45). The lack of p27 degradation can be sufficient to stop RAS-induced proliferation (55). In addition, in normal primary cells, the RAS pathway may contribute to induc-tion of p53-independent p21 upregulainduc-tion (55), thus contribut-ing to cell growth inhibition. In CD99-deprived cells, however, we found that the major role of RAS/MAPK pathway is related to regulation of differentiation. Activation of the RAS/MAPK pathway is well known to be involved in neural differentiation and survival (56–59, 66). This may be related to signal duration, as experiments in PC12 pheochromocytoma cells demonstrated that transient activation of the pathway resulted in cellular pro-liferation, whereas prolonged pathway activation resulted in
neu-Figure 7
Relationship of CD99 expression and EWS/FLI expression. (A) Hierarchical clustering of
CD99-asso-ciated signature based on TC-71 and IOR/BRZ silenced cells. The signature included 106 genes: 76 upregulated and 30 downregulated (Supplemental Table 1; t test, P < 0.05). The top 10 CD99 up- (red) or downmodulated genes (blue) are shown. (B) We applied PCA using the CD99-associated signature
(Supplemental Table 1) on EWS/FLI1-silenced EWS cells derived from SK-M-NC and EW24 (dataset from ref. 10) or from EWS502 and TC-71 cell lines (dataset from ref. 55). CD99 signature allowed for a clear separation of EWS/FLI knockdown cells from controls. Circles indicate EWS/FLI1 silenced cells; triangles indicate controls. (C) Interaction between EWS/FLI1 and CD99 promoter (prom). ChIP was
[image:11.585.42.399.78.462.2]ral differentiation (60). In particular, prolonged nuclear ERK1/2 phosphorylation seems to be crucial for shifting the biological functions of ERK1/2 toward neural development and differen-tiation. It has previously been shown that EWS/FLI activates the RAS/MAPK signaling pathway in immortalized murine fibro-blasts (67). Our findings demonstrate that CD99 inhibits the activation of ERK1/2. This suggests a model according to which EWS/FLI activates, and CD99 represses, the MAPK pathway and together they serve to fine-tune levels of pathway activation that allow for proliferation but prevent terminal neural differentia-tion. We demonstrate that the mechanism behind the block in transformation mediated by CD99 relies on inhibition of RAS signaling. This is surprising, because most tumors are thought to rely on increased RAS activity for their proliferative capacity. However, in some primary vertebrate cells, including neuronal, adipocytic, and myeloid cells, RAS induces differentiation, in some cases accompanied by growth arrest (55). Sustained activa-tion of ERK1/2 accelerated neurite outgrowth and concomitantly increased transcriptional activation of genes involved in the dif-ferentiation process, such as p21 (68), expression of which was also found to be enhanced in our neurally driven EWS cells. Thus, our data suggest that unabated RAS signaling may drive a dif-ferentiated phenotype under certain circumstances also in tumor cells, challenging the classic paradigm according to which RAS is a primary driver of oncogenic transformation (69). The fine defi-nition of these mechanisms is clearly beyond the purposes of this article. However, the fact that CD99 activates pathways that in the normal context favor cell differentiation may be considered a further confirmation of its importance in the reversal of malig-nancy of EWS cells.
One question that remains is whether CD99 is a downstream target of EWS/FLI. CHiP analysis in our hands supported the hypothesis that CD99 is a direct target of EWS/FLI. However, the data remain somewhat contradictory. On one hand, introduced expression of EWS/FLI in some model systems, such as human primary fibroblasts, human MSCs, and human rhabdomyosar-comas, induces CD99 expression (8, 18, 20). On the other hand, CD99 expression levels have not been reported to be changed in experiments in which EWS/FLI was knocked down by RNAi in EWS cells (17, 63). In the latter cases, CD99 expression was not monitored explicitly, but rather was only evaluated via microarray. Inspection of the raw microarray data from one of these studies (17) revealed that CD99 expression was modestly reduced follow-ing EWS/FLI knockdown in 3 of 4 experiments (S.L. Lessnick, unpublished observations). These observations may be reconciled by our finding that human MSCs express CD99 at baseline. If EWS arises from MSCs, then CD99 may already be expressed at or near a maximal level, and EWS/FLI may provide only a minor contribution to its regulation. In other cell types that do not normally express CD99, the contribution of exogenously intro-duced EWS/FLI may be more significant. This may then explain our observations of a modest overlap between the EWS/FLI and CD99 gene expression signatures in EWS. Further work is needed to fully evaluate this hypothesis.
In summary, we have shown that CD99 is required for the EWS oncogenic phenotype. CD99 appears to function by blocking a ter-minally differentiated phenotype that is induced by EWS/FLI, and this process is dependent on changes in MAPK pathway signaling. These data suggest a new therapeutic approach to EWS based on modulating the differentiation of the tumor.
Methods
Isolation and differentiation of bone marrow MSCs. After receipt of informed consent, human primary MSCs were obtained from bone marrow aspi-rates (iliac crest) of 8 patients undergoing hip replacement surgery and phenotyped as bone marrow MSCs by flow cytometry (negative for CD45 and CD34, positive for CD166, CD105, and CD29; dilution specified in Supplemental Methods). MSC cultures were provided by E. Lucarelli (Rizzoli Institute, Bologna, Italy). Osteoblastic and neural differentia-tion of MSCs was obtained following procedures described in refs. 70 and 71, respectively.
Cell lines. EWS cell lines were grown as described previously (40). Murine C3H10T1/2 and C3H10T1/2 cells transfected with EWS/FLI-1 (C3H10T1/2 EF) cell lines were cultured as described (53) and were pro-vided by F. Lecanda (University of Navarra, Pamplona, Spain).
Transfection. For transient silencing of CD99 and CDKN1A, EWS cells were transfected using Lipofectamine (Invitrogen) following the manufacturer’s protocols. siRNA sequences are provided in Supplemental Methods.
For stable silencing, an shRNA plasmid (pSilencer 2.1-U6 Neo vector; Ambion) expressing CD99 siRNA-1 (5ʹ -GATCCGGCTGGCCATTATTA-AGTCTTCAAGAGAGACTTAATAATGGCCAGCCTTTTTGGAAA-3ʹ) was created, and EWS cells were transfected using the calcium phosphate trans-fection method. Stable transfectants expressing shRNA-CD99 (TC-CD99-shRNA#1 and #2 or BRZ-CD99-(TC-CD99-shRNA#1 and #2) or negative controls (TC-CTR-shRNA or BRZ-CTR-shRNA) were obtained after selection in neo-mycin (500 μg/ml) (Sigma-Aldrich). The pcDNA3 CD99 vector, expressing the entire CD99 open reading frame but lacking the 3ʹ UTR, and pcDNA6/ V5-His (Invitrogen), a plasmid that provides blasticidin resistance (5 μg/ml), were cotransfected into TC-CD99-shRNA#1 and BRZ-CD99-shRNA#1 cells using the calcium phosphate transfection method to induce reexpression of CD99. Resistant cellular pools were isolated (TC-CD99-shRNA#1-CD99 and BRZ-CD99-shRNA#1-CD99). C3H10T1/2 EF cells were transfected with the pcDNA3 CD99 vector or with empty vector using the calcium phosphate transfection method. Cellular pools resistant to neomycin (500
μg/ml) were isolated (C3H10T1/2 EF CD99; C3H10T1/2 EF empty).
RNA extraction. Total RNA was extracted by the TRIzol extraction kit (Invitrogen). Quality and quantity of RNA samples were assessed with NanoDrop analysis (NanoDrop Technologies) and/or with an Agilent 2100 Bioanalyzer (Agilent Technologies).
Biochemical and cellular assays. Details about Western blotting, cell-based ELISA, monolayer growth assay, motility assay, soft agar assay, ECM adhe-sion test, cellular morphology study, and apoptosis and cell cycle analysis are provided in Supplemental Methods.
Flow cytometry and immunostaining. Standard protocols were followed. Pro-cedures are described in detail in Supplemental Methods. Cell cycle analy-sis was performed by using ModFit software (Verity Software House).
Treatment with PD98059. Twenty-four hours after cell seeding, medium was replaced by IMDM plus 10% FBS with or without (control) the MEK/ MAPK inhibitor PD98059 (50 μM) (Calbiochem). After 48 hours of treat-ment, cell growth and expression of H-NF were assessed.
Tumorigenicity and metastasis. Female athymic 4- to 5-week-old Crl:CD-1-nu/nu BR mice (Charles River) were used. Tumorigenicity was assessed after s.c. inoculation of 5 × 10⁶ cells. Metastases were determined by
injec-tion of 2 × 10⁶ viable cells in a tail lateral vein. Animals were checked by
X-ray for the presence of bone metastases. Experiments were authorized by the institutional review board of the University of Bologna and performed according to Italian and European guidelines.
description of the microarray analysis is provided as Supplemental Meth-ods. Hierarchical clustering using Pearson correlation and principal com-ponent analyses was performed using MeV TM4 software (http://www. tm4.org). The KEGG pathways were analyzed by using a FatiGOPlus pro-gram (http://fatigo.bioinfo.cnio.es).
BioCarta pathway analysis. Pathway analysis was performed by using Bio-Carta: http://www.biocarta.com/genes/index.asp.
ChIP. ChIP analysis was carried out in TC71 and IOR/BRZ cells as described in Supplemental Methods. The negative control promoter prim-ers used for ChIP were previously described (72, 73).
Statistics. Differences among means were analyzed using 2-tailed Stu-dent’s t test. Fisher’s exact test was used for frequency data. Kaplan-Meier and log-rank methods were used, respectively, to draw and evaluate the significance of survival curves in EWS patients. A P value less than 0.05 was considered significant.
Acknowledgments
We thank G. Bernard and A. Bernard of the Faculté de Médecine de Nice, France, for scientific assistance and discussion; and S.
Beni-ni and C. Ghinelli for their invaluable techBeni-nical help. This work was supported by grants from the Italian Association for Cancer Research (K. Scotlandi), the European Project PROTHETS (no. 503036), Eurobonet (no. 018814), the Terri Anna Perine Sarcoma Fund, the Liddy Shriver Sarcoma Initiative, and Huntsman Cancer Institute/Huntsman Cancer Foundation (S.L. Lessnick), and NIH support to the Huntsman Cancer Institute (P30 CA42014).
Received for publication July 3, 2008, and accepted in revised form December 16, 2009.
Address correspondence to: Katia Scotlandi, CRS Development of Biomolecular Therapies, Laboratory of Experimental Oncology, SSN Emilia Romagna Istituto Ortopedico Rizzoli IRCCS, Bolo-gna 40136, Italy. Phone: 39.051.6366760; Fax: 39.051.6366763; E-mail: [email protected].
Anna Rocchi’s present address is: Italian Institute of Technology, Neuroscience and Brain Technologies Department, Genoa, Italy.
1. Bernstein M, et al. Ewing’s sarcoma family of tumors: current management. Oncologist. 2006;11(5):503–519. 2. Henderson DW, Leppard PJ, Brennan JS, Mukherjee
TM, Swift JG. Primitive neuroepithelial tumours of soft tissues and of bone: further ultrastructural and immunocytochemical clarification of ‘Ewing’s sarcoma’, including freeze-fracture analysis. J Sub-microsc Cytol Pathol. 1989;21(1):35–57.
3. Lipinski M, et al. Neuroectoderm-associated anti-gens on Ewing’s sarcoma cell lines. Cancer Res. 1987; 47(1):183–187.
4. Lizard-Nacol S, Lizard G, Justrabo E, Turc-Carel C. Immunologic characterization of Ewing’s sar-coma using mesenchymal and neural markers. Am J Pathol. 1989;135(5):847–855.
5. Lizard-Nacol S, Volk C, Lizard G, Turc-Carel C. Abnormal expression of neurofilament proteins in Ewing’s sarcoma cell cultures. Tumour Biol. 1992; 13(1–2):36–43.
6. Ladanyl M, Heinemann FS, Huvos AG, Rao PH, Chen QG, Jhanwar SC. Neural differentiation in small round cell tumors of bone and soft tis-sue with the translocation t(11;22)(q24;q12): an immunohistochemical study of 11 cases. Hum Pathol. 1990;21(12):1245–1251.
7. Riggi N, et al. EWS-FLI-1 expression triggers a Ewing’s sarcoma initiation program in primary human mesenchymal stem cells. Cancer Res. 2008; 68(7):2176–2185.
8. Miyagawa Y, et al. Inducible expression of chimeric EWS/ETS proteins confers Ewing’s family tumor-like phenotypes to human mesenchymal progeni-tor cells. Mol Cell Biol. 2008;28(7):2125–2137. 9. Riggi N, et al. Development of Ewing’s sarcoma from
primary bone marrow-derived mesenchymal pro-genitor cells. Cancer Res. 2005;65(24):11459–11468. 10. Tirode F, Laud-Duval K, Prieur A, Delorme B,
Char-bord P, Delattre O. Mesenchymal stem cell features of Ewing tumors. Cancer Cell. 2007;11(5):421–429. 11. Torchia EC, Jaishankar S, Baker SJ. Ewing tumor
fusion proteins block the differentiation of plu-ripotent marrow stromal cells. Cancer Res. 2003; 63(13):3464–3468.
12. Delattre O, et al. Gene fusion with an ETS DNA-bind-ing domain caused by chromosome translocation in human tumours. Nature. 1992;359(6391):162–165. 13. Barr FG, Womer RB. Molecular diagnosis of ewing
family tumors: too many fusions...? J Mol Diagn. 2007; 9(4):437–440.
14. May WA, et al. Ewing sarcoma 11;22 transloca-tion produces a chimeric transcriptransloca-tion factor that requires the DNA-binding domain encoded by FLI1
for transformation. Proc Natl Acad Sci U S A. 1993; 90(12):5752–5756.
15. May WA, et al. The Ewing’s sarcoma EWS/FLI-1 fusion gene encodes a more potent transcriptional activator and is a more powerful transforming gene than FLI-1. Mol Cell Biol. 1993;13(12):7393–7398. 16. Kovar H. Context matters: the hen or egg
prob-lem in Ewing’s sarcoma. Semin Cancer Biol. 2005; 15(3):189–196.
17. Smith R, et al. Expression profiling of EWS/FLI identifies NKX2.2 as a critical target gene in Ewing’s sarcoma. Cancer Cell. 2006;9(5):405–416.
18. Lessnick SL, Dacwag CS, Golub TR. The Ewing’s sarcoma oncoprotein EWS/FLI induces a p53-dependent growth arrest in primary human fibro-blasts. Cancer Cell. 2002;1(4):393–401.
19. Deneen B, Denny CT. Loss of p16 pathways stabi-lizes EWS/FLI1 expression and complements EWS/ FLI1 mediated transformation. Oncogene. 2001; 20(46):6731–6741.
20. Hu-Lieskovan S, Zhang J, Wu L, Shimada H, Scho-field DE, Triche TJ. EWS-FLI1 fusion protein up-regulates critical genes in neural crest development and is responsible for the observed phenotype of Ewing’s family of tumors. Cancer Res. 2005; 65(11):4633–4644.
21. Rorie CJ, Thomas VD, Chen P, Pierce HH, O’Bryan JP, Weissman BE. The Ews/Fli-1 fusion gene switch-es the differentiation program of neuroblastomas to Ewing sarcoma/peripheral primitive neuroecto-dermal tumors. Cancer Res. 2004;64(4):1266–1277. 22. Teitell MA, Thompson AD, Sorensen PH, Shimada
H, Triche TJ, Denny CT. EWS/ETS fusion genes induce epithelial and neuroectodermal differen-tiation in NIH 3T3 fibroblasts. Lab Invest. 1999; 79(12):1535–1543.
23. Toretsky JA, Kalebic T, Blakesley V, LeRoith D, Helman LJ. The insulin-like growth factor-I receptor is required for EWS/FLI-1 transformation of fibro-blasts. J Biol Chem. 1997;272(49):30822–30827. 24. Kovar H, et al. Overexpression of the
pseudoautoso-mal gene MIC2 in Ewing’s sarcoma and peripheral primitive neuroectodermal tumor. Oncogene. 1990; 5(7):1067–1070.
25. Schenkel AR, Mamdouh Z, Chen X, Liebman RM, Muller WA. CD99 plays a major role in the migra-tion of monocytes through endothelial juncmigra-tions.
Nat Immunol. 2002;3(2):143–150.
26. Schenkel AR, Dufour EM, Chew TW, Sorg E, Muller WA. The murine CD99-related molecule CD99-like 2 (CD99L2) is an adhesion molecule involved in the inflammatory response. Cell Commun Adhes. 2007;
14(5):227–237.
27. Cerisano V, et al. Molecular mechanisms of CD99-induced caspase-independent cell death and cell-cell adhesion in Ewing’s sarcoma cell-cells: actin and zyxin as key intracellular mediators. Oncogene. 2004;23(33):5664–5674.
28. Bernard G, Zoccola D, Deckert M, Breittmayer JP, Aussel C, Bernard A. The E2 molecule (CD99) spe-cifically triggers homotypic aggregation of CD4+ CD8+ thymocytes. J Immunol. 1995;154(1):26–32. 29. Bernard G, et al. CD99 (E2) up-regulates
alpha-4beta1-dependent T cell adhesion to inflamed vascular endothelium under flow conditions. Eur J Immunol. 2000;30(10):3061–3065.
30. Bernard G, et al. Apoptosis of immature thy-mocytes mediated by E2/CD99. J Immunol. 1997;158(6):2543–2550.
31. Ambros IM, Ambros PF, Strehl S, Kovar H, Gadner H, Salzer-Kuntschik M. MIC2 is a specific marker for Ewing’s sarcoma and peripheral primitive neu-roectodermal tumors. Evidence for a common histogenesis of Ewing’s sarcoma and peripheral primitive neuroectodermal tumors from MIC2 expression and specific chromosome aberration.
Cancer. 1991;67(7):1886–1893.
32. Brown RE, Boyle JL. Mesenchymal chondrosar-coma: molecular characterization by a proteomic approach, with morphogenic and therapeutic implications. Ann Clin Lab Sci. 2003;33(2):131–141. 33. Dworzak MN, et al. CD99 expression in T-lin-eage ALL: implications for flow cytometric detec-tion of minimal residual disease. Leukemia. 2004; 18(4):703–708.
34. Fellinger EJ, Garin-Chesa P, Triche TJ, Huvos AG, Rettig WJ. Immunohistochemical analysis of Ewing’s sarcoma cell surface antigen p30/32MIC2.
Am J Pathol. 1991;139(2):317–325.
35. Kim SH, et al. Viral latent membrane protein 1 (LMP-1)- induced CD99 down-regulation in B cells leads to the generation of cells with Hodgkin’s and Reed-Sternberg phenotype. Blood. 2000;95(1):294–300. 36. Manara MC, et al. CD99 acts as an oncosuppressor in
osteosarcoma. Mol Biol Cell. 2006;17(4):1910–1921. 37. Ramani P, Rampling D, Link M.
Immunocyto-chemical study of 12E7 in small round-cell tumours of childhood: an assessment of its sensitivity and specificity. Histopathology. 1993;23(6):557–561. 38. Scotlandi K, et al. CD99 isoforms dictate opposite
functions in tumour malignancy and metastases by activating or repressing c-Src kinase activity.
Oncogene. 2007;26(46):6604–6618.
with doxorubicin: an effective combined treatment for Ewing’s sarcoma. Eur J Cancer. 2006;42(1):91–96. 40. Scotlandi K, et al. CD99 engagement: an effective
therapeutic strategy for Ewing tumors. Cancer Res. 2000;60(18):5134–5142.
41. Steinman RA. Cell cycle regulators and hemato-poiesis. Oncogene. 2002;21(21):3403–3413. 42. Matsumoto E, Hatanaka M, Bohgaki M, Maeda S.
PKC pathway and ERK/MAPK pathway are required for induction of cyclin D1 and p21Waf1 during 12-o-tetradecanoylphorbol 13-acetate-induced dif-ferentiation of myeloleukemia cells. Kobe J Med Sci. 2006;52(6):181–194.
43. Matsunobu T, et al. The prognostic and therapeu-tic relevance of p27kip1 in Ewing’s family tumors.
Clin Cancer Res. 2004;10(3):1003–1012.
44. Nakatani F, et al. Identification of p21WAF1/CIP1 as a direct target of EWS-Fli1 oncogenic fusion protein. J Biol Chem. 2003;278(17):15105–15115. 45. Liang J, Slingerland JM. Multiple roles of the PI3K/
PKB (Akt) pathway in cell cycle progression. Cell Cycle. 2003;2(4):339–345.
46. Trojanowski JQ, Walkenstein N, Lee VM. Expres-sion of neurofilament subunits in neurons of the central and peripheral nervous system: an immuno-histochemical study with monoclonal antibodies.
J Neurosci. 1986;6(3):650–660.
47. Casini T, Pelicci PG. A function of p21 during promyelocytic leukemia cell differentiation inde-pendent of CDK inhibition and cell cycle arrest.
Oncogene. 1999;18(21):3235–3243.
48. Chamberlain G, Fox J, Ashton B, Middleton J. Con-cise review: mesenchymal stem cells: their pheno-type, differentiation capacity, immunological fea-tures, and potential for homing. Stem Cells. 2007; 25(11):2739–2749.
49. Pittenger MF, et al. Multilineage potential of adult human mesenchymal stem cells. Science. 1999; 284(5411):143–147.
50. Smith JR, Pochampally R, Perry A, Hsu SC, Prockop DJ. Isolation of a highly clonogenic and multipo-tential subfraction of adult stem cells from bone marrow stroma. Stem Cells. 2004;22(5):823–831.
51. Blondheim NR, et al. Human mesenchymal stem cells express neural genes, suggesting a neural pre-disposition. Stem Cells Dev. 2006;15(2):141–164. 52. Tropel P, et al. Functional neuronal differentiation
of bone marrow-derived mesenchymal stem cells.
Stem Cells. 2006;24(12):2868–2876.
53. Gonzalez I, Vicent S, de Alava E, Lecanda F. EWS/ FLI-1 oncoprotein subtypes impose different require-ments for transformation and metastatic activity in a murine model. J Mol Med. 2007;85(9):1015–1029. 54. Kovar H, Bernard A. CD99-positive “Ewing’s
sarco-ma” from mouse-bone marrow-derived mesenchymal progenitor cells? Cancer Res. 2006;66(19):9786; author reply 9786.
55. Crespo P, Leon J. Ras proteins in the control of the cell cycle and cell differentiation. Cell Mol Life Sci. 2000;57(11):1613–1636.
56. Yang H, Xia Y, Lu SQ, Soong TW, Feng ZW. Basic fibroblast growth factor-induced neuronal dif-ferentiation of mouse bone marrow stromal cells requires FGFR-1, MAPK/ERK, and transcription factor AP-1. J Biol Chem. 2008;283(9):5287–5295. 57. Sweatt JD. Mitogen-activated protein kinases in
synaptic plasticity and memory. Curr Opin Neuro-biol. 2004;14(3):311–317.
58. Subramaniam S, Unsicker K. Extracellular signal-reg-ulated kinase as an inducer of non-apoptotic neuronal death. Neuroscience. 2006;138(4):1055–1065. 59. Grewal SS, York RD, Stork PJ.
Extracellular-signal-regulated kinase signalling in neurons. Curr Opin Neurobiol. 1999;9(5):544–553.
60. Traverse S, Gomez N, Paterson H, Marshall C, Cohen P. Sustained activation of the mitogen-acti-vated protein (MAP) kinase cascade may be required for differentiation of PC12 cells. Comparison of the effects of nerve growth factor and epidermal growth factor. Biochem J. 1992;288(pt 2):351–355. 61. Kinsey M, Smith R, Lessnick SL. NR0B1 is required
for the oncogenic phenotype mediated by EWS/ FLI in Ewing’s sarcoma. Mol Cancer Res. 2006; 4(11):851–859.
62. Suva ML, et al. Identification of cancer stem cells in Ewing’s sarcoma. Cancer Res. 2009;69(5):1776–1781.
63. Prieur A, Tirode F, Cohen P, Delattre O. EWS/FLI-1 silencing and gene profiling of Ewing cells reveal downstream oncogenic pathways and a crucial role for repression of insulin-like growth factor binding protein 3. Mol Cell Biol. 2004;24(16):7275–7283. 64. Hahn MJ, Yoon SS, Sohn HW, Song HG, Park SH,
Kim TJ. Differential activation of MAP kinase fam-ily members triggered by CD99 engagement. FEBS Lett. 2000;470(3):350–354.
65. Byun HJ, et al. A splice variant of CD99 increases motility and MMP-9 expression of human breast cancer cells through the AKT-, ERK-, and JNK-dependent AP-1 activation signaling pathways. J Biol Chem. 2006;281(46):34833–34847.
66. Fukunaga K, Miyamoto E. Role of MAP kinase in neurons. Mol Neurobiol. 1998;16(1):79–95. 67. Silvany RE, Eliazer S, Wolff NC, Ilaria RL Jr.
Inter-ference with the constitutive activation of ERK1 and ERK2 impairs EWS/FLI-1-dependent trans-formation. Oncogene. 2000;19(39):4523–4530. 68. Diolaiti D, et al. Functional cooperation between
TrkA and p75(NTR) accelerates neuronal differen-tiation by increased transcription of GAP-43 and p21(CIP/WAF) genes via ERK1/2 and AP-1 activi-ties. Exp Cell Res. 2007;313(14):2980–2992. 69. Lavaur J, et al. A TAT-DEF-Elk-1 peptide regulates the
cytonuclear trafficking of Elk-1 and controls cytoskel-eton dynamics. J Neurosci. 2007;27(52):14448–14458. 70. Perbal B, et al. Prognostic value of CCN3 in
osteo-sarcoma. Clin Cancer Res. 2008;14(3):701–709. 71. Munoz-Elias G, Woodbury D, Black IB. Marrow
stromal cells, mitosis, and neuronal differentia-tion: stem cell and precursor functions. Stem Cells. 2003;21(4):437–448.
72. Zupanska A, Adach A, Dziembowska M, Kaminska B. Alternative pathway of transcriptional induc-tion of p21WAF1/Cip1 by cyclosporine A in p53-deficient human glioblastoma cells. Cell Signal. 2007;19(6):1268–1278.