Performance Comparison of Managed C# and Delphi
Prism in Visual Studio and Unmanaged Delphi 2009 and
C++ Builder 2009 Languages
Abdulkadir Karaci
Kastamonu University Department of Computer and Instructional Technology Education,
Education Faculty, Turkey
ABSTRACT
M anaged C# and Delphi Prism in Visual Studio 2008 and Unmanaged Delphi 2009 and C++ Builder 2009 programming languages are increasingly gaining in popularity. In this study, response times of these languages, memory consumptions and code lengths were tested with various work loads and the results belonging to these tests were given. Whether there was a significant difference among the data obtained by the test results was tested by using Friedman test and a significant difference was found. Also, the differences between managed languages and unmanaged languages were revealed by the results of the performance test.
Keywords
Performance Test, Programming Language, C#, Delphi, M anaged, Unmanaged.
1. INTRODUCTION
Today most of software developers prefer managed languages because managed languages have the properties of (1) memory and data type security, (2) automatic memory management, (3) dynamic code conduction, (4) determining the boundaries between codes having type security and not having security. Also, most of these languages are object-based [1].
The languages C#, Delphi Prism in Visual Studio 2008, Java are managed languages. The languages C, C++, Delphi 2009, C++ Builder 2009 are unmanaged languages. There is not an automatic memory method in the unmanaged languages and they are not safe.
The NET platform of the M icrosoft has been designed in order to develop Windows applications more easily by ensuring a sound framework [2]. The NET Framework is a complete “application” development platform, which has been developed by the M icrosoft and, which has been established on open Internet protocols and standards. It bears significant resemblances to the Java Platform, which has been developed by the Sun M icrosystems before. The scope of application concept
here is very broad. Everything from a desktop application to a web browser has been considered within this platform and has been supported. It has been made possible that it can establish web services easily for its communication with all the applications in the world and with each other regardless of the setting in which it was developed. This platform has been designed as highly more movable than the operation system and hardware [3].
Programmers and computer scientists have been working on the advantages and disadvantages of various programming languages [4]. For the purpose of contributing to the studies in this field, in this article, the managed C#, Delphi Prism in Visual Studio 2008 and the unmanaged Delphi 2009, C++ Builder 2009 programming languages are compared in terms of their response time, memory consumptions and code lengths. Also, the response times, memory consumptions and code lengths of the managed and unmanaged languages are compared. Thus, whether the managed languages, which are superior in terms of safety, are superior in terms of speed (working time – response time) will be revealed.
2. THE EXPERIMENTAL STUDY
Of the 400 software engineering research articles, which need experimental validation, 40 percent do not include experimental knowledge at all and this rate in other disciplines 15 percent [5]. Therefore, in this article, for the purpose of testing the performances of the programming languages, the experimental programs have been prepared and whether there is a significant difference among the experimental results obtained have been tested with the Friedman test.
2.1. The Test Platform
2.1.1.The Structure of the Programming Languages
Compared
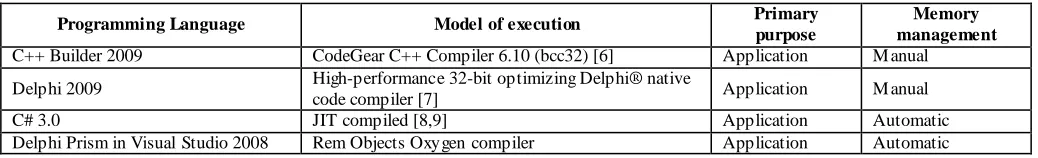
[image:1.612.48.567.642.721.2]The properties belonging to the programming languages, the performances of which are compared are shown in Table 1.
Table 1. The Properties of the Programming Languages Used in the Performance Test
Programming Language Model of execution Primary purpose
Memory management
C++ Builder 2009 CodeGear C++ Compiler 6.10 (bcc32) [6] Application M anual
Delphi 2009 High-performance 32-bit optimizing Delphi® native
code compiler [7] Application M anual
C# 3.0 JIT compiled [8,9] Application Automatic
C# is a powerful component oriented but a simple language of the M icrosoft primarily aiming at application developers and developing applications by using the M icrosoft .Net Framework. C# plays a significant role in the M icrosoft NET Framework engineering. C# bears the most of the best properties of C++ and Visual Basic; however, some of their inconsistencies and working time errors have been eliminated, as a result, a clearer and more logical language has emerged [10,11].
As C#, Delphi Prism is a language working in integration with Visual Studio. Delphi Prism is preferred in order to develop desktop and web applications by using the Visual Studio and Delphi programming language. Prism, which is used in the Visual Studio platform is not 100 % compatible with Delphi. However, there are additions to and developments in the Delphi Prism and Delphi.
The Delphi Prism, Delphi 2009, C++ Builder 2009 are the programming languages produced by Code Gear and contained in RAD studio. With Code Gear RAD Studio 2009, Windows.NET, Web and database applications can be developed. Delphi 2009 and C++Builder 2009 offer the fastest way to build highly performative native Windows applications. Delphi and C++Builder include visual designers and hundreds of components to easily create rich user interfaces and versatile database applications. RAD Studio’s Delphi Prism, powered by the RemObjects Oxygene compiler, enables development for both .NET and mono applications, and provides support for the latest .NET
Framework technologies including ASP.NET, WinForms, WPF and LINQ [12,13].
2.1.2 The Computer Properties
The properties of the computer used in the test are as in the following:
- ASUS F3J series Notebook
- 100 Gigabyte Hard disk
- 2 Gigabyte RAM
- Intel Core 2 1.83 Gigahertz Processor
- Windows XP Professional Operation System
2.2. Workloads
The workload concept is an ultra significant component in the problem of modeling computer systems [8]. The focus of performance evaluations on workload decreases costs and quantity of simulation [14]. Experimental system evaluations generally contain a set of programs representing workload system. Every performance evaluation program is run with systems having different properties. The behavior of the system is measured and its performance is commented [15]. Workload contains a list of demands of the service from the system. For example, workload constructed in order to compare some database systems a group of queries [2]. Workloads in this study are made up of programs, each of which measures a different property of the programming language. These workloads are shown in Table 2.
Table 2. Workload
Workload Code Explanation
Hello (1) Printing of “Hello World” on the screen for 5000 times M atrix (2) M ultiplication of two matrices of 500 x 500 dimensions
Sorting (3) Sorting of the series with 10000 elements, the element values of which are in the worst situation with the Selection Sorting algorithm.
Sieve (4) Estimation of the prime numbers at the interval of [1..8193] with the sieve algorithm for 10.000 times Empty Loop (5) The empty loop at the interval of [1.. 100000000]
M ean (6) Estimation of the mean of the numbers at the interval of [1..3000] for 30000 times
Table (7)
Writing and Reading of the character knowledge
“abcdefghijklmnopqrstuvwxyz1234567890abcdefghijklmnopqrstuvwxyz123456 7890abcdefgh” with a text file for 10000 times
The algorithms used as workloads have been coded in every language, the performance of which will be tested by using standard properties in a way that they are equal to each other. These coded programs have been transformed into executable code and their memory consumptions have been obtained from Windows Operation System command prompt.
The Hello (1) program tests writing on the screen and loading performance of the program, M atrix (2) and M ean (6) programs integer arithmetic performance, Sorting (3) program loop and logical decision performance. The Sieve (4) program estimates prime numbers by using the classical Sieve Eratoshene algorithm. The Sieve program tests the basic integer arithmetic and logical comparison operation [16]. The Empty Loop (5) program tests the loop performance, Table (7) program tests
2.3. Performance Metric
The performance metrics used in the testing of the performance of the programming languages are shown in Table 3.
Table 3. Performance Metrics Performance Metrics
1 Code Length (LOC/CLOC) 2 Response Time (ms (millisecond)) 3 M emory Use (KB (Kilobyte))
2.3.1. The Code Length of the Programs Written
NLOCK (Uncommented Source Line of Code) is a code line which is not used during compilation. CLOCK (A Commented Source Line of Code) is a code line which is used during compilation. The best estimation should generally be performed as in the following in order to estimate the source code length of a program:
1. Empty lines
2. Lines involved in compilation (CLOC)
3. Data definitions and other commands
4. Lines produced by the software development instrument
The density of the lines compiled in a program can be estimated with CLOC/LOC formula [18].
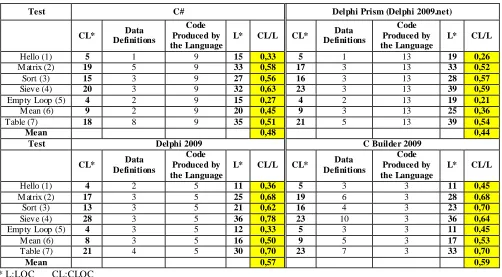
The line numbers of program codes used as a workload in this study have been estimated in line with the explanations stated above and they have been shown in Table 4.
Table 4. Code Lengths of the Programs Written
Test C# Delphi Prism (Delphi 2009.net)
CL* Data Definitions
Code Produced by the Language
L* CL/L CL* Data Definitions
Code Produced by the Language
L* CL/L
Hello (1) 5 1 9 15 0,33 5 1 13 19 0,26
M atrix (2) 19 5 9 33 0,58 17 3 13 33 0,52
Sort (3) 15 3 9 27 0,56 16 3 13 28 0,57
Sieve (4) 20 3 9 32 0,63 23 3 13 39 0,59
Empty Loop (5) 4 2 9 15 0,27 4 2 13 19 0,21
M ean (6) 9 2 9 20 0,45 9 3 13 25 0,36
Table (7) 18 8 9 35 0,51 21 5 13 39 0,54
Mean 0,48 0,44
Test Delphi 2009 C Builder 2009
CL* Data Definitions
Code Produced by the Language
L* CL/L CL* Data Definitions
Code Produced by the Language
L* CL/L
Hello (1) 4 2 5 11 0,36 5 3 3 11 0,45
M atrix (2) 17 3 5 25 0,68 19 6 3 28 0,68
Sort (3) 13 3 5 21 0,62 16 4 3 23 0,70
Sieve (4) 28 3 5 36 0,78 23 10 3 36 0,64
Empty Loop (5) 4 3 5 12 0,33 5 3 3 11 0,45
M ean (6) 8 3 5 16 0,50 9 5 3 17 0,53
Table (7) 21 4 5 30 0,70 23 7 3 33 0,70
Mean 0,57 0,59
* L:LOC CL:CLOC
The graphic of CLOC/LOC values given in Table 4 are shown in Figure 1.
0,00 0,10 0,20 0,30 0,40 0,50 0,60 0,70 0,80 0,90
Hello (1)
Matrix (2)
Sort (3) Sieve (4)
Empty Loop
(5) Mean
(6) Table
(7)
Test
C
LO
C
/LO
C C#
Delphi Prism Delphi 2009 C Builder 2009
[image:3.612.56.558.198.475.2]2.3.2. Response Time
Response time is a significant concept in computer systems performance studies. Response time is the measurement of the time for which a user or an application has to wait until a
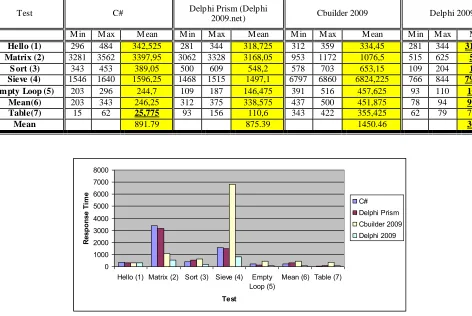
command requested is completed [8]. In this study, response times of workloads run in the programming languages desired to be measured are given in Table 5.
Table 5. Response Time of Workloads on Windows Operation S ystem (ms millisecond)
Test C# Delphi Prism (Delphi
2009.net) Cbuilder 2009 Delphi 2009
M in M ax M ean M in M ax M ean M in M ax M ean M in M ax M ean
Hello (1) 296 484 342,525 281 344 318,725 312 359 334,45 281 344 317,675 Matrix (2) 3281 3562 3397,95 3062 3328 3168,05 953 1172 1076,5 515 625 554,2
S ort (3) 343 453 389,05 500 609 548,2 578 703 653,15 109 204 175,1 Sieve (4) 1546 1640 1596,25 1468 1515 1497,1 6797 6860 6824,225 766 844 791,425 Empty Loop (5) 203 296 244,7 109 187 146,475 391 516 457,625 93 110 100,75 Mean(6) 203 343 246,25 312 375 338,575 437 500 451,875 78 94 91,775 Table(7) 15 62 25,775 93 156 110,6 343 422 355,425 62 79 72,325
Mean 891.79 875.39 1450.46 300.46
0 1000 2000 3000 4000 5000 6000 7000 8000
Hello (1) Matrix (2) Sort (3) Sieve (4) Empty
Loop (5)
Mean (6) Table (7)
Test
R
es
po
ns
e
Ti
m
e
C# Delphi Prism Cbuilder 2009 Delphi 2009
Fig 2: Response Time Graphic of Workloads on Windows Operation System
M ean response times of all workloads by programming languages are shown in Figure 3.
891,79 875,39
1450,46
298,74
0,00 200,00 400,00 600,00 800,00 1000,00 1200,00 1400,00 1600,00
C# Delphi Prism Cbuilder
2009
Delphi 2009
Programming Language
M
ea
n
R
es
po
ns
e
Ti
m
es
Mean response times of all workloads by programming languages
[image:4.612.66.538.138.454.2] [image:4.612.141.474.498.654.2]2.3.3. Memory Consumption
M emory consumption of every workload has been obtained separately by programming languages by using M emory Booster Gold. These values are shown as Kilobyte (KB) in Table 6.
Table 6. Memory Consumption (KB)
The graphic belonging to memory consumption data is shown in Figure 4.
0 2000 4000 6000 8000 10000 12000 14000 16000
Hello (1) Matrix (2) Sort (3) Sieve (4) Empty
Loop (5)
Mean (6) Table (7)
Test
M
em
ory
C
on
sum
pt
ion
(
K
B
)
C# Delphi Prism Cbuilder Delphi 2009
Fig 4: M emory Consumption Grap hic
2.4. Statistical Design
M inimal descriptive statistics contains the following for a data set: total observation number, mean, median, standard deviation,
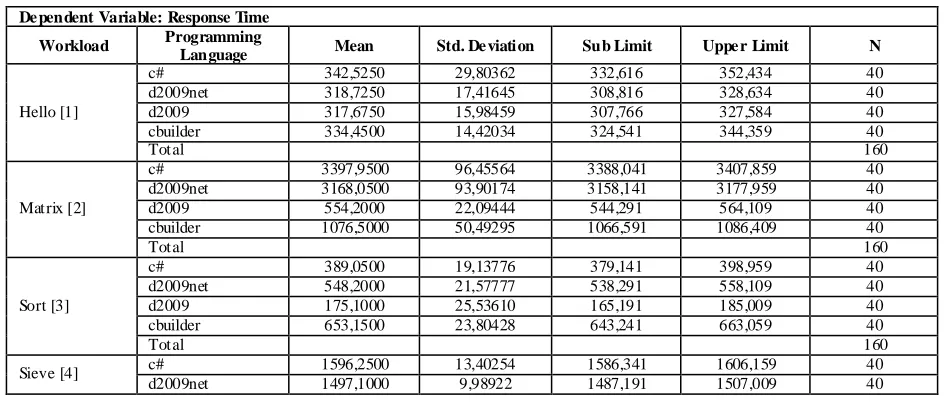
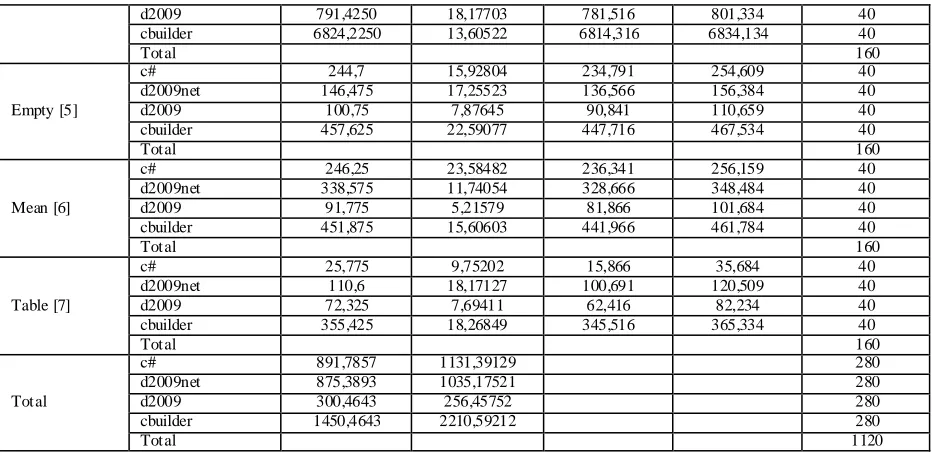
[image:5.612.144.472.284.431.2]minimal value, maximum value and number of observations. Presentation of descriptive statistics data on dependent variable is significant [19]. Therefore, descriptive statistics data obtained are shown in detail by programming languages in Table 7.
Table 7. Descriptive S tatistics
De pendent Variable: Response Time
Workload Programming
Language Mean Std. De viation Sub Limit Uppe r Limit N
Hello [1]
c# 342,5250 29,80362 332,616 352,434 40
d2009net 318,7250 17,41645 308,816 328,634 40 d2009 317,6750 15,98459 307,766 327,584 40 cbuilder 334,4500 14,42034 324,541 344,359 40
Total 160
Matrix [2]
c# 3397,9500 96,45564 3388,041 3407,859 40 d2009net 3168,0500 93,90174 3158,141 3177,959 40 d2009 554,2000 22,09444 544,291 564,109 40 cbuilder 1076,5000 50,49295 1066,591 1086,409 40
Total 160
Sort [3]
c# 389,0500 19,13776 379,141 398,959 40
d2009net 548,2000 21,57777 538,291 558,109 40 d2009 175,1000 25,53610 165,191 185,009 40 cbuilder 653,1500 23,80428 643,241 663,059 40
Total 160
Sieve [4] c# 1596,2500 13,40254 1586,341 1606,159 40 d2009net 1497,1000 9,98922 1487,191 1507,009 40
Workload C# (Delphi 2009.ne t) Delphi Prism C ++ Builde r 2009 Delphi 2009
Hello (1) 4404 4796 3828 1280
Matrix (2) 6648 7352 3516 3312
Sort (3) 4620 4572 1328 3828
Sie ve (4) 4280 4568 1308 1416
Empty Loop (5) 4100 4476 1288 1336
Mean (6) 4340 4508 1316 1336
Table (7) 14656 9654 1420 1388
Mean 6149,71 5703,71 2000,57
[image:5.612.70.542.518.719.2]d2009 791,4250 18,17703 781,516 801,334 40 cbuilder 6824,2250 13,60522 6814,316 6834,134 40
Total 160
Empty [5]
c# 244,7 15,92804 234,791 254,609 40
d2009net 146,475 17,25523 136,566 156,384 40
d2009 100,75 7,87645 90,841 110,659 40
cbuilder 457,625 22,59077 447,716 467,534 40
Total 160
Mean [6]
c# 246,25 23,58482 236,341 256,159 40
d2009net 338,575 11,74054 328,666 348,484 40
d2009 91,775 5,21579 81,866 101,684 40
cbuilder 451,875 15,60603 441,966 461,784 40
Total 160
Table [7]
c# 25,775 9,75202 15,866 35,684 40
d2009net 110,6 18,17127 100,691 120,509 40
d2009 72,325 7,69411 62,416 82,234 40
cbuilder 355,425 18,26849 345,516 365,334 40
Total 160
Total
c# 891,7857 1131,39129 280
d2009net 875,3893 1035,17521 280
d2009 300,4643 256,45752 280
cbuilder 1450,4643 2210,59212 280
Total 1120
ANOVA is used when searching the effect of two independent variables on a dependent variable [20]. In this study, the dependent variable is response time, the independent variables are the program and the programming languages. Significant results have been obtained by applying two-way ANOVA on these dependent and independent variables. However, because variance equality assumption has not been ensured, these results have not been presented in the article. Instead, the Friedman test, a non-parametric method, has been used.
The Friedman test is the non-parametric correspondence of two-way ANOVA test. When the same samples belonging to the subjects have been treated and when these samples have been measured at three or more points, the Friedman test is used [20,21].
The Friedman test has been used in order to find whether there is a significant difference among response times obtained as a result of running of every workload on C#, Delphi Prism, Delphi 2009 and C Builder 2009 programming languages. A significant difference has been found among response times obtained from 4 different programming languages as a result of the analysis of
response times [
2
[image:6.612.74.540.70.298.2]
(df =3, N=280) = 486.261, p< .05] obtained as a result of running of workloads on programming languages. The test data obtained from the Friedman test is shown in Table 8.Table 8. The Friedman Test Data
The Programming
Language N M ean Std. Deviation M ean Rank
2
df PC# 280 891.7857 1131,39129 2.61
486.261 3 .000*
Delphi Prism 280 875.3893 1035,17521 2.51
Delphi 2009 280 300.4643 256,45752 1.25
C Builder 2009 280 1450.4643 2210,59212 3.63
3. RESULTS AND DISCUSSION
When the general means of response times belonging to all the workloads obtained from performance tests, the Delphi 2009 programming language is in average three times as fast as C# and Delphi Prism languages and five times as fast as C++ Builder 2009 languages. When C# and Delphi Prism languages having Net technology are compared, Delphi Prism is 0.01 % faster in terms of response time. However, because measurements have been performed on millisecond, this difference is not very significant. Also, the response times of these languages having Net technology are in average 1.6 times as fast as C++ Builder 2009 language.
When response times of the programming languages are compared in detail by workloads, in all the languages, the performance of which has been tested, the loading and print on the screen speed of the programs is equal to each other with small differences which can be ignored, by the result of Hello (1) test.
In the logical performance by the Sort (4) test results, the Delphi 2009 is 2.2 times as fast as C#, 3.1 times as fast as the Delphi Prism, 3.7 times as fast as the C++ Builder 2009; the Delphi Prism is 1.4 times as fast as the C#. By the Sieve (4) test results which tested the basic integer arithmetic and logical comparison operation, the Delphi 2009 is 2 times as fast as the C#, 1.8 times as fast as the Delphi Prism, and 8.6 times as fast as the C++ Builder 2009. By the results of Empty (5) test which measured the loop performance, the Delphi 2009 is 2.4 times as fast as the C#, 1.4 times as fast as the Delphi Prism, and 4.5 times as fast as the C++ Builder 2009.
Another salient result by the test results is that writing in and reading the text file speed of the C# programming language is faster than the other languages. By the results of the Table (7) test, the C# language is 2.8 times as fast as the Delphi 2009, 4.4 times as fast as the Delphi Prism, and 14.2 times as fast as the C++ Builder 2009. Although the C# language is slower than the Delphi 2009 in other tests, it is faster in writing in and reading the text file operation.
When the density of the lines compiled in the programming languages (CLOC/LOC), the least code density is in the Delphi Prism 2009 language with a 0.44 code density mean. The code density mean of the other languages is respectively the C# 0.48, the Delphi 2009 0.57, and the C++ Builder 2009 0.59. The C# and Delphi Prism languages having Net technology have less code density.
By the memory consumption mean of all the workloads, the Delphi 2009 is the least memory consuming language with a 1985.14 KB. The memory consumption mean of the other languages is respectively the C++ Builder 2000.57 KB, the Delphi Prism 5703.71 KB, and the C# 6149.71 KB. The programming language, the memory consumption of which is the most is the C#. The C# and Delphi Prism languages consume 3 times as much memory as the other languages in average.
4. CONCLUSION
In terms of response time, the fastest programming language is the Delphi 2009 and the slowest programming language is the C++ Builder 2009. Although the managed language C# and the Delphi Prism are powerful in terms of code density, they are weak in terms of memory consumption and response time.
The Delphi 2009 is the most powerful programming language both in terms of memory consumption and response time.
5. REFERENCES
[1] Blackburn, Stephen M .; M cKinley, Kathryn S.,e.g., Wake Up and Smell the Coffee : Evaluation M ethodology for the 21st Century, Communications of the ACM 51 , 83-89, (2008).
[2] J.R. Dick, K. B. Kent , J. C. Libby, A quantitative analysis of the .NET common language runtime, Journal of Systems Architecture 54, 679–696, (2008).
[3] Wikipedi World Wide Web site,
http://tr.wikipedia.org/wiki/.NET_Framework
[4] ] L. Prechelt, ,An empirical comparison of seven programming languages ,Computer, 33,23 – 29, (2000).
[5] N. Juristo, A. M oreno, Basics of Software Engineering Experimentation, Kluwer Academic South America, Boston, (2001).
[6] Codegear C++ Builder (2009): C++ Builder 2009 Web Site:
http://www.codegear.com/article/38534/images/38534/CBu ilder2009FeatureM atrix.pdf
[7]
Codegear Delphi (2009): Delphi 2009 Website: http://www.codegear.com/article/38548/images/38548/Del phi2009FeatureM atrix.pdf[8] P. Fortier, H. M ichel, Computer Systems Performance Evaluation and Prediction, Digital Pres,USA, Burlington, (2003) .
[9] J. G. Allen, , J. S. Jin, , Code Generation for Just -in-Time Compiled M obile Collector Agents, , ACM International Conference Proceeding Series 161,1-4, (2003).
[10] J. Sharp, M icrosoft Visual C# 2008 Step by Step, M icrosoft Pres (USA, Washington, 2007).
[11] J. Sharp, M icrosoft Visual C# 2005 Step by Step, M icrosoft Pres USA, Washington, (2005).
[12] CodeGear RAD Studio 2009 (2009): CodeGear RAD Studio 2009 Web Site:
http://www.codegear.com/products/radstudio
[13] M . Cantù, Delphi 2007 Handbook, Wintech Italia Srl, (2007).
[14] T. M . Conte, W. Hwu, Benchmark Characterization, System Sciences, 1991. Proceedings of the Twenty -Fourth Annual Hawaii International Conference on 1 364-372, (1991).
[15] T. M. Conte, W. Hwu , “Benchmark Characterization for Experimental System Evaluation,” Proc. Hawaii Int'l Conf. System Science I, 6-18, (1990).
[16] R. C. M orin, M anaged C# versus Unmanaged C++ (2009): Web Site:
http://www.csharphelp.com/archives2/archive458.html
[17] M . ŞAHİN, Java, Python Ve Ruby Dillerinin Performans Karşılaştırması, Akademik Bilişim 2007 Dumlupınar Üniversitesi, (2007).
[18] M.Chiş, Evolutionary Decision Trees and Software Metrics for M odule Defects Identification, Proceedıngs Of World Academy Of Scıence, Engıneerıng And Technology, 28, 273-277, (2008).
[19] K. El Emam, A M ethodology for Validating Software Product M etrics, National Research Council of Canada,Ottawa, Ontario, Canada NCR/ERC-1076, (2000).
[20] Ş. Kalaycı,“SPSS Uygulamalı Çok Değişkenli İstatistik Teknikleri”, Asil Yayın Dağıtım Turkey, Ankara, (2008).