http://dx.doi.org/10.4236/am.2014.515213
Simulated Sample Behaviour of a
Dissimilarity Index When Sampling
from Populations Differing by a
Location Parameter Only
Fabio Manca, Claudia MarinUniversity of Bari “Aldo Moro”, Bari, Italy
Email: [email protected], [email protected]
Received 24 May 2014; revised 27 June 2014; accepted 10 July 2014 Copyright © 2014 by authors and Scientific Research Publishing Inc.
This work is licensed under the Creative Commons Attribution International License (CC BY).
http://creativecommons.org/licenses/by/4.0/
Abstract
In this paper the authors study empirically the power of the test based on the index of dissimilari-ty to compare two samples drawn from two populations differing only in the location parameter. We call such a test as test of homogeneity. In practice the power of such a bidirectional test will be studied referring to the absolute value of the shift δ and to the same probability models consi-dered by Fried and Dehling.
Keywords
Dissimilarity Index, Test of Homogeneity, Empirical Distribution, Simulation Studies
1. Introduction
Recently Fried and Dehling (2011) [1] have empirically studied, on small samples, the power of a set of tests for comparing two samples drawn from two populations identified by probability distributions differing only by a location parameter, with shift given by δ . The analysed probability models were normal, Student’s t with 1 and 3 degrees of freedom, and chi-squared with 3 degrees of freedom. The last three models are quite far from nor-mal models as far as kurtosis and skewness are concerned. The aforesaid authors tested the null hypothesis Η0:
0
when the test is bidirectional being the alternative hypothesis Η1: δ ≠0.
An index of comparison between two sets of observations was suggested by Corrado Gini (see details in [2] and in [3]) who introduced the dissimilarity index, which was essentially the mean of the absolute differences between the co-ranked observations in the two sets under comparison. It should be pointed out that the dissimi-larity index is a measure of the divergence between two sets of observations which summarizes all the aspects of such a divergence (location, scale, shape). Furthermore this index, being a distance, is symmetrical with respect to the two compared sets.
In the 60’s and 70’s many authors, as Bertino [4], Herzel [5] and Forcina [6], have been studying the sampling behaviour of the dissimilarity index when the two sets of observations are random samples drawn from the same population. More recently, Girone and Nannavecchia (2013) (see details in [7] and [8]) founded the sampling distribution of the dissimilarity index for small samples drawn from the same population, when the probability model was exponential and uniform.
The aim of this paper is to study empirically the power of the test based on the index of dissimilarity to com-pare two samples drawn from two populations differing only in the location parameter, given the alternative hy-pothesis Η1: δ ≠0. We call such a test as test of homogeneity. In practice the power of such a bidirectional test will be studied referring to the absolute value of the shift and to the same probability models considered by Fried and Dehling.
2. Characteristics of the Test Based on Dissimilarity
Let1, 2, , n ~
X X X F
1, 2, , n~
Y Y Y G
be two random samples where F and G are continuous cumulative distribution functions. F and G have the same shape but are shifted of δ, that is
( )
(
)
G x =F x+δ ,
where δ is real. Let
( )1, ( )2, , ( )n
X X X
and
( ) ( )1, 2 , , ( )n
Y Y Y
be the order statistics in the two samples. The Gini’s sample dissimilarity index [2]
( ) ( ) 1 n i i i X Y D n = − =
∑
,is a random variable measuring the symmetrical divergence between the two samples. A test to verify the ho-mogeneity of the populations from where the two samples were drawn can be constructed on the basis of the sampling distribution of D. Such a distribution is known only for some models (discrete equispaced and equidis-tributed, continuous exponential and uniform) and only in the case of equal sampled populations, i.e. when is F = G. Thesampling distribution of D is unknown when is F ≠G. The complexity of the analytical approach in determining the sampling distribution of D suggested its study via simulation.
models and for each of the considered values of the shift δ , 1000 pairs of samples were simulated, for sample sizes n = 6, 7, 8, 9, 10. The dissimilarity index was computed for each pair of samples. Furthermore, from each
pair of simulated samples, 2n n
pairs of permuted samples were obtained by splitting, in all possible ways, the 2n observations of the pooled sample into two groups of n observations. For each of these pair of groups the dis-similarity index was also computed. Once the level of significance α is fixed, a measure of the power of the test to verify the null hypothesis of homogeneity of the two sampled populations is given by the fraction on the total of the replications of the simulated samples for which the dissimilarity index is above the fraction 1 − α of the dissimilarity indexes of the correspondent permuted samples. The significance level α = 0.05 as been considered in the simulations.
3. Power of the Test in Relation to the Sample Size
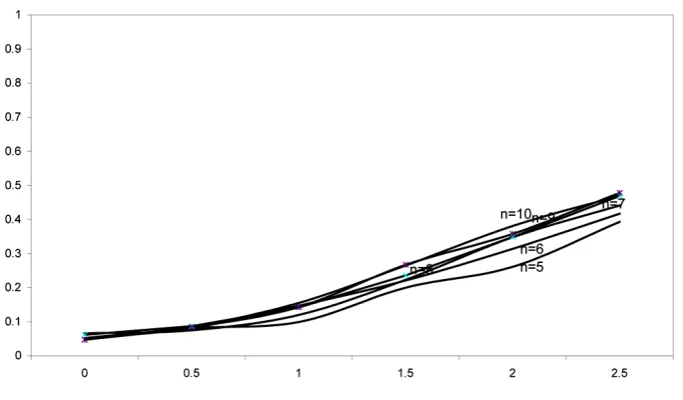
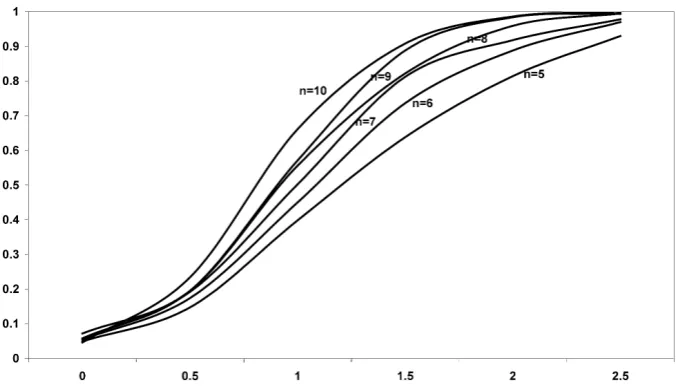
Figures 1-5 show, for each of the considered models, the graphs of the power of the test of homogeneity based on the index of dissimilarity, in relation to the shift δ and for each sample size n.
Figure 1. Power of the bidirectional test of homogeneity based on dissimilarity index when sampled populations are normal.
[image:3.595.144.486.491.691.2]Figure 3. Power of the bidirectional test of homogeneity based on dissimilarity index when sampled populations are Student’s t with 3 degrees of freedom.
Figure 4. Power of the bidirectional test of homogeneity based on dissimilarity index when sampled populations are χ2 with 3 degrees of freedom.
It can be seen that, when the sampled populations are normal, the power of the test based on the dissimilarity index, obviously, increases both as the sample dimension and the value of the shift δ increase. In particular, as the sample size increases, the highest improvement of the power can be observed for a shift δ = 1.5, as well as good improvements can be noticed, for increasing sample sizes, for shift values ranging between 1 and 2. For δ values outside this range, the power improvement for increasing sample sizes n turns out to be quite negligible. Furthermore it should be noted that for very high values of δ (≥2.5) even small samples provide a very good power of the test (ϒ > 0.9).
It can be seen that, also when the sampled populations are Student’s t with 1 degree of freedom, the power of the test based on dissimilarity index, obviously, increases both as the sample size and the value of the shift δ in-crease. In particular, as the sample size increases, the power improvement is practically nil for δ = 0.5, it reaches approximately the value 0.05 for δ ranging between 1 and 1.5, it increases approximately by 0.1 for δ = 2, 2.5. Even for high values of δ and sample size n = 10 the power of the test does not exceed the value of ϒ = 0.5. Evidently, the fat tails of the distribution of the Student’s t with 1 degree of freedom have a negative impact on the power of the test based on dissimilarity index, like it happens with many other tests.
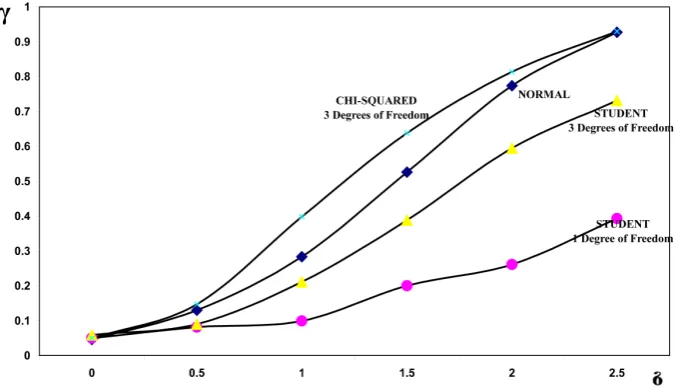
[image:4.595.144.484.89.273.2] [image:4.595.144.485.308.503.2]Figure 5. Power of the bidirectional test of homogeneity based on dissimilarity index for two samples of size n = 5, in relation to the considered probability models.
similarity, as usual, also increases both as the sample size and the value of the shift δ increase. In particular, as the sample size increases, the power improvement is quite negligible for δ = 0.5, it reaches approximately the value 0.15 for δ = 1, and it keeps going up to about 0.25 for δ = 1.5, 2, 2.5. The power of the test for δ = 2.5 is quite good (ϒ ≥ 0.8) even for small sample sizes (n = 6, 7). The results appear to be much better when compared to those related to Student’s t with 1 degree of freedom, but less good when compared to those related to the two remaining models.
It can be seen that, also when the sampled populations are chi square with 3 degrees of freedom, the power of the test based on dissimilarity, obviously, increases both as the sample size and the value of the shift δ increase. In particular, as the sample size increases, the highest improvements of the power can be observed for values of the shift δ ranging between 1.5 and 2. For δ values below 1 or greater than 2, the power gain with increasing n turns out to be quite modest. Furthermore it should be noted that for high values of δ (δ ≥ 2) even small samples provide a good power of the test (ϒ > 0.8) and for higher values of δ (δ > 2.5) the power of the test is really ex-cellent (ϒ > 0.9).
4. The Power of the Test in Relation to the Probability Models
Figures 5-12 report, for each sample size n, the powers of the test based on the dissimilarity index as functions of the shift δ, for each of the considered models.
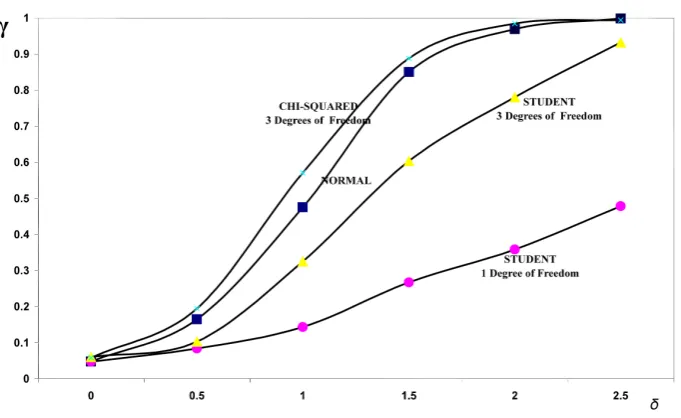
It can be seen that, when the sample size n = 5, the power of the test of homogeneity of the sampled popula-tions is higher for the chi square model with 3 degrees of freedom. The power is still high for the normal model, though it is lower than the previous model for values of δ ≤ 2.5. For δ = 2.5 the power of the test is the same for both models. The power of the test appears to be lower when switching to the Student’s t with 3 degrees of free- dom, and even lower when the Student’s t with 1 degree of freedom is considered. Unlike the first two models, for the last two models the divergence between the power of the test seems to increase as the shift δ increases.
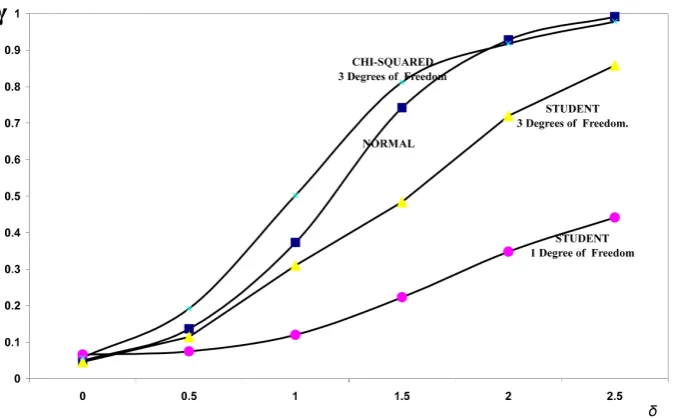
What has been now stated for sample size n = 5 is also valid for size n = 6, respect to which slight improve-ments of the powers are observed for all the considered models.
The same considerations apply to sample size n = 7, noting that as the size increases slight improvements of the powers are observed for all the considered models.
When n = 8 the power improvement affects more the Student’s t with 3 degrees of freedom. In the case of models such as the chi squared with 3 degrees of freedom and the normal the powers of the test appear to be quite close.
Figure 6. Power of the bidirectional test of homogeneity based on dissimilarity index for two samples of size n = 6, in relation to the considered probability models.
Figure 7. Power of the bidirectional test of homogeneity based on dissimilarity index for two samples of size n = 7, in relation to the considered probability models.
5. A Comparison between the Powers of the Tests Based on Dissimilarity and the
Most Powerful Tests among Those Suggested by Fried and Dehling
Figures 11-14 report, for sample size n = 10 and for the different models, the powers of the tests based on dis-similarity index together with the most powerful tests considered by Fried and Dehling [1].
Figure 8. Power of the bidirectional test of homogeneity based on dissimilarity index for two samples of size n = 8, in relation to the considered probability models.
Figure 9. Power of the bidirectional test of homogeneity based on dissimilarity index for two samples of size n = 9, in relation to the considered probability models.
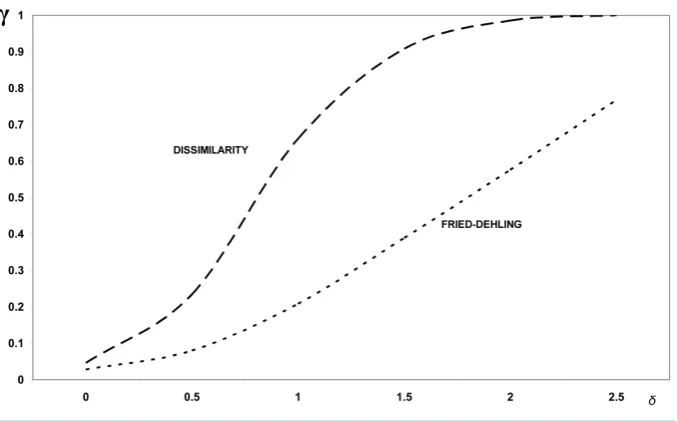
Let us now turn to the Student’s t with 1 degree of freedom which, as we know, is a model, characterised by symmetry and by a strong kurtosis. As far as this model is concerned, both the test based on the dissimilarity in-dex and the best test among those suggested by Fried and Dehling [1] appear to be less powerful in comparison to the case of the normal model. It is quite likely that similar results can be achieved for other kurtotic models. Obviously, as it can be observed in Figure 12, for both tests, namely the one based on dissimilarity index and the best test among those suggested by Fried and Dehling [1], the power increases with increasing δ . Further-more it must be noted that the test based on dissimilarity is less powerful than the best of the tests suggested by Fried and Dehling [1] and it becomes less and less powerful as the value of the shift δ increases. The power of the dissimilarity index is equal to slightly more than half of the power expressed by the best of the indexes sug-gested by Fried and Dehling [1].
[image:7.595.145.486.317.526.2]Figure 10. Power of the bidirectional test of homogeneity based on dissimilarity index for two samples of size n = 10, in relation to the considered probability models.
Figure 11. Comparison between the powers of the test of homogeneity based on dissimilarity index and the test based on the difference of the averages: case of the normal model and sam-ple size n = 10.
comparable. A more careful look of it discloses the superiority of the best test among those suggested by Fried and Dehling [1] for values of the shift δ ≤1.5 and the superiority of the test based on the dissimilarity index for values of the shift above this threshold.
Let us have a look in the end at the chi-squared with 3 degrees of freedom, model that is characterised by positive skewness. As it can be seen from Figure 13, showing the powers of the best test among those suggested by Fried-Dehling [1] and the test based on dissimilarity, the latter test discloses a superiority for all values of the shift δ . In particular, such a superiority increases for values of the shift δ ≤1.5 whereas it decreases for val-ues of the shift exceeding this threshold.
6. Conclusions
[image:8.595.145.485.319.527.2]Figure 12. Comparison between the powers of the test of homogeneity based on dissimilarity index and the best of the tests considered by Fried-Dehling.
Figure 13. Comparison between the powers of the test of homogeneity based on dissimilarity index and the best of the tests considered by Fried-Dehling.
fering only by a location parameter. The analysed probability models were normal, Student’s t with 1 and 3 de-grees of freedom, chi-squared with 3 dede-grees of freedom.
For each of these models two samples were generated via simulation, with location parameters in the sampled populations differing by a shift δ set equal to the standard deviation multiplied by 0, 0.5, 1, 1.5, 2, 2.5.
For each of the considered sample sizes n = 5, 6, 7, 8, 9, 10and for each of the 6 values of the shift δ men-tioned above, 1000 pairs of samples were simulated for each model. This was done in analogy to an earlier study by Fried and Dehling [1] who considered many other tests in their work however.
The results coming from the simulation allow assessing the power of the test based on the dissimilarity index in relation to the size of the shift δ and to the considered sample sizes.
Figure 14. Comparison between the powers of the test of homogeneity based on dissimilarity index and the best of the tests considered by Fried-Dehling.
The power of the test based on dissimilarity index has been at the end compared with the power of the most powerful test among those considered by Fried and Dehling [1]. When the normal model is considered it comes out the obvious superiority of the test based on the ratio between the difference of the averages and the square root of the joint variance. Such a superiority, anyway, diminishes as the shift δ grows, to nearly reach zero for values of the shift greater than 2. Regarding the chi-squared model, the test based on the dissimilarity index ap-pears significantly more powerful than the best test among those considered by Fried and Dehling [1], and this is true for any value of the shift δ . About the Student’s t with 1 degree of freedom it should be noted that the test based on the dissimilarity index seems to be systematically less powerful than the best among the tests consid-ered by Fried and Dehling [1] and this inferiority seems to increase as the shift size increases. When Student’s t with 3 degrees of freedom is considered, the test based on the dissimilarity index and the best among the tests considered by Fried and Dehling [1] show powers which appear to be quite similar. The power of the test based on the dissimilarity index seems to be slightly lower for values of the shift lower that 1.5 and slightly higher for values of the shift higher than such a threshold.
References
[1] Fried, R. and Dehling, H. (2011) Robust Nonparametric Tests for the Two-Sample Location Problem. Statistical Me-thods & Applications, 20, 409-422. http://dx.doi.org/10.1007/s10260-011-0164-1
[2] Gini, C. (1914-15) A Measure of Dissimilarity between Two Groups of Quantities and Its Application to the Study of Statistical Reports. Atti del R. Istituto Veneto di Scienze Lettere ed Arti, Tome 24.
[3] Gini, C. (1965) The Dissimilarity. Metron, 24, 85-215.
[4] Bertino, S. (1972) On the Mean and Variance of the Index of Dissimilarity in the Case of Samples from the Same Ab-solutely Continuous Random Variables. Metron, 30, 256-281.
[5] Herzel, A. (1965) The Mean Value and the Variance of the Index of Dissimilarity in the Universes of the Simple Ber-noulli’s Samples. Library of Metron, Serie C, Notes and Reports, Tome II, Roma.
[6] Forcina, A. and Galmacci, G. (1974) On the Distribution of the Index of Dissimilarity. Metron, 32, 361-374.
[7] Girone, G. and Nannavecchia, A. (2013) The Distribution of an Index of Dissimilarity for Two Samples from a Uni-form Population. Applied Mathematics, 4, 1028-1037. http://dx.doi.org/10.4236/am.2013.47140
currently publishing more than 200 open access, online, peer-reviewed journals covering a wide range of academic disciplines. SCIRP serves the worldwide academic communities and contributes to the progress and application of science with its publication.
Other selected journals from SCIRP are listed as below. Submit your manuscript to us via either