© 2018, IRJET | Impact Factor value: 6.171 | ISO 9001:2008 Certified Journal | Page 138
Optimization of Process Parameters for Minimization of Insulation
Coating Defects in Electrical Steels
Mr. Vivek Vijay Mahajan
1, Prof. P.N. Gore
21
P.G. Student, M.E. Mechanical (Product Design and Development), Mechanical Department,
D.K.T.E.’s Textile and Engineering Institute, Ichalkaranji, Maharashtra, India.
2
Associate Professor, M.E. Mechanical (Product Design and Development), Mechanical Department,
D.K.T.E.’s Textile and Engineering Institute, Ichalkaranji, Maharashtra, India.
---***---Abstract
- Insulation coating is used in the electrical steels in order to reduce the losses occurred in the form of heat loss which is a part of overall core loss. Defects related to insulation coating causes rejection of electrical steel product coils. So in order to minimize the insulation coating defect, there is need to optimize the product process parameters. The optimization of these process parameters with the help of design of experiment are discussed in this paper.Keywords
: Electrical steel, coating, core loss, Taguchi design of experiment1.
INTRODUCTION
This study is mainly focuses on optimization of product process parameters in order to minimize the rejection generated during product processing. In this study the objective is to reduce rejection rate due to coating defect in ‘Cold Rolled Non Grain Oriented Electrical Steel (CRNGO)’.
[1]Electrical steels main requirement from the applications is
‘Lower Hysteresis Loss and ‘lower eddy current losses. Hysteresis loss is controlled with annealing and eddy current losses are controlled with applying insulation coating on sheet surface. Many Insulation defects occur in surface coating process through various reasons at the time. [2]These
defects contribute much rejection of prime products to non prime products. [6]To prevent these defects operator have to
take more care & precautions to control. Some of the defects Uncoated spots, Coating groove line, Coating peel off, over curing, Solution stain, Roll mark, Powder formation.
2.
OBJECTIVE
Objectives of project work are defines as mentioned below,
To collect product rejection data of due to insulation coating defects.
Analyze defect wise product rejection data.
To correlate defects & production process parameters
Design of experiments for critical factors affecting production process & selection of its range.
Finding optimal production process parameters of product.
Applying optimal process parameters for performing trials to minimize product rejection & achieve higher product yield.
3. METHODOLOGY
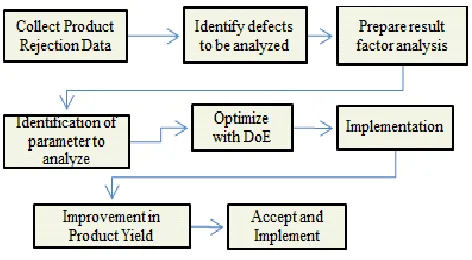
[image:1.612.329.565.447.577.2]In Electrical Steel product the various factors causing the insulation surface defects will be taken as input for Design of Experiment (DoE). The outcome from DoE is minimization of % surface insulation defects & optimization of process parameters to improve product yield.
Fig-1: Flow Chart of using Design of Experiments
4. PRODUCT REJECTION ANALYSIS
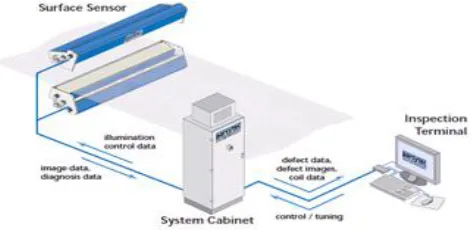
4.1 Product rejection data collection system
Surface Defect Detector (SDD)
POSCO’s Inspection Standard
Online Inspector Remark Data Base
Production Result (Monthly)
[3]Mainly the total rejection data is classified as coating
defects and other process defects
[4][5]Coating Defects includes following defects as;
Surface Peeling (Uncoated Spots)
Line Peeling (Groove Lines)
No Peeling (Uncoated Lines)
Staining Dust (Shiny Spots)
[6]Other Process defects includes defects coming from raw
[image:2.612.42.278.308.423.2]material like Black Line, Dirt Scab, Hole, Sliver, Hearth Roll Mark, Edge crack etc.
Fig-2: Surface Defect Detector (SDD)
4.2 Present Rejection Details
The defect data is collected given in chart-1.
Chart-1: Jul’16 – Oct’16 Coating defect summary
5.
PROBLEM SUMMARY
After collection of rejection data, we came to conclusion that the total defect ratio due to Coater found as. 21.22%.Major Defects:
a) Uncoated Spots b) Shinny Spots c) Uncoated Line d) Groove Lines
5.1 Setting Target for minimzation of Insulation coating defect:
We have decided to reduce existing coating defect level to its half i.e. upto 10 %.
6. DESIGN OF EXPERIMENT
In order to optimize the products production process parameters, it needs to figure out the production process parameters which affect the product process along with its operating ranges.
[8]There are various production process parameters
which are adding values to the final product as per production standard. But we should focus on the coating process parameters which is our area of interest in design of experiment. These process parameters are identified and there possible levels selected for design of experiments. With this the further experimental strategy has been decided.
6.1 Experimental Work
The main causes of product rejection due to coating defects whose control factors and there levels are selected as given in following section 6.2. The experimental work is carried with selecting the factors there levels, then defining experimental array, conducting the experiment, summarizing the defect data and further do analysis of experiment.
6.2 Selection of Levels of the Control Factors i.e. process parameters
[9]The levels selected based on the standards
[image:2.612.37.291.510.705.2]acceptable and experience in of the operators who actually working for products production. The parameters, along with their ranges are given in following Table-1, the levels are considered while selection of orthogonal array
7. SELECTION OF ORTHOGONAL ARRAY
[image:3.612.347.555.74.200.2]L9 orthogonal array is assigned for different process parameters of bearing spider component as shown in Table-2;
Table-2: Experimental L9 Orthogonal Array
8. CONDUCTING THE MATRIX EXPERIMENTS
[12]Measurement of these process parameters were
taken by using different measurement techniques such as Hydrometer for specific gravity, Profile Projector for Threads per inch (TPI), load cells to measure Nip Pressure.
Following figure shows the hydrometer which is used to measure specific gravity of insulation coating solution.
Fig-4: Hydrometer
Fig-5: Grinding & threading
Fig-6: Profile project
For measuring threads per inch of coater roll manufactured with lathe machine, profile projector is used [7].
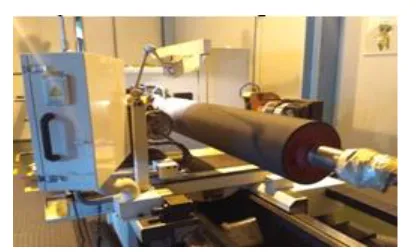
For measuring Nip pressure, the load cells are installed near the hydraulic actuators which are used to opening and closing of coater roll. Following figure is of coater arrangement where the nip pressure is adjusted by actuating hydraulic actuators.
Once the parameters and parameter interactions are assigned to a particular column of the selected orthogonal array, the factors at different levels are assigned for each trial. The assigned experimental array is shown Table-3.
[10]The experimental trials of product process are
carried against the trial conditions given in Table No.8. The experiments are conducted as per specified trial parameters and according to standard operating procedures of production. The insulation coating defects that occur in each trial conditions were measured. All the results were recorded in the matrix experiments is tabulated and maintained in Table-3.
9. RESULT OF TRIAL TAKEN ACCORDING TO DESIGN
OF EXPERIMENT
[image:3.612.68.257.174.326.2]Chart-2 Trial Experiment-Defect Distribution in %
9.1 Taguchi analysis for design of experiment Response for S/N Ratios
[11]The response table for S/N ratio is shown in
[image:4.612.327.571.191.367.2]following Table-4. From the response table it is predicted that how process parameters influences on product process according to rank of parameters. As our response variable is ‘lower is better’ hence all values are negative.
[image:4.612.326.575.412.595.2]Table -4: Response Table for S/N ratio
Table-5: Response Table for Means
Main Effect Plots
The mean response refers to the average value of the performance characteristic for each parameter at different
levels. The average values of the insulation coating defects and S/N ratios for each parameter at different levels are calculated and are given in Table-5.
The average values of the response at each parameter level are obtained by adding the results of all trails conditions at the level considered, and then dividing by the number of data points added.
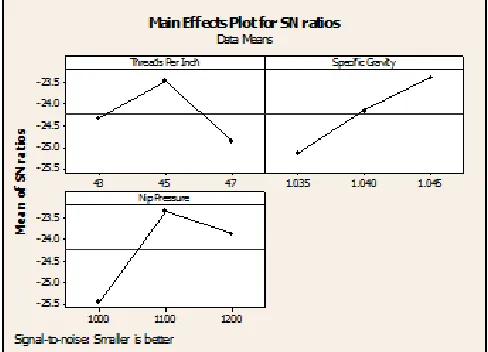
Chart-3: Main Effects Plot for SN ratios for % Defects
From the above main effect plots of S/N ratio & means for % defects, it is clear that the insulation coating defects found minimum at the second level of parameter A (A2), third level of parameter B (B3) and second level of parameter C (C2). The S/N ratio is maximum at the same levels of the parameters (A2, B3 and C2) as the best values for getting
9.2 Prediction of results
After conducting matrix experiments and summarizing the defects percentage in each experiments of L9 orthogonal array, we used the prediction of results tool in Minitab to predict the results of other possible experiments.
[image:5.612.72.262.243.311.2]The use of prediction of results is to predict the result for the possible experiments which we unable to did due to limitation of trials. Also it is helpful in predicting the results of suggested factors which was outcome of the design of experiment exercise.
Table-6: Prediction of Results
10. VALIDATION EXPERIMENT
In this study, after determining the optimum conditions and predicting the response under these conditions, a new experiment was designed and conducted with the optimum levels of the product process parameters. The final step is to predict and verify the improvement of the performance characteristic.
So trial validation experiment was planned on the basis of predicted process parameters & if these parameters lead to desired target % rejection then validation production of significant production quantity is viable.
The experimental results are shown in following Table No.7 & Table No.8
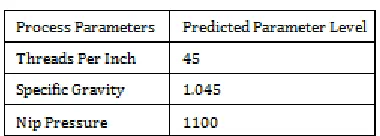
Table -7: Predicted Process Parameters and their level
Table-8: Results of Confirmation Experiments
As per optimized product process parameters two confirmation experiments have carried out. Two validation experiments are conducted at the optimum settings of the process as shown in Table No.14. The result of the mass trial experiment was found to be 8.32 %, which is well within the target projected value of 10% for the insulation coating defects. Therefore, the selected parameters as well as their appropriate levels are significant enough to obtain the desired result.
11. CONCLUSION
In this work, Taguchi method of design of experiments is used to optimize the process parameters of the electrical steel product coil production to minimize the insulation coating defects.
The optimized levels of the selected parameters are:
i. Threads per inch (A): 45 ii. Specific gravity (B): 1.045 iii. Nip Pressure (C): 1100
From the results of the study, it is found that the application of Taguchi method to the electrical steel production process has the following contributions:
Increases stability of the production process. Taguchi
method optimized control factors, resulting in superior product quality and stability.
Improvement in product yield is possible because,
prior to the application of the Taguchi methods, the insulation coating defects are reduced to a significant level of total defects from electrical steel produced.
12. REFERANCES
[1] ‘Standard Classification of Insulating Coatings for Electrical Steels by Composition, Relative Insulating Ability and Application’, ASTM Standard: Designation: A976, 2008.
[2] Greg C. Stone, Edward A. Boulter, Ian Culburt, Hussein Dhirani,‘Electrical Insulation For Rotating Machines, Design, Evaluation, Aging, Testing, and Repair’, By A John Wiley & Sons, INC, Publications. 2004.
133}135.
International Journal of Advance Research In Science And Engineering, IJARSE, Vol. No.3, Issue No.11, November 2014.
[5] Qiwu Luo a,n, YigangHe, ‘A cost-effective and automatic surface defect inspection system for hot-rolled flat steel’, Robotics and Computer-Integrated Manufacturing 38 (2016), page 16–30.
[6] Dannie S. Loudermilk, Jack L. Brown., Patent-US5955201,‘Inorganic/Organic Insulation Coating For Non Oriented Electrical Steel’, Sept 21, 1999.
[7] Kuo Kuo and Jinn-Chern Wu Ching, ‘Analysis of Microstructure for Insulating Coating on Non-Oriented Electrical Steel’, China Steel Technical Report, No. 23, pp 46-51, (2010).
[8] George T. Bayer, Ph.D. Mehrooz Zamanzadeh, Ph.D., ‘ Failure Analysis of Paints and Coatings’, Matco Associates, Inc. Pittsburgh, Pennsylvania August 3, 2004
[9] J.R. Franklin, ‘The Surface coating of material’, Publication Department, Metco Ltd, Chobham, Woking GU24 8RD, Materials & Design Vol.6 No.3 June/July 1985.
[10] Philip Beckley, Editors Prof. A.T. Jones, Prof D.F. Warne, ‘Electrical Steel For Rotating Machines’, IET power and energy series 37, Series. Published by The institute of Engineering and Technology, London, UK, 2002.
[11] Ranjan Prakash, Baidya Nath Roy, ‘Quality Improvement in Finished Cold Rolled Sheet by reducing the defect’, International Journal of Scientific & Engineering Research, Volume 7, Issue 3, March-2016, pp 595-601.