Control Performance Standard based Load Frequency
Control of a two area Reheat Interconnected Power
System considering Governor Dead Band nonlinearity
using Fuzzy Neural Network
R.Francis I.A.Chidambaram
Asst. Professor In Electrical Engg, Professor In Electrical Engg, Annamalai University, Annamalai University, Annamalainagar.608002, India Annamalainagar – 608002, India
ABSTRACT:
The frequency control of reheat interconnected two area power systems are mainly characterized by non-linearity and uncertainty. A hybrid neural network and fuzzy control is proposed for load frequency control in the power systems considering governor dead band (GDB) non-linearity. Fuzzy with neural network is employed to forecast the control input requirement and system’s future output, based on the current Area Control Error (ACE) and the predicted change-of-ACE. The Control Performance Standard (CPS) criterion is adopted to the fuzzy controller design, thus improves the dynamic quality of system. The system was simulated and the output responses of frequency deviations in area 1 and area 2 and tie-line power deviations for 1% step-load disturbance in area 1 were obtained. The comparison of frequency deviations and tie-line power deviations for the two area interconnected thermal power system considering GDB nonlinearity with Redox Flow Batteries (RFB) reveals that the system with hybrid fuzzy neural controller enhances a better stability than that of system with integral controller.Keywords:
Automatic Generation Control, Governor Dead Band, Control Performance Standards, Redox Flow Batteries.1. INTRODUCTON
Load frequency control is one of the major requirements in providing reliable and quality operation in multi-area power systems [1]. In interconnected large power systems, variations in frequency can lead to serious large scale stability problems. Load characteristics, unexpected changes in power demand and faults also affect the stability. For satisfactory operation, constant frequency and active power balance must be provided. As frequency is a common factor, any change in active power demand/generation of power systems is reflected throughout the system by a change in frequency. It is necessary to design a LFC system that controls the power generation and active power at the tie-lines. In conventional LFC applications, proportional integral (PI) controllers [2] are most commonly used, but it is not easy to obtain the proper gain parameters of the PI controller as the
frequency within a certain scope is realized through maintaining the total power input of the tie-line bias control of power system. The inherent non-linearity in system components has led researchers to consider Neural Network (NN) and fuzzy logic techniques
[3-9] to build a non-linear controller with high efficiency. A feed forward neural network has been trained by back propagation-through-time algorithm to control the steam turbine admission valve. The NN based controller for a two
area interconnected system which consists of reheat turbines and generation constraints have been studied. The inputs to the proposed NN controller are system state variables and disturbance vector. Back propagation-through-time algorithm has been used to cope with the continuous time dynamics as the learning rule. In using neural networks for dynamic power system control, since it contains large number of parallel input vector, the total system may be too complicated. This is initially designed for a fuzzy logic controller in the load frequency control of the power system. A specified control scheme has been designed for a two area interconnected power system with control dead zone [2]. A combined fuzzy logic and NN based controller for LFC have also been designed using conventional Area Control Error (ACE) Criterion. A new type of control scheme called Control Performance Criteria (CPC) has been used to evaluate LFC performance, which is of great importance as high quality control in required in the present day power transfer applications. The Control Performance Standard (CPS) is specifically designed to comply with the performance standards imposed by the North American Electric Reliability Council (NERC) for equitable operation of an interconnected system. Fuzzy logic system is usually designed to assure that the control performance is in compliance with NERC’s control performance standards [8,9]. Considering the power system load frequency control, this paper establishes a recurrent neural network model to predict the future frequency of the target object, thus forecasting the ACE and the CPS standard index. Based on this prediction, the optimized controller is designed, which follows the CPS performance standards through the fuzzy logic control. Simulation results show the effectiveness of the proposed method.
2.1 Modeling of two area interconnected power system with RFB
The linearized mathematical model of the two area (thermal–reheat) power system, is given by the following set of the state variable differential equations as
() . () ( ) ( )
1 )
( 1 1 1 1
1 1
1 Pg s Kc Pc s Pd s Ptie s
sTps Kps s
F
(2.1)
) ( 1
1 )
( 1
1 1 1
1 Pt s
sTr Tr sKr s
Pg
(2.2) )
( 1
1 )
( 1
1
1 Xe s
sTt s
t
P
( ) 1 ( )
1 1 ) ( 1 1 1 1
1 F s
R s Pc sTg s Xe (2.4)
() ()
. 2 )( 1 2
12 s F s F s T s
Ptie
(2.5)
() . () () . ()
1 )( 2 2 2 2 12
2 2
2 Pg s Kc Pc s Pd s a Pties
sTps Kps s
F
(2.6) ) ( 1 1 ) ( 2 2 2 2
2 Pt s
sTr Tr sKr s
Pg
(2.7) ) ( 1 1 ) ( 2 2
2 Xe s
sTt s t P (2.8)
( ) 1 ()
1 1 ) ( 2 2 2 2
2 F s
R s Pc sTg s Xe (2.9)
The system state space equations are developed as
X
=Āx+ Bu +dY=CX (2.10)
where, x, u and d are the state, control and disturbance vectors. The control and disturbance vectors are given by
System Control input vector
2 1 2 1 c c P P u u u Disturbance vector 2 1 2 1 D D P P d d d Where ,
Augmented system matrix
A C A 0 0
Augmented control input matrixB
0 B
Augmented disturbance matrix
0
Augmented output matrix C
0 C
Two state vectors ∫ ACE1 and ∫ ACE2 are included in the augmented state matrix
∫ACEi = ∫βi ∆fi +∆Ptie i=1, 2 (2.11)
Substituting the value we get,
(2.12)
2.2 The Governor Dead Band (GDB)
GDB is defined as the total magnitude of a sustained speed change within which there is no change in valve position. The limiting value of dead band is specified as 0.06%. The speed-governor dead band has a significant effect on the performance of the governors and it has a destabilizing effect on the transient performance of the system. A describing function approach is used to express the GDB nonlinearity. For an element with a backlash characteristic of hysteresis
type in nature, the describing function giving the output-to-input relationship for the component of the fundamental frequency shows that the output lags the input by an angle which is independent of frequency but is a function of the ratio of the amplitude of the input oscillation to the width of the backlash loop. An adequate description of GDB nonlinearity is expressed as
y =
F
(
x
,
x
)
(2.13)
If the variable ’x’ in the nonlinear function F(x,X ) has the sinusoidal form, then the variable F(x,
X ) is
generally complex, but is also a periodic function of time. As such, it can be developed in a Fourier series as follows:
)
x
,
x
(
F
= F0 + N1 x + (N2/W0)
X + (2.14)
As the backlash nonlinearity is symmetrical about the origin, Fo =0. Further, it has been found that the backlash nonlinearity tends to produce a continuous sinusoidal oscillation with a natural period of about 2 seconds. Then A typical value of backlash is 0.06%. However, by referring to the discussion of A/D = 4 will imply a backlash of approximately 0.05%.
This value of A/D is chosen for simulation results and the following Fourier Coefficients are obtained.
+
x
e1(s) PT1'
(s) Pg1(s)
u1(s) _
ACE1(s) + _+ + _
_
Pc1(s)
Governor Reheat turbine Power system
x
e2(s) PT2 '(s) Pg2(s) Power system
ACE2(s) u2 (s) + _
+ _ _ _
Pc2(s)
Governor Reheat turbine
[image:3.595.38.549.75.514.2]
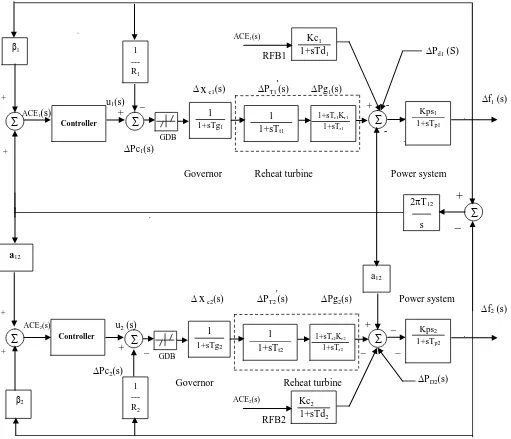
Fig.1 Block diagram of a two-area interconnected thermal reheat power system with RFB and considering Governor Dead Band nonlinearities
0.2
k N and 8 . 0 k
N1 2
ωo = 2πfo = π with fo = 0.5Hz. (2.15)
The governor transfer function with linearized dead band is given as [2]
G(s) = (N1+N2s)/ (1+TGis) (2.16)
where N1 and N2 are Fourier coefficients whose values are obtained as N1 = 0.8 and N2 = -0.2/π
2.3 Modeling of RFB Units
Redox flow battery, in addition to load leveling, a function commonly assigned to them, have range of allocations such as Load Frequency Control (LFC) and power quality maintenance for decentralized power supplies [10].
(2.17)
i rfbi Kci Pc
P
.
(2.18)
f2 (s)
Σ
ControllerΣ
Σ
Σ
Kps1 1+sTp1 1
---R1 β1
Σ
ControllerΣ
a12
1 ---R2 β2
a12
Σ
Kps2 1+sTp2
2T12
s
Σ
f1 (s)
+
_
+
+
+
+
+
-Pd1 (S)
PD2(s)
Kc2
1+sTd2
RFB2 ACE2(s)
Kc1
1+sTd1
RFB1 ACE1(s)
1
1+sTg1
1 1+sTt1
1+sTr1Kr1 1+sTr1 GDB
1
1+sTg2
1 1+sTt2
2.4.1Control Performance Standard criterion
In 1997 NERC developed more sophisticated criteria called Control Performance Standard (CPS1, CPS2) which ensures better quality control with more measurements and data collection. The CPS1 assesses the impact of ACE on frequency over a certain period window or horizon and it is defined as follows: over a sliding period, the average of the “clock-minute averages” of a control area’s ACE divided by “10 times its area frequency bias” times the corresponding “clock-minute averages of the interconnection of frequency error” shall be less than the square of a given constant, E1, representing a target frequency bound. These strategies lead to the conclusion that ACE should satisfy a decreasing function of T.
RMS {AVGT {ACE}} = φ (T) (2.19)
where φ(T) is the root-mean-square (RMS) of all the T minute average ACE values over the past 12 months. It is shown in [8] that if ACE were a random signal, φ (T) would be proportional to 1/T. Of course ACE itself cannot be made to meet this condition because its next data cycle value is far more likely to be close to the present value than to be random. However, a good control algorithm can make AVGT {ACE} nearly random for T. Moreover, this can be accomplished with far less generation maneuvering than that of many present AGC schemes.
2.4.2 CPS2
Since CPS allows areas to benefit from a large |ACE| when ACE x ΔF is negative, a second Control performance standard, CPS2 is applied to ten minute average ACE. This standard is derived from an interconnection objective:
RMS {ΔF10} ≤ E10 (2.20)
Where ΔF10 is the ten minute average of F, and 10 is a target bound for the 12 month RMS often minute average interconnection frequency error. This standard is is a rolling 12 month condition to
be met 90% of the time. The CPS2 standard is based on the dimensionless compliance factor:
CF2=1/L10*|ACE10| (2.21)
Where L10 is the 10 minute average
L10 = 1.65 E10 (2.22)
The number L10 is the area's average B over the ten minute interval reassessment! The multiplier 1.65 is the statistical conversion factor from a 68.3% confidence limit (1 standard deviation) to a 90% confidence limit. The parameter v relates the size of the area to that of the interconnection.
A derivation of Bi based on fair considerations for electric interconnection is given in (2.22). Thus, if all B values are constant, it is simplifies to:
L10=1.65E10√ (-10Bi)*(-10Bi) (2.23)
For most areas, L10 values given by (2.23), using NERC's recommended 10 target for each of the NERC Interconnections, are larger than that of the criterion used earlier(i.e before 1997).
To measure compliance with CPS2, one first compute the ratio of ten minute interval counts:
CPS2=100(1-R) (2.24)
The interval counts in 6 per hour are over one month for reporting purposes, and over rolling twelve month durations for compliance measure. An area fails compliance if CPS2 is less than 90%.
It should be noted that CPS2 is insensitive to ACE non-randomness or its coincidence with other ACEs. Hence, the chosen L10 values are appropriate only if the coincidence among ACEs does not significantly increase.
3.1 FUZZY CONTROLLER BASED ON CPS
Fuzzy logic rules are designed to manipulate by sugeno type inference system. The proposed control structure is shown in Fig.3. The controller uses information that reflects based with CPS1 and CPS2 as the inputs to the fuzzy logic rules. Sugeno– style inference is preferred and the typical fuzzy rule is:
If x is A and y is B then z=f(x, y)
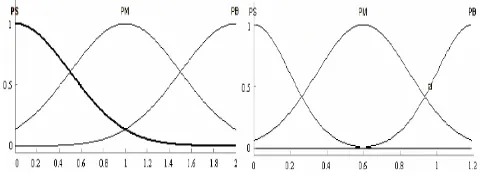
[image:4.595.319.559.378.466.2]where A and B are fuzzy sets in the antecedent and z = f(x, y) is a crisp function in the consequent. Usually, function z is a first-order or a zero-order. According to the optimized rules from the Table 1, the membership functions of CPS1, CPS2 could be defined as Fig. 3 Fuzzy rules are summarized.
Fig.3. membership functions of input variables CPS1 and CPS2
3.2 NEURAL NETWORK FUZZY
CONTROL
In the control scheme, neural network is chosen to create the real-time dynamic model of the power system. In accordance with the current controller output u(r), the tie-line power deviation dPtie(r) and the frequency deviation df(r), the neural network is used to predict the next moment’s frequency deviation df(r+1), thus calculate the ACE, the ACEN as well as CPS. The predicted CPS1 and CPS2 are used as input variables to the fuzzy controller that offers optimal controller parameters.
Elman network is a typical dynamic recurrent neural network whose feedback consists of a group of connected modules and is used to record the implicit memory. Meanwhile, the feedback, along with the network input, acts as the import to hidden units in the next moment. This nature renders recurrent neural network with dynamic memory and thus the capacity to predict future output, which is quite fitful to power system load frequency control.Fig.4 represents the Elman neural network structure in the Load Frequency Control.
controller output u(r) € R, the tie-line power deviation dPtie(r) € R and frequency deviation df(r) € R. The network output is the predicted frequency deviation for the next moment df(r+1) € R, in which r is the sampling instant. Let the hidden layer output be x (r+1) € R5, then:
X (r+1) =f (W1xc(r)+W2u(r)+W3dPtie(r)+W4df(r)) ... (2.31)
Output=df (r+1) =g (W5 x(r+1)) (2.32)
WhereW1, W2, W3, W4 are the weight matrix of connected units to the hidden units and W5 is the weight matrix of hidden units to output unit respectively.
f (•) and g (•) are the nonlinear vector function of the activation function of the hidden layer neural cell and output layer neural cell; xc (r+1) represents
the state at r+1 moment. Here, x(r+1) is the total state of the power system dynamic.
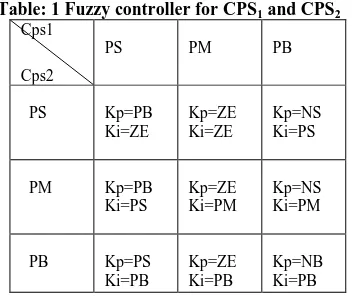
Table: 1 Fuzzy controller for CPS1 and CPS2
Cps1
Cps2
PS PM PB
PS Kp=PB
Ki=ZE
Kp=ZE Ki=ZE
Kp=NS Ki=PS
PM Kp=PB
Ki=PS
Kp=ZE Ki=PM
Kp=NS Ki=PM
PB Kp=PS
Ki=PB
Kp=ZE Ki=PB
[image:5.595.67.243.284.432.2]Kp=NB Ki=PB
Fig.4. The Elman Neural Network Structure used in The Load Frequency Control.
3c. CONTROL ALGORITHM
The proposed algorithm based on fuzzy neural network method can be summarized as follows:
(1) Set the initial values of the desired frequency deviation df(r) desired ACE(r) and desired ACEN(r) to 0;
(2) Forecast the frequency deviation df(r+1) at the (r+1) moment using recurrent neural network as shown in Fig. 1, resulting the forecasting of ACE(r+1); (3) Forecast CPS1(r+1) and CPS2(r+1) at the (r+1)
moment based on ACE(r+1) and the CPS.
4. SIMULATION RESULTS
Simulation studies were made under the condition that a step load disturbance of 0.01p.u.MW is applied to the area 1. From Fig.5 and Fig 6, the proposed method offers a much better frequency response than that the frequency response of the system with the traditional Integral control. Due to the impact of a random source, the frequency output based on the traditional fuzzy neuro control oscillates constantly with the maximum overshoots being -0.004 and 0.00066.
0 10 20 30 40 50 60
-0.04 -0.02 0 0.02
Time (s)
Ch
a
n
g
e
in
f
re
q
.in
a
re
a
1
(Hz
)
Integral controller Fuzzy-Neural controller
[image:5.595.97.475.517.649.2]0 10 20 30 40 50 60 -0.015
-0.01 -0.005 0 0.005 0.01
Time (s)
Ch
a
n
g
e
in
f
re
q
.
in
a
re
a
2
(Hz
)
Integral controller Fuzzy-Neural controller
Fig6: Frequency deviations (Hz) of area 2 in a two area interconnected thermal reheat power system-GDB including RFB with integral and neural-fuzzy controller for 1% step load disturbance in area 1
0 10 20 30 40 50 60
0 0.01 0.02 0.03
Time (s)
Co
n
tr
o
l e
ff
o
rt
in
a
re
a
1
(p
u
M
W
)
[image:6.595.98.476.79.207.2]Integral controller Fuzzy-Neural controller
Fig 7: Control effort (p.u mw) of area 1 in a two area interconnected thermal reheat power system GDB Including RFB with integral and neural-fuzzy controller for 1% step load disturbance in area 1
0 10 20 30 40 50 60
-6 -4 -2 0 2 4 6x 10
-3
Time (s)
Co
n
tr
o
l e
ff
o
rt
in
a
re
a
2
(p
u
M
W
)
[image:6.595.104.476.251.384.2]Integral controller Fuzzy-Neural controller
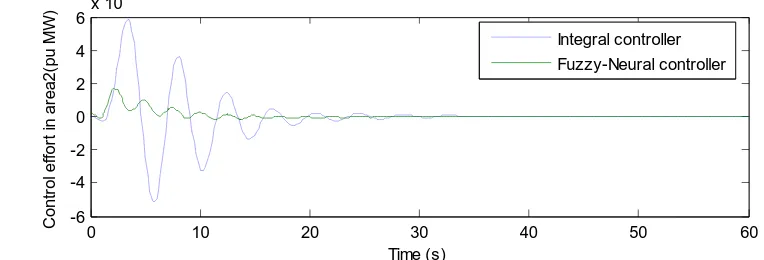
Fig 8: Control effort (p.u mw) of area 2 in a two area interconnected thermal reheat power system GDB Including RFB with integral and neural-fuzzy controller for 1% step load disturbance in area 1
0 10 20 30 40 50 60
-3 -2 -1 0 1
x 10-3
Time(s)
T
ie
L
in
e
P
o
we
r
d
e
v
ia
tio
n
(p
u
M
W
)
Integral controller Fuzzy-Neural controller
[image:6.595.95.477.417.547.2]
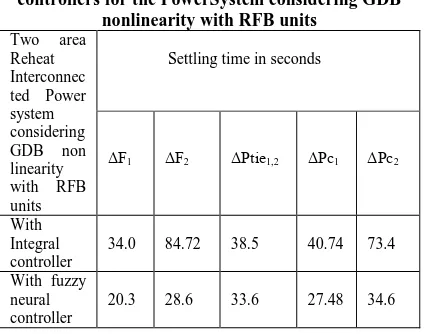
Table 2.Comparison between Integral and Fuzzy neural controllers for the PowerSystem considering GDB
nonlinearity with RFB units
Two area Reheat Interconnec ted Power system considering GDB non linearity with RFB units
Settling time in seconds
ΔF1 ΔF2 ΔPtie1,2 ΔPc1 ΔPc2
With Integral controller
34.0 84.72 38.5 40.74 73.4
With fuzzy neural controller
20.3 28.6 33.6 27.48 34.6
From Fig.7 and Fig.8, the control effort under the
NN predictive fuzzy control is much less than that of traditional control, which means wear and tear of generating unit’s equipments, is quite reduced. From Fig9, the tie line power is quickly driven to zero and have smaller overshoots using the proposed method. From Fig.5-Fig.9, the neural network prediction fuzzy control can better meet the CPS performance standards in a better way.
5. CONCLUSIONS
In this paper, hybrid fuzzy neural network is proposed to enhance the load frequency control of a two-area power system considering GDB with RFB Units. Fuzzy control strategy was chosen to comply with the NERC’s control performance standards, CPS2.
To demonstrate the effectiveness of the proposed method, the control strategy is tested under load perturbation. The simulation results show that the proposed Fuzzy neural controller has better control performance compared to the conventional integral controllers with RFB. In addition, it is effective and can ensure the stability of the overall system for all admissible uncertainties and load changes. The simulation results obtained also show that the performance of fuzzy neural controller is better than that of conventional integral controller against the load perturbation.
6. ACKNOWLEDGEMENT
The authors wish to that the authorities of Annamalai University, Annamalai nagar-608002,
Tamilnadu, India for the facilities provided to prepare this paper.
7. REFERENCES
[1] Shayeghi.H, Shayanfar.H.A, Jalili.A,”Load frequency control strategies state of the art survey for the researcher”, Energy conservation and Management. Vol 50(2); pp. 344-353, 2009.
[2] I.A.Chidambaram and S.Velusami, “Design of decentralized biased controllers for load-frequency control of interconnected power systems considering governor dead band non-linearity”, IEEE International Conference (INDICON 2005), Chennai, pp.521-525, 2005.
[3] C. S. Indulkar and Baldev Raj, “Application of fuzzy controller to automatic generation control,” Electric Machines and Power System, Vol 23 (2), pp. 209–220, 1995.
[4] Erturul Cam and Ihan Kocaarslan, “Load Frequency Control in two area power systems using fuzzy logic controller”, Energy conversion and Management Vol.46, pp.233-243, January 2005.
[5] F. Beau fays, Y. Abdel-Magid, and B. Widrow, “Application of neural networks to load frequency control in power systems,” IEEE Transaction on Neural Networks, Vol. 7, pp. 183–194, 1994
[6] Panda, Sidhartha Panda and Cemal Ardil, “Automatic Generation Control of Interconnected Power System with Generation Rate Constraints by Hybrid Neuro Fuzzy Approach”, World Academy of Science, Engineering and Technology Vol 52, pp.543-548, 2009.
[7] Y. L. Karnavas and D. P. Papadopoulos, “AGC for autonomous power system using combined intelligent techniques,” Electric Power Systems Research, Vol. 62, No: 3, pp. 225–239, 2002.
[8] M. J. Yao, R. R. Shoults and R. Kelm , “AGC Logic Based on NERC’s New Control Performance Standard and Disturbance Control Standard,” IEEE Transactions on Power Systems,, Vol. 15,No. 2, pp. 852–857,2000. [9] George Gross and Jeong Woo Lee, “Analysis of Load
Frequency Control Performance Assessment Criteria”, IEEE Transactions on Power Systems, Vol.16, No. 3, pp. 520-525, 2001.
[10]I.A.Chidambaram, R.Francis,”Automatic Generation Control of two area interconnected power system based on cps using fuzzy neural network”, IEEE conference, IEEE International Conference (ICETECT 2011), Nagarkovil, pp 200-205, 2011.
[11] Enomoto K, Sasaki T, Shigematsu T, Deguchi H,”Evaluation study about redox flow battery response and its modeling”. IEEE Transaction on Power System Engineering, Vol 122-B (4), pp. 554–560, 2002.
List of symbols:
f Frequency Kp Power system gain
Kr Reheat thermal power system gains Tr Reheat time constants
Tt Time constant of turbine Xe Governor valve position Tg Time constant of governor Pg Turbine output power R Regulation parameter
Tij Tie-line synchronizing coefficient aij Operator
Tp Power system time constant Pref The output of ACE X State vector A, B State matrices
Δfi Frequency deviation of area i (i = 1, 2) NN Neural network
Appendix
Data for the interconnected two area thermal power system [2, 10].
Rating of each area=2000 MW Base power=2000 MVA f= 60 Hz
R1=R2= 2.4 Hz/pu MW Tg1 = Tg2=0.08 sec Tr1 = Tr2=10 sec. Tt1 = Tt2=0.3 sec. Tp1 =Tp2= 20 sec
Kp1 = Kp2=120 Hz/pu MW B1=B2= 0.425 pu MW/Hz T12 = 0.545 MW/Hz ΔPd1=0.01pu MW/HZ a12 = -1.
Krfb=1.8. Kr1=kr2=0.5 N1=0.8 N2=-0.2 T=2sec
8. AUTHORS PROFILE
I.A.Chidambaram (1966) received Bachelor of Engineering in Electrical and Electronics Engineering (1987), Master of
Engineering in Power System Engineering (1992) and Ph.D in Electrical Engineering (2007) from Annamalai University, Annamalainagar. During 1988 - 1993 he was working as Lecturer in the Department of Electrical Engineering, Annamalai University and from 2007 he is working as Professor in the Department of Electrical Engineering, Annamalai University, Annamalainagar. He is a member of ISTE and ISCA. His research interests are in Power Systems, Electrical Measurements and Controls. (Electrical Measurements Laboratory, Department of Electrical Engineering, Annamalai University, Annamalainagar – 608002, Tamilnadu, India,