Automatic Classification of Collapsed Buildings using
Stereo Aerial Images
Mehdi Rezaeian
Assistant Professor, Electrical and Computer Engineering Department, Yazd University Daneshgah Blvd., Safa-ieh, Yazd, Iran;
ABSTRACT
After an earthquake, the image-based interpretation methods are powerful tools for detection and classification of damaged buildings. A method based on two kinds of image-extracted features comparing stereo pairs of aerial images before and after an earthquake is presented. Comparing pre- and post event DSMs - generated from stereo images - could be a solution for detecting the extent of demolished areas of buildings. However such DSMs are not sufficiently accurate due to image matching problems. We propose “Regularity indices” to describe the appearance of the building as regular or irregular. Regularity indices were defined by taking account of lines composition with regards to building footprint. In addition, a normalized value of average differences between DSMs (within each building polygon) is added into the classification procedures. Three kinds of classification methods: k-NN, naive Bayes and support vector machine (SVM) are used and compared. Experiments are performed on two datasets of the Kobe and Bam earthquakes including vast varieties of real collapsed buildings. The numerical results achieved for our datasets are very promising to detect and classify collapsed buildings automatically.
General Terms
Pattern Recognition
Keywords
Supervised classification, Collapse detection, Earthquake.
1.
INTRODUCTION
In the first decade of the 21st century, a large number of devastating earthquakes attacked highly populated urban areas in the world, and a huge amount of human, structural, and socioeconomic losses were reported due to the earthquakes. After an earthquake, demolished structures have to be recorded in order to generate a map of buildings damage.This can give first very valuable hints to search and rescue teams. Optical images either taken by airplane or satellite sensors were used in the last decades to detect and identify the impact and effects of natural disasters like earthquakes. Photo-interpretation analysis can be a reliable technique for earthquake damage assessment, depending on the objectives and the image resolution. Automation could be a way for eliminating the time-consuming photo interpretation, which is usually carried out by human operators manually. Using bi-temporal images (before and after the earthquake), the change detection techniques can be employed to detect “significant” changes while rejecting “insignificant” ones. However, it is necessary to define specific criteria to define how a „change‟ is translated to „damage‟. For this purpose, pictorial attributes like edges, texture or shadows can be extracted. For instance, the presence/absence of shadows in a pre/post event pair is a signal of a collapsed building [1][2][3][4]. Moreover, texture analysis can be conducted for debris detection [5][6].
Geometrical information is also an important cue. Geometrical properties of buildings can be obtained from a digital surface model (DSM), which is extracted either from stereo images or laser scan data. Stereo or multiple images give important cues to infer three-dimensional (3D) structures. Height differences to initial height, volume reduction rate, debris size, change of roof structure and inclination can be employed in order to assess building damages [7][8][9].
In this study, we assume pre- and post-earthquake aerial images together with the building polygons are available. The goal is to develop the method to generate automatically a map of damaged buildings. We propose an integrative method fusing both image and object space cues to perform more accurate collapse detection and classification.
2.
FEATURES GENERATION
2.1
Image Features - Regularity Indices
Using high-resolution images, the human interpreter looks for the remaining ruins and debris from damaged buildings. The first goal of the image classification is to be able to distinguish recent debris from other objects on the ground. The type of debris in terms of its material, shape and formation is generally complex and its reflectance characteristics can be very different in images. There is no clear definition of “debris texture” and it is often qualitatively characterized by its coarseness in the sense that a patch of rubbles is coarser than a patch of intact building roof under the same viewing condition. Nevertheless, the image descriptors, which provide measures of properties such as smoothness, coarseness and regularity, can intuitively be utilized for debris detection. Various approaches have been used to investigate the textural and spatial structural characteristics of image data for damage detection, including first and second order statistical features [10], wavelet transform [11], variograms [12], morphological descriptors and density or dissimilarity of edge pixels [13].
lines are compared with vector lines, which being already extracted from pre-event images. In order to evaluate the degree of fit of line segments to the pre-defined polygons two parameters were used: 1) the angle between segmented lines and actual polygon lines () 2) the length of segmented lines (l). To measure the degree of the match between the detected segment lines and delineated vectors of building polygons, the following formula is established for the first regularity index:
i i il
l
f
RI
1cos
(1)The function f describes the rate of fit between detected line segments and actual polygon lines. Obviously, this index represents the rate of intact lines around the building footprint. Therefore, the collapsed buildings such as “pancake” and “overturned” that shifted from initial position can be detected using this attribute.
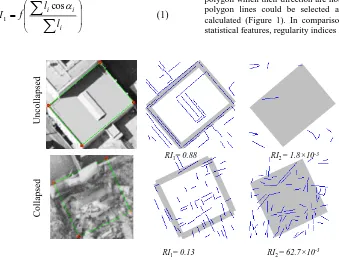
The second regularity index (RI2) is defined based on density of line segments. For this index, those lines within building polygon which their direction are not close to the direction of polygon lines could be selected and density of pixels is calculated (Figure 1). In comparison with the conventional statistical features, regularity indices show better results [10].
Uncol laps ed Coll aps ed
RI1= 0.88
RI2 = 62.7×10⁻³ RI1= 0.13
[image:2.595.111.450.171.432.2]RI2 = 1.8×10⁻³
Figure 1: Regularity indices (RI1, RI2) are computed for exterior and interior regions
2.2
DSM Feature - Normalized Height
Difference
After an earthquake, comparing geometrical data in the form of digital surface model (DSM) can be efficient approach for detecting damaged buildings. Digital photogrammetry provides a method of automatic DSM generation. However, this process has limitations in accuracy due to image matching problems. Thus, it is subject to errors from these multiple sources. Therefore, the DSM elevation of given point Pn can
be represented as a random process
n
Z
~
:n n n n
n
n
X
Y
Z
Z
e
P
:
(
,
)
~
(2)Where, Zn denotes actual elevation (deterministic value) and en denotes DSM error (stochastic process). Here, the term error implies the deviation of a measurement from its true value and is therefore implicitly associated with any DSM. Usually, both the magnitude and spatial distribution of the error at any particular location are unknown. We define a variable of difference between before and after heights:
a n b n n a n n a n a n b n b n a n b n n n n n
e
e
d
Z
P
e
Z
e
Z
Z
Z
d
Y
X
P
: then Object Unchanged if
Z
)
(
)
(
)
(
~
~
)
,
(
:
b n (3)Where,
Z
~
nb&Z
~
na denote random variables of DSMselevations, b n
Z
& a nZ
denote true elevations of Pn andb n
e
& an
e
represent DSM errors, before and after earthquake respectively. We define:
n n nd
N
d
P
within buildingpolygon
:
1
(4)The following normalized value of height difference (nhd) is defined:
0 0
N
d
nhd
(5)Here, 0 and 0 represent the sample mean and standard
3.
AUTOMATIC COLLAPSE
CLASSIFICATION
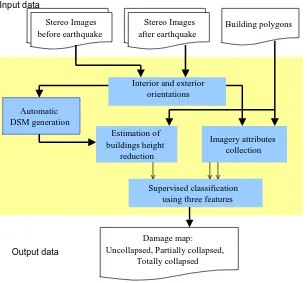
Figure 2 depicts a flowchart of operations for collapse classification using both image and object space features. The regions of interest (i.e. buildings boundary) are delineated with the aid of prismatic model of buildings. The procedures of image enhancement and orientation are performed by commercial software but feature extraction - especially line detection algorithm (Hierarchical Permissive Hough Transform) - is implemented with the customized codes [10]. We used combination codes of C++ and Matlab to implement the described procedures in Figure 2. After automatically generating the DSMs from both pre- and post-earthquake
aerial photographs, in order to obtain 0 and 0, some
[image:3.595.159.466.269.552.2]uncollapsed buildings are selected. Each building polygon encompasses several points of DSMs (before and after) and so {dn} can be calculated for uncollapsed sample buildings. The implemented program extracts all attributes including regularity indices and normalized height difference for any building polygon. The variables resulting from this procedure are calculated for a stereo set of post-event aerial images and final normalized features are generated from average values. We present an integration system for multi-level damage classification. Our study compares three classification methods (k-Nearest Neighbors, Bayesian and Support Vector Machines) for the production of collapse maps from aerial images.
Figure 2: The processing flow diagram for automatic classification of collapsed buildings using DSM and imagery features
The SVM is only directly applicable for two-class tasks. Therefore, algorithms that reduce the multi-class task to several binary problems have to be applied. Due to various complexities, a direct solution of multi-class problems using a single SVM formulation is usually avoided. The better approach is to use a combination of several SVM classifiers to solve a given multi-class problem. In particular, one technique in practice has been one-versus-all classifiers (OVA), and to choose the class which classifies the test datum with greatest margin [14]. One strategy is to build a set of one-versus-one (OVO) classifiers, and to choose the class that is selected by the most classifiers. This method leaves regions of the feature space undecided where more than one class accepts or all classes reject.
4.
EMPRICAL INVESTIGATION
4.1
Dataset Preparation
To evaluate methods and verifying numerical results, two datasets were obtained from Kobe (Japan) and Bam (Iran) earthquakes.
Kobe earthquake was a major earthquake in Japan. The earthquake happened in the early morning at on January 17, 1995 and approximately 5,000 people lost their lives.A set of aerial photographs, which were taken before (1991) and after (1995) the earthquake was prepared.It includes RGB colored stereo pairs of images before and stereo triplet of images after the earthquake.They were taken at a flight altitude 986m with an image scale of 1:6000. The pre- and post-event photographs were scanned at 30 and 20 micron, respectively (ca. 18 and 10cm of pixel size on object space).
Stereo Images after earthquake
Interior and exterior orientations
Building polygons
Automatic DSM generation
Imagery attributes collection
Supervised classification using three features
Damage map: Uncollapsed, Partially collapsed,
Totally collapsed Stereo Images
before earthquake
Estimation of buildings height
reduction
Input data
A powerful earthquake struck the ancient city of Bam in Iran on December 26, 2003. The earthquake was particularly destructive and the death toll amounted to 27,000 people and injured 30,000 residents. The National Cartographic Center (NCC) of Iran acquired pre- and post-earthquake aerial images of Bam in 1994 and 2003 (3 days after the earthquake). They were taken at a flight altitude 1600m with an image scale of 1:10000. The pre- and post-event photographs were scanned at 21-micron pixel size, giving a footprint of 21 cm on the object.
For both dataset, the calibration data of the cameras and ground control points are available and used as input information for the interior and exterior orientation procedures. Furthermore, we apply an adaptive histogram equalization technique in which histograms are generated only at a rectangular grid of points and the mappings at each pixel are generated by interpolating mappings of the four nearest grid points [15]. In addition, optical images which are taken just after an earthquake are subject to noise and haze of dust and smoke. Debris pattern generally contains high-frequency components and it is so difficult to distinguish from noise added to image, which similarly has a high spatial frequency spectrum. Since linear low-pass filtering may degrade feature generation results, the images are smoothed only with a 3by3 non-linear median filter in order to limit impulse noise effects.
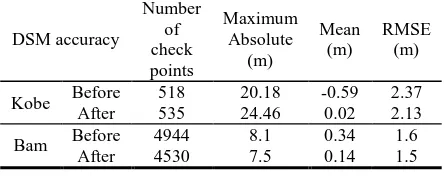
Digital surface models (DSM) are created automatically from both pre- and post-earthquake aerial images using the SAT-PP software. SAT-PP is an efficient in-house software for automatic DSM generation that is developed by Institute of Geodesy and Photogrammetry at ETH Zurich. To evaluate the DSMs, some points are manually measured which considered as three dimensional check points. The heights of these points are measured on DSMs to be assessed and compared with their corresponding heights measured manually on stereo models. The mean, max and root mean square error (RMSE) values for checkpoints in pre- and post-earthquake DSM difference are given in Table 1. Obviously, such DSMs are not sufficiently accurate because of being infected by outliers and noisy data. The geometrical accuracy relies on different parameters such as image scale and its resolution as well as the method used by the software for image matching.
A visual inspection of building damages was conducted, based on stereo pairs of aerial photos to generate reference data and for extracting prismatic model of buildings. In the Bam dataset, the problem is the nine years elapsed time between the date of pre-earthquake photo acquisition and the date of post-earthquake aerial photo acquisition. For this reason, the stereo-photos of both dates were visually crosschecked and those buildings that existed in both pre- and post-earthquake images were used in the assessments. The test regions encompass 637 and 890 houses in Kobe and Bam cities, respectively.
[image:4.595.310.533.85.173.2]Three levels of damage scale are selected for representing the distribution of individual house damages. Accordingly, the buildings are labeled as: “totally collapsed”, “partially collapsed” and “uncollapsed” by means of criteria described in [13]. The convention of the selected grades and their qualitative descriptions may be roughly correlated to human fatalities due to demolition.
Table 1: Statistics of DSM difference in checkpoints
DSM accuracy
Number of check points
Maximum Absolute
(m)
Mean (m)
RMSE (m)
Kobe Before 518 20.18 -0.59 2.37 After 535 24.46 0.02 2.13
Bam Before 4944 8.1 0.34 1.6
After 4530 7.5 0.14 1.5
4.2
Accuracy Assessment
After performing the classification, it is important to evaluate the quality of the results. The ideal process is to have an independent set of test data. The training data split into two sets: one to be used for training and the other for validation. The classification results were evaluated by a cross-validation method and by an independent visual interpretation test set. We used random sub-sampling validation technique. This method randomly splits the dataset into training and validation data. For each such split, the classifier is retained with training data and validated on the remaining data. The assessment is done based on data obtained by visual interpretation. The process is repeated for each of the subsets as validation. In this method all observations are used for both training and validation. Once a classification method is performed an error matrix (also referred to as confusion matrix) is developed. The error matrix from each split can then be averaged. This table is used to properly analyze the validity of each class as well as the classification. The following accuracy indices are generated:
The overall accuracy: it is the total number of correctly classified samples divided by total number of samples. It measures the accuracy of the whole data without any indication of the accuracy of individual categories.
The producer’s accuracy: it is the number of correctly classified samples of a specific category divided by the total number of reference sample for that class. It is an estimate of how many of buildings in each category are classified correctly. It is a measure of the omission error.
The user’s accuracy: it is the number of correctly classified samples of a specific category divided by the total number of samples being classified as that category. It means, a user might wish to know what proportion of buildings assigned to specific class were correctly assigned. It measures the commission error.
4.3
Numerical Results
quadratic programming optimization at all. To implement OVO-SVM, we used three bi-level SVMs voting for possible combinations. Buildings without majority vote have to be identified as “Unclassified” which needs to be inspected visually.
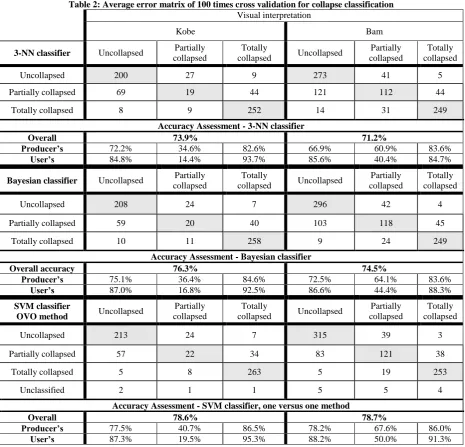
[image:5.595.66.532.148.595.2]Table 2 presents numerical results of cross-validation for applying three classifiers: 3-NN, Bayesian and one-versus-one SVM method. Sample buildings (fifteen buildings for each class) were acquired as a training set. Validations are performed 100 times each time with new training data set for obtaining average values of error matrix components.
Table 2: Average error matrix of 100 times cross validation for collapse classification
Visual interpretation
Kobe Bam
3-NN classifier Uncollapsed Partially collapsed
Totally
collapsed Uncollapsed
Partially collapsed
Totally collapsed
Uncollapsed 200 27 9 273 41 5
Partially collapsed 69 19 44 121 112 44
Totally collapsed 8 9 252 14 31 249
Accuracy Assessment - 3-NN classifier
Overall 73.9% 71.2%
Producer’s 72.2% 34.6% 82.6% 66.9% 60.9% 83.6%
User’s 84.8% 14.4% 93.7% 85.6% 40.4% 84.7%
Bayesian classifier Uncollapsed Partially collapsed
Totally
collapsed Uncollapsed
Partially collapsed
Totally collapsed
Uncollapsed 208 24 7 296 42 4
Partially collapsed 59 20 40 103 118 45
Totally collapsed 10 11 258 9 24 249
Accuracy Assessment - Bayesian classifier
Overall accuracy 76.3% 74.5%
Producer’s 75.1% 36.4% 84.6% 72.5% 64.1% 83.6%
User’s 87.0% 16.8% 92.5% 86.6% 44.4% 88.3%
SVM classifier
OVO method Uncollapsed
Partially collapsed
Totally
collapsed Uncollapsed
Partially collapsed
Totally collapsed
Uncollapsed 213 24 7 315 39 3
Partially collapsed 57 22 34 83 121 38
Totally collapsed 5 8 263 5 19 253
Unclassified 2 1 1 5 5 4
Accuracy Assessment - SVM classifier, one versus one method
Overall 78.6% 78.7%
Producer’s 77.5% 40.7% 86.5% 78.2% 67.6% 86.0%
User’s 87.3% 19.5% 95.3% 88.2% 50.0% 91.3%
4.4
Discussion
A high degree of agreement is evident between the assessment results and the reference data in the “Totally collapsed” state. Using a Bayesian classifier, of these buildings 258 were correctly labeled obtaining producer‟s and user‟s accuracy of 84.6% and 92.5% respectively in Kobe, and in Bam 249 out of 298 severely damaged buildings were correctly labeled as “Totally collapsed” resulting producer‟s and user‟s accuracy of 83.6% and 88.3%, respectively. The user‟s accuracies of “Partially collapsed” buildings were computed as 16.8% and 44.4% using a Bayesian classifier and 19.5% and 50.0% using an OVO-SVM classifier for Kobe and Bam, respectively. Since, the average value of height reduction is the dominant
feature to detect “Partially collapsed” buildings, using imprecise DSMs increases the commission errors. In other words, some uncollapsed buildings with error in their height values may be categorized as partially collapsed, which decrease the user‟s accuracy. The size of the training set has to be sufficiently large. In fact, employing large number of buildings as training data increase the accuracy as well as reliability of classifier. Our experiments revealed that for both the Kobe and Bam datasets minimum fifteen buildings per each class could be suitable for training procedure.
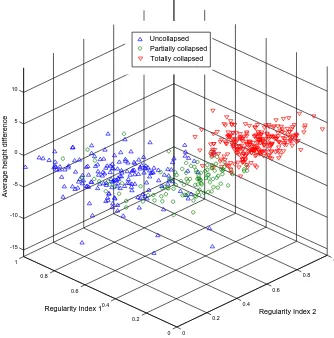
reference data. There seem to be two reasons that cause false classifications. The first and main reason is the problems in the DSM generation due to occlusions, shadows and trees. Therefore the height estimation is not of sufficient accuracy in this area and leads to an overlap between “Partially collapsed” and “Uncollapsed” in feature space (Figure 3). The second reason is the absence of the imagery features in the area where the buildings are hidden in the shadows or occluded by other objects. It should be noted that for complex shapes building borderlines couldn‟t be matched exactly with building polygon. It is therefore impossible to find line segments corresponding to the line of the building polygon. Moreover, the interpretation of damages in the Bam usually is a straight
choice; mainly either fully collapsed or partly collapsed both converted to debris heap. But in the Kobe earthquake, partly damaged buildings mainly are classified as inclined, overturned and pancake buildings. To detect these categories one needs to the more detailed and precise geometrical data. This is the reason why user‟s accuracy of “Partially collapsed” in Bam is better than Kobe (because most of the damaged buildings exhibit simple shape). However, it revealed that for both dataset less than ten buildings (about 2%) of totally collapsed category were classified as “Uncollapsed” which is quite encouraging. The results of the analysis show that using multiple features can be useful to classify damages automatically and with high success rate.
[image:6.595.142.476.236.574.2]
Figure 3: Feature space and actual distribution of labeled buildings (determined by visual interpretation for Kobe dataset)
5.
CONCLUSION
For damage classification of earthquake, we proposed integrative method using features extracted automatically. Imagery features are valuable data for detecting damaged structures, although buildings may reflect different and diverse forms of imagery features. We aimed to describe the look of building image as regular or irregular. For this purpose, first we presented two features based on composition of lines, so called “Regularity Indices” (RI1 and RI2). Regularity indices were defined taking account of lines composition with regards to building footprint. Further, the
DSMs generated automatically were employed. The regularity indices together with normalized height difference were integrated for the classification procedure. Three kinds of classification methods: k-NN, Bayesian and SVM were used and compared. The classification results were evaluated by a cross-validation method and by the independent visual interpretation test set. The results of the analysis showed that using multiple features can be useful to classify collapsed buildings automatically and with high success rate.The Kobe and Bam datasets contain vast varieties of real collapsed buildings and the results achieved for our dataset are very promising
0
0.2 0.4
0.6 0.8
1
0 0.2 0.4 0.6 0.8 1 -15 -10 -5 0 5 10
Regularity Index 2 Regularity Index 1
Av
e
ra
g
e
h
e
ig
h
t
d
if
fe
re
n
ce
Uncollapsed
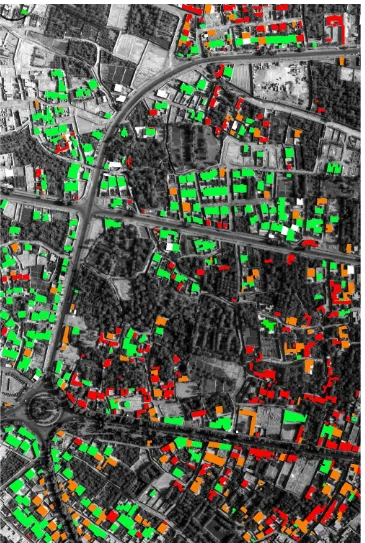
Figure 4: Study Area in Bam city, results of automatic collapse classification using OVO-SVM classifier,
Green: Uncollapsed, Orange: Partially collapsed, Red: Totally collapsed, White: Unclassified
6.
ACKNOWLEDGMENT
The provision of aerial imagery, ground control information and the digital map of Bam city by the National Cartographic Center (NCC) of Iran is gratefully acknowledged.
7.
REFERENCES
[1] Turker, M. and San, B. T., 2004. Detection of collapsed buildings caused by the 1999 Izmit, Turkey earthquake through digital analysis of post-event aerial photographs. Int. Journal of Remote Sensing, 25 (21), pp. 4701–4714.
Earthquakes from Quickbird Imagery. International archives of Photogrammetry Remote Sensing and Spatial Information Sciences, 35 (7), pp. 607-610.
[3] Turker, M., Sumer, E., 2008. Building-based Damage Detection due to Earthquake using the Watershed Segmentation of Post-event Aerial Images. International Journal of Remote Sensing, Vol.29, No.11, pp. 3073-3089.
[4] Li, P. 2011. Urban building damage detection from very high-resolution imagery by One-Class SVM and shadow information. IEEE International Geoscience and Remote Sensing Symposium (IGARSS), 1409 – 1412.
[5] Sumer, E., Turker, M., 2005. Building Damage Detection from Post-Earthquake Aerial Imagery Using Building Grey-Value and Gradient Orientation Analyses. Proceedings of 2nd International Conference on Recent Advances in Space Technologies (RAST‟05), Istanbul, Turkey, pp. 577-582.
[6] Rehor, M., Vögtle, T., 2008. Improvement of building damage detection and classification based on laser scanning data by integrating spectral information. International Archive of Photogrammetry and Remote Sensing (IAPRS), 37 (B7), pp. 1599-1605.
[7] Rehor, M. and Bähr H.-P. 2007. Detection and analysis of building damage caused by earthquakes using Laser scanning data. International Symposium on Strong Vrancea Earthquakes and Risk Mitigation, Bucharest, Romania, pp. 457-47.
[8] Rezaeian, M. and Gruen, A. 2007. Automatic classification of collapsed buildings using object and image space features. In: J. Li, S. Zlatanova and A. Fabbri (eds.), Geomatics solutions for Disaster Management. Springer, pp. 135-148.
[9] Turker, M and Cetinkaya, B. 2005. Automatic detection of earthquake damaged buildings using DEMs created from pre- and post-earthquake stereo aerial photographs. International Journal of Remote Sensing, 26(4), pp. 823– 832.
[10]Rezaeian, M. and Grün, A., 2011. Comparative study of k-NN, naive Bayes and SVM methods for building collapse detection using image features, The 32nd Asian Conference on Remote sensing (ACRS).
[11]Shirzaei, M., Mansouri, B., Shinozuka, M., 2006. Multiresolution Analysis of Satellite Optical Images for Damage Detection using Wavelet Transform. 4th International Workshop on Remote Sensing for Disaster Response, 25-26th, Cambridge, UK.
[12]Sertel, E., Kaya, S., Curran, P.J., 2007. Use of Semivariograms to identify Earthquake Damage in an Urban Area. In: IEEE Transactions on Geoscience and Remote Sensing, Vol. 45, Issue 6, pp. 1590-1594.
[13]Rezaeian, M. and Grün, A., 2011. Automatic 3D building extraction from aerial and space images for earthquake risk management. Journal of Georisk (Taylor & Francis): Assessment and Management of Risk for Engineered Systems and Geohazards, 5(1), pp 77-96.
[14]Platt, J. C., Cristianini, N., Shawe-Taylor, J. 2000. Large Margin DAGs for multiclass classification. Advances in Neural Network Information Processing Systems, 12, pp. 547-553.