BIROn - Birkbeck Institutional Research Online
Crescenzi, R. and Filippetti, Andrea and Iammarino, S. (2017) Academic
inventors:
collaboration and proximity with industry.
The Journal of
Technology Transfer 42 (4), pp. 730-762. ISSN 0892-9912.
Downloaded from:
Usage Guidelines:
Please refer to usage guidelines at
or alternatively
Academic inventors: collaboration and proximity
with industry
Riccardo Crescenzi1 •Andrea Filippetti1,2,3 •
Simona Iammarino1
The Author(s) 2017. This article is published with open access at Springerlink.com
Abstract This paper addresses a number of fundamental research questions on university–
industry (U–I) collaborations. Are U–I collaborations intrinsically different from other forms of collaboration, such as inter-firm or inter-university collaborations? Are they more difficult to form? Is their output qualitatively different? What factors facilitate their development? By looking at the collaborative behavior of all Italian inventors over the 1978–2007 period, the empirical analysis shows that U–I collaborations are less likely to happen when compared to collaborations involving exclusively university partners of business partners, and suggests that they tend to generate patents of more general applica-bility in subsequent inventions—measured by forward-citations. As emphasized by the literature, geographical proximity plays an important role in facilitating all forms of col-laboration. At the same time, it works as a possible substitute for institutional proximity, facilitating U–I collaborations. However, the involvement of ‘star inventors’ on both sides of the collaboration can play an equally important role in ‘bridging’ universities and industry.
Keywords University–industry collaborationInstitutional and geographical proximity
InnovationRegions
& Andrea Filippetti [email protected] Riccardo Crescenzi [email protected] Simona Iammarino [email protected]
1 Department of Geography and Environment, London School of Economics and Political Science,
Houghton Street, London WC2A 2AE, UK
2
National Research Council, Institute for the Study of Regionalism, Federalism and Self-Government, Via dei Taurini, 19, 00185 Rome, Italy
3
Centre for Innovation Management Research, Birkbeck College, University of London, London, UK
JEL Classification O31O32O33R10
1 Introduction
Over the past 15 years university–industry (U–I) linkages have attracted increasing attention from both scholars and policy makers. The progressive abandonment of the ‘linear model’ in favor of more sophisticated systemic and interactive approaches to the genesis of innovation has produced a shift in both analytical and policy targets. The spotlight moved from basic science, general purpose technologies and various forms of Research and Development (R&D) efforts, to the relations and linkages between a variety of agents (firms, public research centres, universities, etc.) collectively forming local,
regional, national or supra-national innovation systems (e.g. Archibugi 2001; Verspagen
2006) and contributing to regional development (Lawton Smith and Bagchi-Sen2010).
Scholars and policy makers have come to the realization that leveraging public and private investment in R&D is not necessarily leading to stronger regional or national innovation performance, unless these efforts are supported by adequate systemic conditions. However, notwithstanding the conceptual emphasis on the truly systemic multi-actor nature of the innovation process, some specific components of the ‘innovation system’ have received a disproportionate consideration: this is in fact the case of U–I linkages. Fostered by the
appeal of the ‘triple-helix’ approach (e.g. Etzkowitz et al.2000), U–I collaborations have
become amantraof innovation policies around the globe.
The strength and extent of U–I collaborations are now universally included among the key indicators to capture the innovation performance of national and regional economies (see, for example, the OECD Science and Technology Indicators or the EU Innovation Scoreboard). U–I collaborations are top priorities in the innovation policy agendas of many governments.
When the OECD presented the latest available cross-country data on U–I collaborations1in
June 2013, countries at the bottom of the ranking immediately reacted in order to make up for their weakness. For example Australia—among the top-ten OECD countries for innovation performance—ranked last (33rd) for the proportion of businesses collaborating with higher education and public research institutions. This fuelled an intense internal debate that cul-minated in March 2015 with the publication of a new innovation strategy report on ‘‘Ensuring Australia’s Future Competitiveness through University–Industry Collaboration’’ (PwC
2015). But a similar faith in U–I collaborations has also been placed by countries in the middle
(e.g. the UK, ranked 19th) and lower (e.g. Italy, 26th) positions of the OECD ranking. Out of seven key action-points summarizing the innovation policy of the UK Coalition Government between 2010 and 2015, two are about U–I collaborations (Department for Business, Inno-vation & Skills 2015). Even if Italy lacks an explicit national-level innoInno-vation strategy, a significant amount of resources have been earmarked to U–I linkages in the framework of the ‘smart specialization strategy’, supported by both national strategies and the European
Structural Funds (European Commission2012).
At both national and sub-national levels support for U–I linkages is presented as a means to achieve two objectives simultaneously: (a) facilitate technology transfer and increase technological intensity at the firm level; (b) create incentives for university research to address relevant practical problems, generating market value.
A vast scholarly literature has aimed to assess the impact of U–I collaborations on innovation, identify their drivers, and evaluate the corresponding policy tools. In this
1
context, special emphasis has been devoted to the role of geographical proximity and spatial clustering in shaping knowledge transmission between science and business. Empirical research has looked at three main channels, namely: collaborative research
projects (e.g. D’Este and Patel 2007; D’Este et al. 2013), scientific publications (e.g.
Gla¨nzel and Schubert2004; Abramo et al.2009a,b; Giunta et al.2014), and patenting (e.g.
Balconi and Laboranti2006). All these works have contributed to shed new light on the
functioning of U–I collaborations, often questioning the principles on which some of the most common policy tools rest. However, existing research has given for granted the ‘special’ nature of U–I links as opposed to other possible forms of innovative collaboration (e.g. inter-firm or inter-university collaborations). Even if the latter are also crucial com-ponents of the relational dimension of any innovation system, existing research has focused on the formation (or lack thereof) of U–I collaborations, failing to assess them against the broader set of possible cooperative links. Therefore, the literature has so far failed to provide empirical answers to fundamental conceptual questions that underlie the ongoing scholarly and policy debate in this field. Are U–I collaborations more difficult to form (and therefore deserving of special attention)? Are they more ‘valuable’ (Giuliani and Arza
2009) than other forms of collaboration? What factors make them more or less likely to
develop? Answers to these questions would provide a much needed justification for the special attention (and funding) that existing innovation policies have devoted to U–I links in a variety of countries.
This paper addresses these research questions by analyzing U–I as one of the possible forms of collaboration between inventors. All collaborations are shaped by both individual-level characteristics and preferences, and by relational factors between possible collabo-rators. Conditioned upon individual characteristics, the probability of collaboration is shaped by geographical, institutional, social or cognitive proximity between the potential team members involved. In this framework, for U–I collaborations to occur, agents have to overcome the institutional distance between the business world and academia. We con-tribute to this stream of research in two complementary ways. First, while most of the existing research has only focused on actual collaborations between universities and the business sector, we employ a novel counterfactual approach which allows us to compare actual collaborations with a suitable counterfactual of potential collaborations that could potentially happen—given the characteristics of the ‘partners’ involved—but are not actually formed. The definition of a suitable counterfactual makes it possible to identify the factors that facilitate/hamper collaboration (which is not possible by observing only actual collaborations), assessing the impact of institutional distance (university vs. business) on the probability to collaborate. Second, university–industry collaborations are here jointly studied within the broader set of possible collaborations which include also those among universities and within the business sector. This makes it possible to single out the intrinsic differential features of U–I collaborations (if any), distinguishing them from the charac-teristics of alternative forms of collaboration.
The paper is grounded into the micro-level literature on the different types of relational factors, and in particular geographical, social, or organizational proximity among inventors
(e.g. Agrawal et al.2008; Boschma and Frenken2010; D’Este et al.2013; Crescenzi et al.
2016) that shape collaborative behavior. The analysis looks at the case of Italy,
charac-terized by high heterogeneity in terms of both innovative dynamisms and attitude towards
cooperation (Crescenzi et al. 2013), and by the dominance of a ‘Personal Mode’ of
research collaboration that supposedly compensates for the limited technology transfer via
The empirical strategy is based on the comparison between actual collaborations and a control group of ‘virtual’ collaborations (i.e. teams that given their characteristics should be formed but in fact are not).
We rely on co-patenting to detect collaboration. This implies that we only observe collaborations that: i. are successful; ii. result in a patentable output; iii. are more likely to occur in science and technology based sectors. In principle, scientific publications and collaborative research projects are also good candidates to capture collaborations which involve academia; however, they would significantly downplay the role of the private sector. The use of patent data makes it possible for us to cover all types of collaboration in the same analysis (building at the same time an appropriate counterfactual sample) but it forces us to restrict the analysis to one dimension of collaborative work only.
The dataset covers all patents application filed by Italian inventors between 1978 and 2007 and identifies academic inventors by means of information provided by the Italian Ministry of Education. The results confirm that collaborations between business and academic inventors are indeed hindered by the lack of institutional proximity that instead supports inventors within inter-firm or inter-university collaborative networks. The anal-ysis also suggests that, once established, U–I collaborations lead to patents of more general applicability. Geographical proximity facilitates U–I collaborations, though the involve-ment of ‘star inventors’ on both sides of the U–I collaboration can play an equally important role in ‘bridging’ business and academia.
The nature and determinants of U–I linkages in the Italian context have been explored in a number of studies. By using network analysis in the microelectronics industry, Balconi
and Laboranti (2006) point to three main features of Italian U–I collaborations: better
scientific performance is associated with stronger ties between industry and university; cooperation relies substantially on face-to-face interaction; cross-border collaborative ties
tend to be driven by cognitive and social proximity (see also Abramo et al. 2009a, b;
Cesaroni and Piccaluga2015). Giuliani et al. (2010) carry out a similar exercise for the
wine industry, comparing the case of Italy with that of two other countries, namely Chile and South Africa. The authors find that what makes researchers central in U–I networks is informal power based on personal networks, rather than influence based on formal aca-demic position or expertise. The crucial role of acaaca-demic inventors within networks of
inventors is also a main finding of Balconi et al. (2004) who take co-patenting as a proxy of
social distance.
In general, research in this area converges on the important role played by academic inventors in research collaborative networks. Nevertheless, the role of proximity is still ambiguous, particularly with respect to the extent of complementarity versus substi-tutability among the various forms of proximity in different contexts (e.g. Bodas Freitas
et al.2013). In this growing body of literature a number of relevant aspects of U–I links in
Italy still remain underexplored. First, to the best of our knowledge, the present study is the first to take into account different types of proximity at the same time in the study of U–I relationships in Italy. Second, studies at the inventor level are still rare in this field.
Perkmann et al. (2013) conclude that‘‘individual discretion seems the main determinant of
academic engagement with industry’’(433). Bodas Freitas et al. (2013) find that half of the
academics who engage in collaboration with industry use personal contractual arrange-ments. Therefore, research based on ‘institutionalised’ forms of U–I linkages (such as joint grants or research consortia) would overlook around 50% of the whole phenomenon. At the same time, in a context such as Italy where the personal mode of U–I interaction still plays
a dominant role (Bodas Freitas et al.2013; Geuna and Rossi2013), firms tend to
applicants are very likely to be the former rather than the latter. Therefore, analyses exclusively focused on firms would overlook the significant involvement of academic scientists. Third, existing contributions have focused mainly on U–I collaborations, while this paper explores a broader sample which includes all possible forms of collaboration— between and within the two communities—making it possible to identify of the speci-ficities of U–I interactions.
The paper is organized as follows. The next section discusses the background literature on U–I linkages and the different forms of proximity. Section three explains data and empirical strategy, and provides some descriptive statistics. The results are presented in section four, whilst the concluding section offers some implications for policy.
2 Proximities and innovative collaborations in university–industry
linkages
Our analysis explores the factors that facilitate collaborative work among individuals in different working environments (business vs. academia) focusing on the role of various forms of proximity between innovators. Three forms of collaboration are analysed: i. among inventors based in private companies (I–I collaboration); ii. among inventors based in universities and public research centres (U–U collaboration); iii. between inventors based in private companies and those affiliated with universities (or public research cen-tres) (U–I collaboration). These three forms of collaboration might differ in several ways. Companies can establish one-off collaborations on a specific project or develop long-term collaborations. For example, in the Japanese automotive industry Japan, specialized sup-pliers collaborate with their leading companies on a long-term basis also on innovation activities. Purely academic collaborations are also often based on one-off projects. How-ever, long-term collaborations are also common, and personal networks and friendship can play a relevant role. It should also be noted that the greater autonomy of academic researchers—compared to workers in the private sector—allows the former a greater capacity to establish a multiplicity of collaborations and to experiment with new external collaborations. Conversely, decisions to collaborate in the business sector tend to be more structured, sometimes involving hierarchical processes and taking into account complex issues linked with industrial secrecy and competition. Finally, U–I collaborations are characterized by the relevant differences between the corresponding institutional envi-ronments. On the one hand, companies collaborate with universities to benefit from the competences of the latter in basic science and close-to-the-frontier research. On the other hand, universities have been ‘pushed’ by policy makers to establish collaborations with the industry in order to encourage technology transfer and the mobility of high-skilled human capital from public research to the private centres. To sum up, collaborations outside the boundaries of individual organisations can take different forms (short-term, long-term, project-base, etc.), can be driven by different incentives, and can impinge on different decision-making processes.
Collaborative work has to deal with two orders of problems: the identification of the most suitable partner(s) and the efficiency of the resulting team. Individual inventors (or the entrepreneurs or managers in charge of new projects/laboratories) have to identify the most suitable collaborators/team members, dealing with information asymmetries and signaling effects that increase the complexity of the search and matching process
unobserved (or hard to observe) with free-riding, procrastination, and principal-agent
problems (Bonatti and Horner2009). Therefore, the analysis of the collaborative behavior
of innovative agents has focused on the identification of individual-level (i.e. pertaining to each agent), social (i.e. linked to the socio-economic environment in which individuals are embedded) and relational (i.e. concerning the relative position of the agents in a cognitive or relational space) characteristics enabling collaboration by solving such problems
(Breschi et al.2007; Agrawal et al.2008; Muscio and Pozzali2013; Kerr and Kerr2014;
Crescenzi et al.2016). The relational factors that shape the collaboration between
inno-vators can be conceptualized by looking at five different ‘proximities’: geographic, insti-tutional, organisational, social and cognitive proximities are all likely to spur cooperative
behaviour (e.g. Boschma2005; Torre and Rallet2005; D’Este et al.2013; Crescenzi et al.
2016). The analysis of the drivers of collaboration patterns is then focused on
under-standing which proximities are most important for different actors, and how they may or may not interact/complement/substitute for each other.
In this framework, for university-based inventors to collaborate with firm-based inventors (and vice versa) it is necessary to overcome the barrier of the lack of ‘tional proximity’ that, instead, would facilitate individuals belonging to the same
institu-tional type (Kirat and Lung 1999; Hall et al. 2001, 2003). The latter refers to the
institutional conditions in which individuals operate2 and make decisions. Institutions
include both formal codes of behavior (such as laws and rules) as well as informal arrangements (e.g. habits, norms, culture). While companies and universities based in the same country share a similar national institutional framework, there are significant dif-ferences in the rules governing business and academia. For instance, workers are recruited and evaluated on the basis of completely different norms and regulations. The formal system of incentives and career progression also differs radically. In addition, actors in business and in academia show distinctive features along a number of informal institutional
dimensions such as habits, conventions, norms and culture (e.g. Merton 1973; Dasgupta
and David 1994).3 The two environments also differ in terms of the decision making
process that leads to the formation of collaborations. Academic researchers usually benefit from greater autonomy (especially senior academics). Conversely, in the business sector collaborations outside firm boundaries are part of more complex overarching strategies that are shaped by a variety of factors often (but not always) outside the direct remit of individual researchers. Different companies might balance hierarchy and horizontal deci-sion-making in different ways (see for example the case of many highly innovative companies in IT that leverage an open and highly collaborative working environment to attract the best talents). However, irrespective of the decision-making structure, all well-functioning research teams still need to (self) select appropriate team members based on a set of observable characteristics at the individual and relational level, in line with the approach of our empirical model.
Other proximities between innovative agents co-exist with the institutional dimension. The early literature on innovative collaborations has extensively focused on geographical
proximity as a key enabler for knowledge exchange and collaboration (Jaffe1989; Jaffe
et al. 1993; Mansfield and Lee 1996; Feldman 1999; Arundel and Geuna 2004;
2 These should not be confused with relations at the micro level (e.g. friendship) which in turn relate to
social proximity (Boschma2005).
3
Abramovsky et al.2007; D’Este and Iammarino2010; Feldman and Kogler2010; Laursen
et al. 2011). Spatial proximity facilitates the exchange of new complex non-codifiable
knowledge via face-to-face contacts, making communication more effective due to trust
and social engagement (Storper and Venables2004). These latter factors are clearly
rel-evant to both partner selection and the success and performance of the resulting collabo-ration. However, as highlighted by an equally vast literature (e.g. Malmberg and Maskell
2002; Howells 2002; Gertler 2003; D’Este et al. 2013), geographical proximity can be
complemented or replaced by other proximities in supporting information and knowledge sharing. The position of the actors in networks generates a social proximity that might spur collaboration and knowledge exchange across institutional and spatial boundaries (Breschi
and Lissoni 2001). Cognitive proximity—defined as common knowledge bases, similar
and complementary bodies of knowledge that allow to understand, process, and exchange
new knowledge (Nooteboom et al. 2007)—is also important to reduce the ‘‘distance
between the academic and industrial realms’’ (Balconi et al.2004, 128). Also important for
collaboration is organizational proximity: the set of relationships between and within organization ‘‘connected by a relationship of either economic or financial dependence/ interdependence (between member companies or an industrial or financial group, or within
a network)’’ (Kirat and Lung1999, 30).
Understanding the nature of U–I linkages is therefore based on the capacity to model institutional proximity after controlling for other forms of proximity and inventor-level characteristics and preferences. Conversely, in order to shed new light on the factors facilitating or hindering U–I collaborations, it is necessary to explore the complementarity or substitutability between institutional proximity and other proximities and/or inventors’ characteristics. It is true that for U–I collaborations to happen innovators have to overcome ‘institutional’ barriers, but it is also possible that other forms of proximity (or inventors’ characteristics) might ‘compensate’ for such obstacles. Shared habits and norms tend also to show dynamic reinforcement processes and co-evolution at the local level, compen-sating for University–Industry differences within the same national institutional frame-work. In addition, geographical proximity might lead to ‘better’ U–I ties—‘‘more durable
or more likely to emerge from a prolonged search’’ (D’Este et al.2013, 542)—or facilitate
local cumulative processes whereby existing U–I connections facilitate further links by means of imitation effects and institutional learning. Conversely, the disadvantages asso-ciated with initiating partnerships over geographical distance—e.g. uncertainty,
informa-tion asymmetry, lack of coordinainforma-tion, opportunism (e.g. Mora-Valentin et al. 2004;
Veugelers and Cassiman 2005) might be counterbalanced by the possibility to access
newer non-redundant knowledge that would not be available locally. While the economic geography literature has focused on the interactions between U–I linkages and geo-graphical proximity, research in the field of innovation studies has placed more emphasis on the importance of individual-level characteristics, and in particular on the prominent
role of star inventors (e.g. Azoulay et al.2008; Bercovitz and Feldman 2010;
Subrama-niana et al. 2013)– i.e. individuals with a long track-record of often highly influential
patents—who can often act as ‘bridges’ (Subramaniana et al. 2013) between different
3 Empirical strategy
3.1 Data
Patents have been extensively used as a proxy for innovation activities, despite their
well-known limitations (e.g. Archibugi1992). This paper uses the dataset KITES-PATSTAT on
Italian patents developed by Bocconi University, that includes all patents for the pre-crisis
period 1978–2007 with information on applicants and inventors (Lissoni et al.2006). The
dataset includes all information on patents (i.e. publication number, title, abstract, priority date, application year, and technological class), their applicants (i.e. name, address, city, country) and inventors (i.e. name, surname, address, city, province, region, and country). In addition, it is
possible to identify a sub-sample of 1297academic inventors(AI) by relying on information
from the Italian Ministry of Education. Information includes, for each academic inventor, academic affiliation, career status—i.e. the Italian equivalent for full, associate, and assistant professor—and scientific field of expertise. The AI database is matched with the patent database
making it possible to univocally identify all academic inventors and their patents.4
3.2 Methodology and unit of analysis
The empirical strategy follows Crescenzi et al. (2016) and models collaborations at the
individual (inventor) level, where the units of observation areinventor pairs.In order to
control for a number of personal characteristics of the individual inventors we are forced to focus our attention on the sub-sample of multi-patent inventors, therefore excluding from the analysis all inventors that have patented only once in our sample. Our sample includes all academic and business inventors for the 1987–2007 period, hence including both inventors who have collaborated (patents with at least two inventors) and inventors who have not collaborated (patents with only one inventor). This allows us to study the factors influencing the probability of collaboration avoiding the problem of self-selection which potentially affects other studies focusing only on actual collaborations. In the real economy, some employees of private companies do not patent, as well as there are academics that do not generate any patent: both these groups of non-patenting individuals are not captured by patent data. However, as far as this ‘sample selection’ affects both groups (i.e. academic and business inventors) in the same way, there is no bias in the results based on the systematic comparison between these two groups. In studying what influences collaboration between inventors, we rely on a comparison between actual pairs—pairs of inventors that have actually collaborated—and virtual pairs—pairs of inventors that could have collaborated/co-invented given their characteristics but in fact did not. The latter group forms the ‘control group’ in order to identify the differential factors that lead to actual collaborations. In other words, the ‘virtual’ pairs are collaborations that would have been possible given their char-acteristics but that did not actually occur. For all pairs (actual and virtual) we compute the ‘distance’—or proximity—between individuals in the pair along institutional, geographical, organizational and social dimensions. The model controls for individual, institutional and
4
socio-economic factors that might influence the propensity to cooperate over and above the proximities between partners. We also control for the overall size of the inventing team each couple belongs to in order to account for the overall team structure.
Three complementary dependent variables are employed in the analysis: i. a dummy variable indicating whether the pair is an actual pair (actually collaborating) or a virtual pair; ii. a continuous count of the number of collaborations per pair, proxing the perfor-mance of the actual collaborations once they are established; and iii. a citation-weighted count of the patents generated by the actual collaboration as a proxy for the
science-intensity or generality of the innovation output of the established collaborations.5
In principle, it is possible to study all possible pairs in the sample, along with the subset of actual inventor pairs. This approach poses two challenges: first, it is hard to think that an inventor active in the 1970s could collaborate with an inventor active at the end of the 2000s; second, the potential number of pairs which can be observed over different decades makes the
calculation computationally extremely intensive. We therefore follow a sampling strategy:6we
first randomly sample 10% of patents, stratified by year, 121 three-digit technology fields and
inventor team size; second, we create a set ofpossible pairs(pairs who might have co-invented
but did not) and a set ofactual pairs(pairs who actually co-invented). Increasing the number of
virtual pairs, up to several millions, would not affect the results to the extent that i. virtual pairs are generated on the basis of characteristics that make them comparable to actual pairs; ii. several robustness checks are performed to verify whether the results are robust to different sampling strategy, both in terms of choosing a different 10% sample, or by choosing a larger (e.g. 15% and 20%) sample (these robustness tests are presented in the empirical section).
We end up with an unbalanced panel of 595,983 observations, of which 38,957 (5.6%) are actual pairs.
We build a panel for the years 1987–2007, divided into two 10-year periods, 1987–1996 and 1997–2007. We use the first 10 years 1978–1986 to provide information on inventors’ patenting activity which is used to control for unobserved heterogeneity in individuals in the period 1987–1996; similarly, we use data of the period 1987–1996 to control for individual heterogeneity during the years 1997–2007.
3.3 The model
The empirical model is specified in Eq. 1 below. For inventor pairijin the 10-year periodt,
and technology fieldf,the specification is:
Yijtf ¼aþPROXbijtfþGEOcijþINVdijþINSTfijþTEAMgijþzfþktþeijtf ð1Þ
where Y is either a dummy for an actual/possible co-inventing pair (DCOINVENT), or the count of a pair’s co-invented patents (#COINVENT), or a citation weighted count (CITA-TIONS) in a given 10 year period. The variable DCOINVENT takes value 1 if the pair of inventors has patented together, and value 0 if it has not. Instead, the variable #COINVENT is a continuous variable recording the number of co-invented patents. When looking at simple patent counts as dependent variable, each co-invented patent is counted as 1 independently on
the importance and scope of the invention (Tajtenberg1990). As it is extremely relevant to
investigate whether innovations generated by U–I collaboration differ qualitatively from those coming either from a solely business-based team or from a purely academic team, we
5
For the second and third dependent variables the virtual pairs have always a value equal to 0, since they have not co-patented.
6
rely on a variable of forward citations of the patents generated by each couple (CITATIONS). Forward citations are correlated with both the technological impact and market and social
value of innovation (Tajtenberg1990; Hall et al.2005). Patents involving academic partners
are more likely to be the outcome of basic research, while patents in which only private companies are involved tend to be more ‘applied’ in nature. Leaving aside the huge
diffi-culties in distinguishing between basic and applied research (e.g. Stokes1997; OECD2002),
and taking into consideration the fact that also private companies need to perform basic
research (e.g. Rosenberg1990; Pavitt1993), university-based patents tend to be broader in
terms of underlying scientific and technological knowledge. We therefore employ a measure of forward citations which is meant to capture the basic-science intensity and the influence of
each patent on future innovations (Trajtenberg1990; OECD2009).
To sum up, our model looks first at the factors which influence the matching (DCOINVENT) and subsequently at two different measures of the performance of the collaborations that are eventually formed, i.e. the number of co-invented patents (#COINVENT) and a measure of forward citations of the patents generated by each couple (CITATIONS). Note that for the latter two specifications the dependent variables—#COINVENT and CITATIONS—range between 0 (for
the virtual pairs that have no joint patents and therefore no citations) and 1…n (for actual pairs that
can produce any number of patents from 1 to n and attract any number of citations). As a result, all these additional estimations are based on the full specification of the model and on the full sample. The potential emergence of a difference in the nature of the patents resulting from U–I collaboration with respect to those resulting from other types of collaboration, i.e. within industry or university, can add important qualitative insights in this field, as well as more tailored policy prescriptions. The development of an indicator of forward patent citations has to deal with two operational challenges. First, older patents are—ceteris paribus—auto-matically more cited than newer ones, thus making it necessary to include a control for the priority date of the patent and year dummies for temporal effects. Second, patent citations
tend to differ across technological classes (Hall et al.2005). Forward citations are therefore
normalized looking at the share of citations within each patent’s technological class (based on a thirty-sector classification): our dependent variable is the share of forward citations within the technological class of the patent generated by each pair of inventors (2-digit International patent classification IPC). Finally, when looking at this indicator our controls include the type of organization in which inventors work: since virtual pairs do not necessarily share the same patent, this step of the analysis is based on actual pairs only (with no random sampling).
The independent variables are defined as follows:
Proximities(PROX)—The vector PROX includes the key variables of
interest—insti-tutional and geographical proximity—and controls for other relevant forms of proximities between the inventors.
Institutional Proximity: a dummy variable taking value 1 if inventors in a pair belong to the same type of institution, i.e. both work either in a university or in the private sector (i.e. business firm); the dummy takes value 0 when one of the inventors is based in a
company and the other in a university. The latter case identifies U–I linkages.7
7
In order to capture the capability of ‘star inventors’ to bridge (or not) institutional distance, a set of three additional dummy variables is built, taking value 1 if: i. there is at least one star inventor in the pair; ii. there is at least one academic star inventor in the pair; iii. there is a least one business star inventor in the pair. An inventor is a ‘star’— therefore the variable takes a value of 1—if she invented a number of patents above 75% (third quartile) of the entire distribution of patents. The time frame used to compute the total number of patents is the total time coverage of our database. The accumulation of a significant number of patents over the life-time of some inventors is a signal for their patenting experience, inherent quality and inventive productivity that can make them more ‘interesting’ counterparts for joint projects.
Geographical Proximity: the inverse of the linear physical distance expressed in
kilometers between two inventors measured in logarithm and based on their residential addresses. The distance is calculated on the base of the province of residence of the inventor. Italy is divided into 110 provinces.
We also control for the following proximities:
Organisational Proximity:this dummy variable is a proxy for the likely embeddedness
of the inventors’ couple into the same organization8and takes value 1 if both inventors
work in the same company or in the same university, research center, or other types of organization.
Social Proximity/Position in co-invention network:a set of dummies is included in the
model, taking value 1 if: i. inventors’ pair co-invented in the previous period; ii. inventors’ pair has worked for the same organization in the previous period; iii. inventors’ pair shared a co-inventor in the previous period (i.e. the current collaboration is the closure of a triad).
In addition, in order to single out the role of various proximities and their interactions, a number of other inventor characteristics that might influence collaboration choices are included:
Geographical Factors (GEO)—The vector GEO takes into account the place of
resi-dence (i.e. macroregion) of inventors, i.e. whether they live in the North, Center, or South of Italy. The vector also includes a dummy variable that considers whether at least one of the inventors lives in a large city with major universities (i.e. Milan, Rome, Turin, Naples).
Inventor characteristics (INV)—The vector INV takes into account the patenting
behavior of each inventor in the previous 10-year period. Two sets of dummy variables are
included in the equation and equal 1 when:i.the inventor patented in the previous period;
ii.the inventor patented always alone, always in team, or both ways.
Institutional Factors (INST)—The vector INST provides information on the type of
organization (firm, university, other) behind the inventor. A set of dummy variables is included in order to identify whether the inventor works in a private business firm, a university or a public research center, or a foundation/NGO/consortium, and whether the inventor works in a foreign company. This information is based on the applicant of the patent.
Team Factors(TEAM)—Since our unit of analysis is the couple, two different
situa-tions can occur. A co-invented patent can include only the two inventors of the couple, or it can include more than two inventors. In this latter case the inventors in a couple are part of
8
a larger team. A dummy variable that takes into account if the pair is part of a large team
has been therefore also added to the model.9
Finally, patent technological classes (z) (2-digits) and year dummies (k) are included in
the estimates. Appendix1reports all the variables included in the model.
3.4 Descriptive statistics
Figure1 plots the share of co-invented patents on the total over the entire period of
analysis, showing how collaborative invention has progressively become the norm among
Italian inventors (in line with the general trend worldwide—see Lee and Bozeman2005;
Jones et al. 2008). Figure2shows the percentage of inventors: i. who have always
co-invented with others over their entire career (team); ii. who have always co-invented on their own (solo); iii. who have both invented in team and on their own (mix). The share of inventors always co-inventing rises over time from 60 per cent up to about 70 per cent of the total, whilst that of solo inventors declines from 40 per cent to less than 30 per cent. The proportion of ‘mix behavior’ inventors remains low and stable over time. Overall, this suggests that inventors’ preferences in terms of collaboration choices tend to remain rel-atively stable over their life-time, with team-invention progressively becoming the norm for younger generations.
As discussed in the previous paragraph, one of the key strengths of our dataset is the
possibility to clearly identify academic inventors.10 Figure3 shows the share of
co-in-vented patents on the total by macro-region, confirming the general strength of the Italian northern regional system of innovation, where collaborative linkages and innovation net-works are far more entrenched than in the rest of the country, and particularly in the South.
This picture is broadly confirmed in Fig.4—which reports the share of academic patents
by macro-region. However, here the weight of the central regions is much more prominent, due to the major role played by the capital region, Lazio, and Rome as location of universities, public and private research institutes, and large (often foreign-owned)
science-based firms (Iammarino2005).
The propensity of academic inventors to collaborate is highly heterogeneous across
scientific disciplines.11 In ‘basic science’ disciplines (e.g. Urology, Neuropsychiatry or
Pediatric surgery) patents tend to include only academic inventors. On the contrary, in ‘applied’ academic disciplines (e.g. Chemistry and Engineering) academics patent more with inventors from the business sector Also, it should be considered that research in medical disciplines (and related fields) is often pursued in public academic hospital, while other disciplines (such as chemistry or engineering) are more common among academic departments.
When looking at our full sample of 595,983 collaboration pairs, 79.3% are collabora-tions (pairs) between inventors both based in a private firm (firm–firm collaboration), 1.67% are collaborations involving exclusively university partners (uni–uni
collabora-tions) and 19% are collaborations between academic and firm-based inventors (uni-firm
9 Note that this variable is not included in the model with the first dependent variable (actual versus virtual
pair) since it would predict exactly the actual pairs.
10 Although ‘academic patents’ can have multiple inventors from different types of organisations, the
definition refers to patents in which there is at least one inventor based in a university.
11
collaborations). Out of the 38,957 actual pairs, 95.11% are firm–firm collaborations,
0.63% areuni–uni collaborations,and 4.26% areuni-firm collaborations.Among all the
pairs, 3.87% include an academic star, of which 1.5% are actual pairs.
In terms of the job title of the academic inventors, in the whole sample 57.37% are full professors, 25.29% associate professors, and 17.34% assistant professors. By looking at the overall actual pairs, a rise in the share of full and assistant professors clearly emerges,
.6
.65
.7
.75
Share %
1980 1990 2000 2010
priority year
Fig. 1 Share of co-invented patents on total patents, 1978–2007
0
.2
.4
.6
.8
% inventors
1978 1983 1988 1993 1998 2003 2008
priority year
Solo Mix Team
Inventor behaviour 1978-2007
[image:14.439.51.390.56.285.2] [image:14.439.48.395.289.513.2]associated to a decline of associate professors. This is also reflected by looking at the actual pairs between an academic inventor and a firm inventor—i.e. U–I linkages—whereas full professors play a greater role in establishing collaborations with the business sector.
When considering inventor-level data, academic patenting is a relevant practice in Italy.
In a study comparing Italy, Sweden and France, Lissoni et al. (2008) show that: i. in the
three countries academic patenting has been increasing since 1978; ii. over 60% of aca-demic patent applications in France are owned by business companies, which account also for almost 74% of Italian academic patents and 82% of Swedish ones (interestingly this same figure drops to 24% in the US); iii. French, Italian, and Swedish academic patents are respectively around 3, 4 and 6%.
North Centre
South
Fig. 3 Share of co-invented
patents by macro-regions in 1978–2008
North Centre
South
Fig. 4 Share of academic
[image:15.439.218.397.56.485.2]4 Results
4.1 Types of proximity and types of collaboration
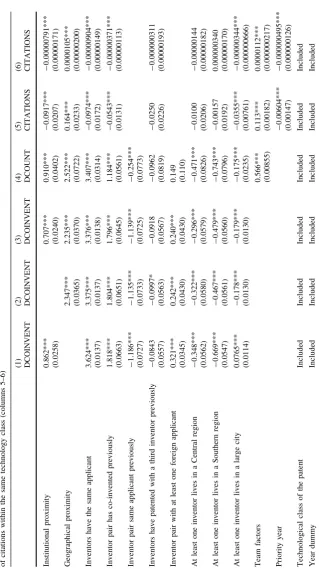
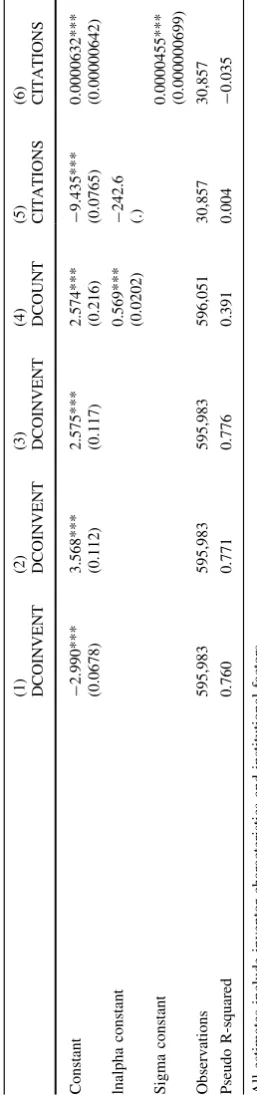
Table1 includes the key results for the estimation of Eq. 1 for the 1987–2007 period.
Columns 1 to 3 show the results with respect to the probability of collaboration
(DCOINVENT) and are based on probit estimates12; column 4 reports the findings for the
count of each pair’s co-invented patents (#COINVENT) on the basis of negative binomial
estimates13; columns 5 and 6 present results for the citation-weighted patent count
(CITATIONS), using negative binomial and Tobit estimates respectively.14
Column 1 shows the baseline results for the key variable of interest: institutional proximity. The positive and highly significant coefficient suggests that institutional proximity—i.e. belonging to the same type of institution, either academia or business— facilitates collaboration among inventors. This implies that—ceteris paribus—University– Industry collaborations are more ‘difficult’ and less likely to occur than the other forms of collaboration.
In principle, since in U–I collaborations are less affected by competitive behaviors between the partners involved in innovative projects, the reliance on secrecy should be diminished and collaboration fostered. Our results can depend on the presence of different sets of incentives, norms and practices regulating activities and acting as barriers to col-laborative behavior. For instance, private firms might find it difficult to anticipate the potential commercial application of academic research, with associated high search costs for the identification of the best possible partner(s) in a new project. Symmetrically, academics may find it easier to collaborate with other academics whose ‘quality’ is clearly assessable on the basis of common indicators (e.g. publications or academic reputation).
All other coefficients in the model behave as expected: organizational proximity (i.e. being affiliated with the same university or the same company) facilitates collaboration. The position in the social network of inventors is also important for collaboration: having co-invented in the previous period has a positive association with current collaborations, while having worked for the same organization seems—ceteris paribus—to discourage inventive cooperation. If inventors are part of the same organization and do not collaborate it is very unlikely that they will collaborate on future occasions once they leave this organization. Having had a co-inventor in common in the past (i.e. closing a triad with a new collaboration) does not affect the probability of collaboration: in other words, the
12
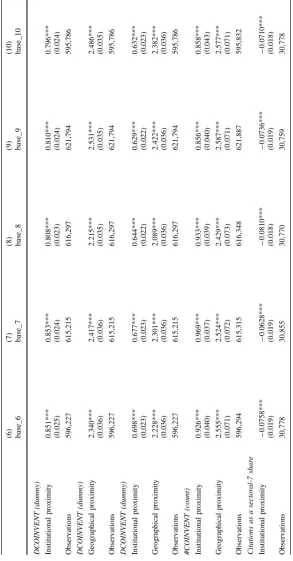
All estimates presented have been computed also by using OLS yielding similar results (see Appendix2). Note also that introducing the control variables one group at a time does not affect the results. We therefore report only the results with all controls, while the main regressors are included in a stepwise way. In order to test the robustness of the results in terms of our sampling strategy we have performed the following further estimations: i. the same models have been re-estimated using ten new different random samples at 10%, one new sample at 15% and one new sample at 20%; ii. the same models have also been re-estimated on a sample at 10% in which the only criterion for building the virtual pairs was the time frame. The results based on the ten samples at 10% are reported in Appendix3. As expected other results are qualitatively unchanged and therefore they are not reported in the paper but available upon request.
13
Since the dependent variable in this case is a count variable, it would be possible to rely on either Poisson or negative binomial estimates. After tested the goodness for both, we opted for the negative binomial model with robust standard errors. Instead, we ruled out zero inflated types of modes since in principle all inventors can form a couple, i.e. decide to collaborate. Also in the case of the negative binomial estimates results are robust to using an OLS specification with robust standard errors.
14
Table
1
continu
ed
(1
)
(2)
(3)
(4)
(5)
(6)
D
COINVENT
DCOINVENT
DCOINV
ENT
DCOUN
T
CITATIONS
CITATIO
NS
Const
ant
-2.99
0***
(0.067
8)
3.56
8***
(0.112
)
2.57
5***
(0.117
)
2.57
4***
(0
.216)
-9.435***
(0.076
5)
0.000063
2***
(0.000
00642)
lnalpha
co
nstant
0.56
9***
(0
.0202)
-242.6
(.)
Sigm
a
consta
nt
0.000045
5***
(0.000
000699)
Obser
vations
595,983
595,
983
595,
983
596,
051
30,8
57
30,857
Pseu
do
R-squar
ed
0.760
0.77
1
0.77
6
0.39
1
0.00
4
-0.03
5
All
estim
ates
include
inv
entor
characteristics
and
ins
titutional
factor
s
*
p
\
0.10;
**
p
\
0.05
;
***
p
\
[image:18.439.56.185.66.615.2]degrees of separation between two inventors in the co-invention network do not exert a statistically significant influence on new collaborations. The geographical macro-regional dummies confirm the well-known dualism of the Italian innovation system, with the South of Italy, and to a lesser extent the Centre, suffering from less collaborations among inventors than the North (reference category for the dummy variables). The location of inventors in major urban areas increases the probability of collaboration.
In column 2 the focus of the analysis shifts to the role of geographical proximity between inventors: the positive and highly significant coefficient suggests that—ceteris paribus—geographical proximity facilitates innovative collaboration, in line with the existing evidence from the geography of innovation literature. Column 3 reports results when both institutional and geographical proximity are included together in the model, with no relevant changes in their coefficients’ size and significance: both proximities play a relevant role in shaping collaborations.
Column 4 looks at the ‘performance’ of inventive partnerships, counting the number of patents produced by actual collaborations. Even after introducing an additional control for the overall structure of the patenting team, the same factors that facilitate collaborations also influence performance. The lack of institutional proximity that characterizes U–I linkages reduces the number of patents produced by these collaborations, once they are formed.
Therefore, University–Industry collaborations are both more difficult to establish and quantitatively less productive than other forms of cooperation among inventors. However, columns 5 and 6 suggest that, when it comes to the forward-citations attracted by the patents generated by inventors’ collaborations, institutional proximity has a negative influence. Collaborations involving exclusively either academics or firm-based inventors attract less forward citations than University–Industry collaborations. Therefore, once established, the latter links tend to produce qualitatively different patents that, because of science-intensity and degree of generality tend to find application in a larger number of subsequent innovations. Geographical proximity still exerts a positive influence on cita-tions suggesting that face-to-face contacts are also supportive of patents’ capacity to influence subsequent innovative projects. However, belonging to the same organization has the opposite effect, as well as (although with at a lower significance level) having col-laborated on a previous occasion: these findings might be interpreted in the light of a higher propensity of collaborations within-organization and/or repeated over time to bring about cognitive lock-in, therefore having a weaker impact on future discoveries.
4.2 How proximities complement or replace each other
In order to explore the degree of complementarity (or substitutability) among the various
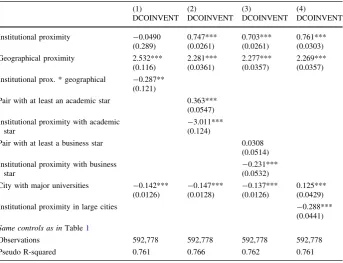
forms of proximity here considered, in Table2a number of interaction terms are included
into the model to estimate the probability of collaboration. In columns 1 and 2 we explore the interaction between institutional proximity and geographical space, while in columns 3 and 4 we look at the interaction between the former and various measures of inventors’ quality and reputation as potential ‘bridges’ between university and industry. For
robust-ness checks see Footnote 12 and Appendix4.
facilitating the matching process beyond institutional barriers. It should also be noted that when it comes to geographical proximity companies might be more reluctant to collaborate with each other due to stronger competition in the same local market. This would also depend on the nature of inter-firm relationships. Firms collaborating along the value chain (vertical types of collaboration) exhibit more intense collaborations when they are co-located, as in the case of the industrial districts in the North-East of Italy. By contrast, horizontal types of collaborations—occurring between firms operating at the same value chain stage—might be discouraged by geographical proximity due to higher
substi-tutability and the interaction between up-stream and down-stream competition.15In
col-umn 2 we also consider micro-geographic proximity—i.e. the inventors are located in the same major city—which per se does not influence the probability of collaboration, even if it does interact negatively with institutional proximity. This may indicate that it is easier to bridge the institutional gap in large urban agglomerations (e.g. Iammarino and McCann
2006), where the higher diversity of cognitive and skill bases makes it easier to identify the
‘right’ complementarities, irrespective of the affiliation of the individual inventors. Overall, this evidence seems to support the importance of geographical proximity for the formation of U–I collaborations. However, in line with some recent empirical literature
[image:20.439.49.393.70.333.2](e.g. D’Este et al. 2013), the second set of interaction terms suggests that other factors
Table 2 Results—dependent variable: dummy variable: co-invented patent dummy
(1) (2) (3) (4)
DCOINVENT DCOINVENT DCOINVENT DCOINVENT
Institutional proximity -0.0490 (0.289)
0.747*** (0.0261)
0.703*** (0.0261)
0.761*** (0.0303) Geographical proximity 2.532***
(0.116)
2.281*** (0.0361)
2.277*** (0.0357)
2.269*** (0.0357) Institutional prox. * geographical -0.287**
(0.121)
Pair with at least an academic star 0.363*** (0.0547) Institutional proximity with academic
star
-3.011*** (0.124)
Pair with at least a business star 0.0308 (0.0514) Institutional proximity with business
star
-0.231*** (0.0532) City with major universities -0.142***
(0.0126)
-0.147*** (0.0128)
-0.137*** (0.0126)
0.125*** (0.0429) Institutional proximity in large cities -0.288***
(0.0441)
Same controls as inTable1
Observations 592,778 592,778 592,778 592,778 Pseudo R-squared 0.761 0.766 0.762 0.761 *p\0.10; **p\0.05; ***p\0.01
15
might facilitate the identification of the relevant collaborators: in particular, the reputation and experience of the individual inventors. Column 3 shows that the presence of an academic ‘star’ (i.e. an academic inventor with a substantial patenting track-record) facilitates collaboration in general, but it can also compensate for the lack of institutional proximity (negative and significant coefficient of the interaction term). Column 4 shows symmetric results for ‘business star inventors’: the latter have a direct positive effect on the probability of collaboration, and a substitution effect with institutional proximity. Star inventors—thanks to their reputation and patenting history—are easier to trust for coun-terparts belonging to different communities (business world vs. academia) and are also more effective in signaling the nature and commercial applicability of their knowledge/ research/innovative activities, facilitating matching. This is true for both academic and business stars, suggesting that ultimately what matters for University–Industry collabora-tion is the possibility to efficiently deal with informacollabora-tion asymmetries and uncertainty at both ends of the partnership. Geographical proximity is only one possible means to address this information problem in collaborators’ matching. Scientists with the capability to translate their research into patentable ideas—signaling relevance and applicability of their innovative activities—can pursue an equally important function.
4.3 Proximity and collaboration for single inventors
In this final section we look at proximity and collaboration for the sample of single inventors. The latter are defined as inventors that patent only once over the period of analysis. The major drawback of this extension is that, while we can cover the behavior of ‘occasional inventors’, we cannot observe the ‘historical’ behavior of these individuals (since we only observe them once in the data). However, this analysis can still provide interesting insights for policy makers that might differ from those for multiple inventors.
Table3reports the results of the baseline model in line with those reported in Table1.
All specifications mirror those reported above for multiple inventors. Also in this case U–I linkages are harder to establish than collaborations that only involve either private com-panies or universities alone. Geographical proximity increases the likelihood of collabo-ration also in the case of single inventors. However, when analyzing at the number of citations of the corresponding patents, the results are no longer statistically significant (columns 5 and 6). In the case of single inventors, U–I collaborations do not seem to lead to qualitatively different patents in terms of citations. This can be interpreted into two ways. First, it could depend on the fact that only stable relationships between universities and private companies lead to more ground-breaking forms of innovation; second, occasional inventors may be regarded as qualitatively different from multiple inventors.
Table4reports the estimates for the interaction terms for single inventors. In this case
the only key difference concerns the role of spatial proximity as a mediating factor for U–I collaboration (column 1). In this case the coefficient is not statistically significant, although cities still encourage U–I collaborations.
5 Conclusion
geographical proximity and other relevant collaboration drivers. The results suggest that U–I collaborations are less likely to happen when compared to other cooperative links: institutional differences between business and academia hinder the signaling process necessary for an effective search and match of potential collaborators. However, once U–I collaborations are established they tend to generate patents of more general applicability in technological terms, i.e. more likely to form the basis for subsequent technological applications, although this result does not hold for single inventors. Geographical prox-imity plays an important role in facilitating all forms of collaboration (again with the exception of single inventors). At the same time, it works as a possible substitute for institutional proximity, facilitating U–I collaborations. The reputation and patenting cur-ricula of the inventors on both sides of the partnership is also a relevant ‘bridge’ between universities and industries.
The paper is innovative in a number of respects. The analysis has looked simultaneously at all possible types of inventive collaborations, identifying the specificities of U–I rela-tionships against a broad relational spectrum. Our approach has made it possible to shed new light on the rationale for the special attention devoted to U–I links in both scholarly and policy work.
[image:23.439.50.393.78.343.2]The broader conceptual and empirical perspective offered by this approach is not free from limitations. First, by looking at patents we only observe collaborations that: (a) are successful (i.e. lead to an output); (b) result in a patentable output (while successful collaborations may well lead to non-patentable forms of innovation). Second, the lack of an
Table 4 Results forsingle inventors sample—dependent variable: dummy variable: co-invented patent
dummy
(1) (2) (3) (4)
DCOINVENT DCOINVENT DCOINVENT DCOINVENT
Institutional proximity -0.149 (0.478)
0.581*** (0.0424)
0.598*** (0.0429)
0.658*** (0.0459) Geographical proximity 2.525***
(0.193)
2.300*** (0.0573)
2.313*** (0.0569)
2.299*** (0.0567) Institutional prox. * geographical -0.262
(0.198)
Pair with at least an academic star 0.273*** (0.0876) Institutional proximity with academic
star
-2.937*** (0.273)
Pair with at least a business star -0.0774 (0.0864) Institutional proximity with business
star
-0.489*** (0.0906) City with major universities -0.223***
(0.0208)
-0.230*** (0.0211)
-0.208*** (0.0210)
0.211*** (0.0740) Institutional proximity in large cities -0.475***
(0.0761)
Same controls as inTable1
exogenous variation in the proximity relations among inventors makes it difficult to interpret our results in terms of causality. Third, our analysis cannot distinguish between alternative channels of collaboration (informal collaborations, collaborative research grants and projects, joint-ventures, consultancy projects, etc.). It is possible that these alternative channels are more commonly used for U–I collaborations rather than for collaborations involving only universities or private businesses. This would lead us to underestimate the actual incidence of U–I links, with a downward bias of the estimated coefficients that should be interpreted as lower-bound estimates. Given that systematic information on other channels of collaboration is very difficult to collect for an equally long time-span and for a similar geographical coverage, these lower-bound are still highly relevant to shed light on this under-analysed phenomenom. In addition, patents make it possible to compare homogenous forms of collaboration in a highly standardised (and internationally compa-rable) manner, making it possible to place the case of Italy in a broader context.
Having acknowledged these limitations, our results offer relevant material for reflection on the best targets for innovation policies. As discussed in the introduction, governments around the world are devoting an increasing share of resources to the support of U–I links. Very often these policies have been implemented in the context of actions aimed at reinforcing the innovative performance of clusters, or have resulted in the development of physical infrastructure (or subsidies for office/laboratory space) in order to foster spatial proximity between universities and private firms. Our results confirm the ‘special’ nature of U–I collaborations: they do face more difficulties/barriers than other collaborations, providing a rationale for policies that try to minimize such barriers.
However, our results also suggest a number of relevant caveats. First, forms of support for U–I linkages are only justified when trying to foster more ‘general purpose’ innovations. In innovation systems where imitation and absorption are the norm (e.g. in less advanced countries and regions) this type of inventions might not necessarily be realistic targets for local innovative actors. Second, geographical proximity is not the only (and not necessarily the most cost-effective) way to facilitate U–I collaborations. While spatial proximity cer-tainly facilitates collaborations, other mechanisms might produce equally beneficial effects with less ambiguous side-effects. Particularly in less developed regions, improvements in the quality of local universities and the simultaneous reinforcement of technological capa-bilities of private firms are key to foster innovation linkages and networks in a systemic fashion. Third, policy makers always have the option to focus their attention on the framework conditions that facilitate all possible forms of collaborations, allowing individual agents to choose the most suitable business or university partners depending on their par-ticular technological needs and on the conditions of their markets of reference.
Acknowledgements This research has been supported by the Marie Curie Intra-European Fellowship
project FP7-PEOPLE-2011-IEF-298167-REGIO_SPIN, under the EC Grant Agreement No: PIEF-GA-2011-298167. We also acknowledge support from the project on ‘‘Industry and University linkages’’ funded by Roma Tre University (Italy). The authors would like to thank Francesco Lissoni, and the participants in the research seminar at the Group of Theoretical and Applied Research in Economics (GREThA) of the University of Bordeaux, May 2014; in the Workshop on University–Industry Linkages at the Department of Economics of Roma Tre University, May 2014; and in the NARSC Conference 2014 in Washington. The authors are solely responsible for any errors contained in the article.
Open Access This article is distributed under the terms of the Creative Commons Attribution 4.0
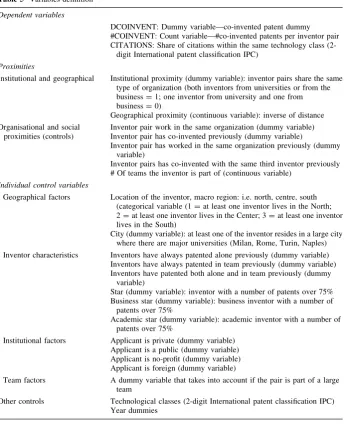
Appendix 1: List of variables
[image:25.439.49.394.139.564.2]See Table5.
Table 5 Variables definition
Dependent variables
DCOINVENT: Dummy variable—co-invented patent dummy #COINVENT: Count variable—#co-invented patents per inventor pair CITATIONS: Share of citations within the same technology class
(2-digit International patent classification IPC)
Proximities
Institutional and geographical Institutional proximity (dummy variable): inventor pairs share the same type of organization (both inventors from universities or from the business=1; one inventor from university and one from business=0)
Geographical proximity (continuous variable): inverse of distance Organisational and social
proximities (controls)
Inventor pair work in the same organization (dummy variable) Inventor pair has co-invented previously (dummy variable)
Inventor pair has worked in the same organization previously (dummy variable)
Inventor pairs has co-invented with the same third inventor previously # Of teams the inventor is part of (continuous variable)
Individual control variables
Geographical factors Location of the inventor, macro region: i.e. north, centre, south (categorical variable (1=at least one inventor lives in the North; 2=at least one inventor lives in the Center; 3=at least one inventor lives in the South)
City (dummy variable): at least one of the inventor resides in a large city where there are major universities (Milan, Rome, Turin, Naples) Inventor characteristics Inventors have always patented alone previously (dummy variable)
Inventors have always patented in team previously (dummy variable) Inventors have patented both alone and in team previously (dummy
variable)
Star (dummy variable): inventor with a number of patents over 75% Business star (dummy variable): business inventor with a number of
patents over 75%
Academic star (dummy variable): academic inventor with a number of patents over 75%
Institutional factors Applicant is private (dummy variable) Applicant is a public (dummy variable) Applicant is no-profit (dummy variable) Applicant is foreign (dummy variable)
Team factors A dummy variable that takes into account if the pair is part of a large team
Appendix 2: Robustness checks
See Table6.
Appendix 3
See Table7.
Table 6 Robustness checks: same estimates as for Table1with OLS
(1) (2) (3) (4) (5)
DCOINVENT DCOINVENT DCOINVENT #COINVENT CITATIONS
Institutional proximity 0.0157*** (0.000413) 0.0122*** (0.000402) 0.0513*** (0.00229) -0.00000326*** (0.00000111) Geographical proximity 0.151*** (0.00209) 0.149*** (0.00208) 0.371*** (0.0140) 0.00000954*** (0.00000120) Inventors have the
same applicant 0.702*** (0.00221) 0.678*** (0.00227) 0.677*** (0.00227) 1.577*** (0.0215) -0.00000531*** (0.000000955) Inventor pair has
co-invented previously 0.278*** (0.00405) 0.273*** (0.00399) 0.272*** (0.00398) 3.744*** (0.104) -0.00000296*** (0.000000620)
Inventor pair same applicant previously -0.210*** (0.0112) -0.204*** (0.0111) -0.203*** (0.0110) 1.090*** (0.219) Inventors have patented with a third inventor previously -0.0491*** (0.0103) -0.0507*** (0.0102) -0.0505*** (0.0102) -4.396*** (0.195) -0.00000215* (0.00000118)
Inventor pair with at least one foreign applicant 0.0106*** (0.00112) 0.00976*** (0.00109) 0.00954*** (0.00109) 0.0152 (0.0100)
At least one inventor lives in a Central region -0.0254*** (0.00599) -0.0252*** (0.00587) -0.0249*** (0.00587) -0.239*** (0.0494) -0.000000737 (0.00000109)
At least one inventor lives in a Southern region -0.0399*** (0.00598) -0.0363*** (0.00585) -0.0370*** (0.00585) -0.292*** (0.0488) 0.000000144 (0.00000102)
At least one inventor lives in a large city
0.00363*** (0.000366) -0.00563*** (0.000359) -0.00567*** (0.000359) -0.0209*** (0.00265) -0.00000184*** (0.000000397)
Team factors 0.710***
(0.00700)
0.00000617*** (0.000000116)
Priority year -0.000000311***
(7.62e-08) Same controls as in
Table1
Included Included Included Included Included
[image:26.439.47.392.120.547.2]Table
7
continu
ed
(6
)
base_6
(7) base_7 (8) base_8
(9) base
_9
(10) base
_10
DCOINVENT
(dummy)
Institutional
proximity
0.851*** (0.025) 0.853*** (0.024) 0.808*** (0.023) 0.810*** (0.024) 0.796*** (0.024)
Observations
596,227
615,215
616,297
621,794
595,786
DCOINVENT
(dummy)
Geographical
proximity
2.340*** (0.036) 2.417*** (0.036) 2.215*** (0.035) 2.531*** (0.035) 2.486*** (0.035)
Observations
596,227
615,215
616,297
621,794
595,786
DCOINVENT
(dummy)
Institutional
proximity
0.698*** (0.023) 0.677*** (0.023) 0.644*** (0.022) 0.629*** (0.022) 0.632*** (0.023)
Geographical
proximity
2.228*** (0.036) 2.301*** (0.036) 2.089*** (0.036) 2.422*** (0.036) 2.382*** (0.036)
Observations
596,227
615,215
616,297
621,794
595,786
#COINVENT
(count)
Institutional
proximity
0.926*** (0.040) 0.969*** (0.037) 0.933*** (0.039) 0.856*** (0.040) 0.858*** (0.043)
Geographical
proximity
2.555*** (0.071) 2.524*** (0.072) 2.429*** (0.073) 2.587*** (0.071) 2.577*** (0.071)
Observations
596,294
615,315
616,348
621,887
595,832
Citations
as
a
sectoral-7
share
Institutional
proximity
-0.0758***
(0.019)
-0.0628***
(0.019)
-0.0810***
(0.018)
-0.0736***
(0.019)
-0.0710***
(0.018)
Observations
30,778
30,855
30,770
30,759
[image:28.439.58.352.59.621.2]