N A N O E X P R E S S
Facile Synthesis and Tensile Behavior of TiO
2One-Dimensional
Nanostructures
Syed S. Amin•Shu-you Li• Xiaoxia Wu•
Weiqiang Ding•Terry T. Xu
Received: 23 August 2009 / Accepted: 28 October 2009 / Published online: 18 November 2009 Óto the authors 2009
Abstract High-yield synthesis of TiO2 one-dimensional
(1D) nanostructures was realized by a simple annealing of Ni-coated Ti grids in an argon atmosphere at 950°C and 760 torr. The as-synthesized 1D nanostructures were single crystalline rutile TiO2with the preferred growth direction
close to [210]. The growth of these nanostructures was enhanced by using catalytic materials, higher reaction temperature, and longer reaction time. Nanoscale tensile testing performed on individual 1D nanostructures showed that the nanostructures appeared to fracture in a brittle manner. The measured Young’s modulus and fracture strength are*56.3 and 1.4 GPa, respectively.
Keywords TiO2nanomaterials
Synthesis and characterizationNanoscale tensile testing
Introduction
Titanium dioxide (TiO2) one-dimensional (1D)
nanostruc-tures have received extensive research attention recently because of their promising applications in photo-catalysis,
gas and humidity sensing, solar water splitting, bio-scaf-folds, and others [1–3]. Both ‘‘wet-chemistry’’ and ‘‘dry’’ synthetic methods have been used to prepare TiO2 1D
nanostructures. The ‘‘wet-chemistry’’ methods such as sol– gel process and anodic oxidation require further heat treatment to improve the crystallinity of as-synthesized nanostructures, which adds to the complexity of the pro-cesses. A few ‘‘dry’’ synthetic methods including vapor transport, metal–organic chemical vapor deposition (MOCVD), and annealing have been reported. The vapor transport method involves thermal evaporation of titanium (Ti) sources (e.g., Ti or TiO powders), transport of Ti-containing vapors, and final growth of TiO2
nanostruc-tures on Ti-coated substrates [4–6]. This method requires precise control of source temperatures and reaction tem-peratures, which can be experimentally challenging. The MOCVD method can grow well-aligned TiO2 1D
nano-structures [7, 8]. However, the MOCVD system setup is complicated and expensive. The annealing method grows TiO21D nanostructures by direct oxidation of Ti foils using
acetone, ethanol, or dibutyltin dilaurate (DBTDL) vapor as oxygen (O2) sources [9–11]. While this method is relatively
simple, the use of organic vapor could introduce carbon contamination and result in the growth of TiO2
core-amorphous carbon shell structures [10]. Thus, it is necessary to seek simpler and more reliable ‘‘dry’’ synthetic methods to synthesize high quality TiO2 1D nanostructures. In
addition, since mechanical stability is a crucial factor for structural integrity for the intended applications of TiO2
nanostructures, it is important to study the mechanical properties of individual TiO21D nanostructures.
In our previous work, a facile approach to synthesize TiO2 1D nanostructures by direct heating of nickel
(Ni)-coated TiO powders was demonstrated [12]. In this work, an even simpler one-step ‘‘dry’’ synthetic approach is reported, S. S. AminX. WuT. T. Xu (&)
Department of Mechanical Engineering and Engineering Science, The University of North Carolina at Charlotte, Charlotte, NC 28223, USA
e-mail: ttxu@uncc.edu
S. Li
NUANCE Center, Northwestern University, Evanston, IL 60208, USA
W. Ding (&)
Department of Mechanical and Aeronautical Engineering, Clarkson University, Potsdam, NY 13699, USA
which produces single crystalline rutile TiO2 1D
nano-structures by direct heating of Ni-coated Ti grids in an argon (Ar) environment at the atmospheric pressure. The mechanical properties of individual nanostructures were studied by a nanoscale tensile testing method using a cus-tom-made nanomanipulator inside the vacuum chamber of a scanning electron microscope. According to the knowledge of the authors, this is the first time that the tensile behavior of rutile TiO21D nanostructures is reported.
Materials Synthesis and Characterization
Single crystalline rutile TiO21D nanostructures were
syn-thesized by annealing catalytic material-coated Ti grids in Ar at the atmospheric pressure. Typical synthetic conditions are described in this paragraph, whereas conditions used in control experiments (e.g., variation of reaction tempera-tures) will be described later. Briefly, commercial Ti grids (Structure Probe Inc; mesh size varies from 100 to 400 mesh) were used as the starting material without any further cleaning procedures. A thin film of Ni (*2 nm) was deposited on Ti grids by magnetron sputtering (Denton Vacuum: DeskÒ IV TSC). Ni-coated Ti grids were then loaded into a quartz boat and placed in the desired position inside a quartz tube (/: 1 in. diameter) of a home-built horizontal tube furnace system. The system was first evac-uated to*10 mTorr and then brought back to the atmo-spheric pressure (*760 Torr) with Ar (Linde: 99.999% UHP). A continuous flow of 10 sccm (standard cubic cen-timeter per minute) Ar was then introduced and maintained for the rest of experiment. The quartz tube was ramped up to 950°C (center position temperature measured outside the quartz tube by a thermocouple) in 60 min and soaked at that temperature for 30 min, followed by cooling down to room temperature in*4 h. The Ti grids were then taken out and characterized by scanning electron microscopy (SEM) (JEOL JSM-6480), transmission electron microscopy (TEM; JEOL JEM-2100F) including electron energy loss spectroscopy (EELS) and selected area electron diffraction (SAED), X-ray diffraction (XRD; PANalytical X’Pert Pro diffractometer), and micro-Raman spectroscopy (Reinshaw RM 2000 confocal micro-Raman system in the back-scattering configuration; 514.5 nm excitation green laser).
Figure1a, b is low and high magnification SEM images of as-synthesized 1D nanostructures grown on a 400 mesh Ti grid, respectively. Uniformly distributed nanostructures consisting of both wire- and belt-like morphologies can be found all over the grid. These nanostructures are 20–80 nm in width and 5–20lm in length. Figure1c is the micro-Raman spectrum revealing three major peaks at *224, 444, and 607 cm-1. These peaks match closely to the reference values for rutile TiO2[13]. Figure1d is the XRD
spectrum whose most diffraction peaks can be indexed to the rutile TiO2according to the JCPDS card No. 21-1276
[14]. TEM/EELS/diffraction pattern analyses revealed that the nanostructures are single crystalline, and most of them have the catalytic material Ni on their tips. Figure1e is a low magnification TEM image, showing a 1D nanostruc-ture with a catalytic particle on its tip. Figure1f is a high magnification TEM image of a part of a 1D nanostructure. The corresponding fast Fourier transform (FFT) pattern indicates the single crystalline nature of the nanostructure.
Fig. 1 SEM images of as-synthesized nanostructures on a Ti grid
recorded at low (a) and high (b) magnifications, respectively. The inset in a shows a bare Ti grid before reaction.cA micro-Raman spectrum shows three peaks at 224, 444, and 607 cm-1, correspond-ing to the Raman active modes B1g, Eg and A1g of rutile TiO2,
respectively. dA XRD spectrum shows diffraction peaks, most of which could be indexed to rutile TiO2. The higher intensity
background recorded before the (110) peak was contributed from the glass slide used to hold the samples.eA low magnification TEM image shows a catalytic material on the tip of a nanostructure.fA high magnification TEM image shows a part of one nanostructure. The FFT pattern demonstrates the single crystalline nature of the nanostructure. The lattice fringes in the inset have a neighboring spacing of 0.358 nm, close to thed-spacing of (110) plane of rutile TiO2. The growth direction of the nanostructure is close to the [210]
[image:2.595.308.543.57.396.2]The inset shows lattice fringes clearly. The distance between the neighboring fringes is 0.358 nm, which is close to the d-spacing of (110) plane of rutile TiO2
(d(110)=0.325 nm) [14]. The origin of observed larger
interplanar spacing is unclear. Similar phenomena were reported by other researchers [15, 16]. Factors such as measurement errors, existence of possible impurities, sur-face relaxation [17], and the nature of substrate materials could all play a role. The growth direction of the nano-structure is around 17°away from [110], which is close to the [210] direction. In short, the as-synthesized nano-structures were characterized to be single crystalline rutile TiO2with the preferred growth direction close to the [210].
Several growth controlling factors, including catalytic materials, growth temperature and growth duration, were investigated systematically.
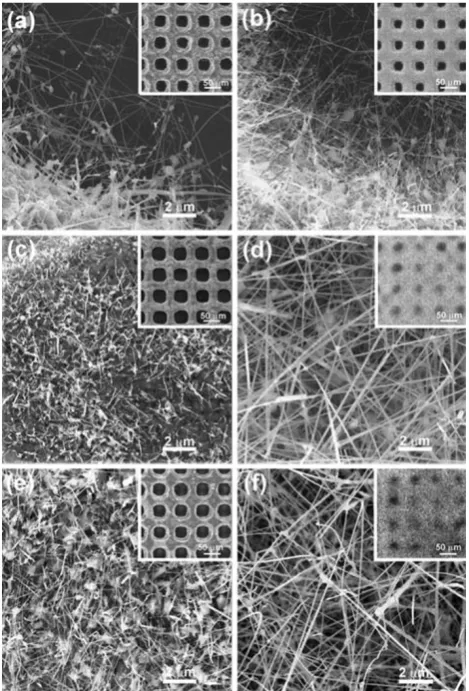
(i) Catalytic Materials. Figure2a, b shows the nano-structures synthesized without and with the catalytic mate-rial Ni at 850°C for 60 min, respectively. It is obvious that the growth of TiO2nanostructures can be greatly enhanced
by using the catalytic material. The optimum thickness of catalytic material film is*2 nm. Thicker or thinner films produced less 1D nanostructures. When employing different catalytic materials in control experiments, the effectiveness of them was found to be in the order of Ni[(Au, Ag)[(Pd, Pt). While a catalytic material was used in syntheses, it can be detected from the tips of most of nano-structures by the TEM/EELS observation.
(ii)Growth Temperature. The center position tempera-ture of the tube furnace was varied from 750 to 1050°C with an interval of 100°C while the reaction time was kept as 60 min. Figure2c, d shows the nanostructures synthe-sized at 750 and 1050°C, respectively. At higher temper-atures, longer, thicker, straighter, and more heavily populated nanowires can be grown.
(iii)Growth Duration. Reaction time was varied from 15 to 120 min while the center position temperature of the tube furnace was kept at 950°C. Figure2e, f shows the nanostructures synthesized in 15 and 120 min, respec-tively. Prolonged reaction time produced longer and slightly thicker TiO2nanostructures. In short, the growth of
TiO21D nanostructures can be enhanced by using catalytic
materials, higher reaction temperature and longer reaction time.
The aforementioned experimental results raise a ques-tion: how many growth mechanisms are involved in the growth of TiO2 nanostructures from Ni-coated Ti grids?
The observation of Ni existing on the tips of most nano-structures suggests that the Vapor–Liquid–Solid (VLS) growth [18] might be the dominating mechanism. How-ever, for the small amount of nanostructures without Ni on their tips and even structures directly grown from bare Ti grids, other growth mechanisms such as Vapor–Solid (VS)
and solid state oxidation growth could be involved [19]. Despite the various growth mechanisms, it is believed that the growth is governed by the chemical reaction: Ti (g or s)?O2 (g)?TiO2 (s). Although our experiments
were done in the Ar atmosphere, the oxygen could come from the leakage of air into the reaction chamber and other possible sources [12]. It was observed that the amount of O2 plays a critical role in the formation of TiO2 1D
nanostructures. Deliberate introduction of 1 sccm O2into
the reaction chamber suppressed the growth of TiO2
nanostructures, but enhanced the formation of polycrys-talline TiO2 film. Similar results have been seen from
growth of TiO2nanostructures directly from Ti foils using
small organic molecules (e.g., acetone, water) as the O2
source [9]. In order to quantify the exact amount of O2
Fig. 2 SEM images of TiO2 1D nanostructures synthesized at
[image:3.595.308.543.58.404.2]needed for growth of TiO2 1D nanostructures from
Ni-coated Ti grids, a new O2mass flow controller capable of
controlling gas at 0.2 sccm level has been integrated into the tube furnace system recently. The results of these additional studies will be presented elsewhere.
Tensile Behavior of As-Synthesized TiO21D Nanostructures
Nanoscale tensile loading [20–22] of individual TiO21D
nanostructures was performed with a custom-made nanomanipulator inside the vacuum chamber of a scanning electron microscope (JEOL JSM-7400F). In short, two Atomic Force Microscopy (AFM) chips were mounted on the two opposing linear positioning stages of the nanom-anipulator. An AFM chip with long (compliant) cantilevers (MikroMasch, Inc.; Chip NSC 12, lengths 350 and 300lm, nominal force constants 0.3 and 0.5 N/m, respectively) was mounted on the X–Y linear stage, and an AFM chip with short (stiff) cantilevers (MikroMasch, Inc.; Chip NSC 12, lengths 90 and 110lm, nominal force constants 14.0 and 7.5 N/m, respectively) was mounted on the opposing Z linear stage together with the TiO2 1D nanostructures
source (i.e., a Ti grid with 1D nanostructures on it) (Fig.3a). Through nanomanipulation, an individual TiO2
1D nanostructure was picked up from the source and clamped between the two opposing AFM tips with the electron beam induced deposition method (Fig.3b). The long (compliant) cantilever, served as the force-sensing element, was then gradually moved away from the short (stiff) cantilever by actuating a piezoelectric bender (Noliac A/S.; CMBP 05) with a dc voltage. An increasing tensile load was thus applied to the nanostructure until it fractured. In our current experimental approach, the applied tensile load and strain in the nanostructure were not directly obtained during the loading process. During the test, the tensile load was increased in discrete steps and SEM images at each loading step were acquired. The applied tensile load and strain in nanostructure at each loading step were obtained later based on the corresponding force-sensing cantilever deflection and nanostructure elongation from image analysis [20,21]. The bending stiffness of the force-sensing AFM cantilever was calibrated with a resonance method in vacuum right before the test [23].
Six nanoscale tensile tests were successfully performed on four individual TiO21D nanostructures, with the sample
#2 being repeatedly tested three times. The experimental results are summarized in Table1. Based on the stress– strain relationships obtained, all these nanostructures appeared to fracture in a brittle manner, and the failure strain ranged from 0.6 to 4.7%. SEM observation of the nanostructure fragments did not reveal any visible necking.
The fracture strength of the TiO2 nanostructure ranged
from 0.3 to 4.2 GPa with an average value of*1.4 GPa. The corresponding Young’s modulus obtained from linear data fitting of the stress–strain curve ranged from 47 to 89 GPa, with an average value of *56 GPa. Sample #3 was noticed to have a smallest value of diameter but a highest value of Young’s modulus, indicating a possible size effect [24].
[image:4.595.307.545.57.407.2]The sample #2 and its fragments were repeatedly loaded three times, with higher breaking force required for each successive test as well as increased failure strain. Such trend has been observed in our previous multiple tensile loading studies on individual multi-wall carbon nanotubes [21]. Considering that a nanostructure under uniaxial ten-sion should fail at the ‘‘critical flaw’’ along its length, the resulting nanostructure fragments should contain less sig-nificant defects than the original one, and should thus possess a higher fracture strength. The Young’s modulus values for the sample #2 obtained from linear fit of the three stress–strain curves are very close, as expected.
Fig. 3 aLow magnification SEM image of the nanoscale tensile test
experiment configuration;bSEM image of a TiO21D nanostructure
For a tetragonal crystal system of class 4/mnm, the Young’s modulus (E) along a unit vector [l1l2l3] can be
expressed as [25] 1
E½l1l2l3
¼ ðl41þl42ÞS11þl43S33þl21l 2
2ð2S12þS66Þ þl23ð1l23Þð2S13þS44Þ
ð1Þ
whereSij (i,j run from 1 to 6) are stiffnesses and can be
converted from compliances (i.e., elastic constants, Cij)
[25]. Using the available elastic constants for rutile TiO2
[26], the Young’s modulus of [210] direction was calcu-lated to be *239 GPa, which is higher than the experi-mental value (*56 GPa). Literature search shows that lower Young’s moduli for 1D nanostructures have been reported [27–30]. For example, the Young’s moduli of ZnO 1D nanostructures were measured to be 29±8 GPa [28] and 31.1±1.3 GPa [29], which are significantly lower than the calculated Young’s modulus of bulk ZnO (Ebulk ZnO [0001]=140 GPa [24]). Despite of measurement errors,
surface stress might be the key reason causing the lower modulus [31]. Lee et al. reported the three-point bending of anatase polycrystalline TiO2nanofibers, the average elastic
modulus of these fibers (*75.6 GPa) was found to be incomparable with the calculated value for bulk anatase TiO2(e.g., Ebulk anatase [100]=192 GPa) [32], mainly due
to the polycrystalline nature of the nanofibers and inherent error associated with the testing method [30]. While the causes of our measured lower modulus of TiO21D
nano-structures need further investigation, the observed larger interplanar spacing might be one reason.
Conclusions
In summary, a simple synthetic process to produce TiO2
1D nanostructures by heating Ni-coated Ti grids has been described. The as-synthesized 1D nanostructures were characterized to be single crystalline rutile TiO2, with the
preferred growth direction close to [210]. Tensile behavior of individual 1D nanostructures was studied by nanoscale tensile testing with a nanomanipulator in an scanning electron microscope. The measured Young’s modulus was
*56 GPa, lower than the value for bulk TiO2. The
reported synthetic technique could facilitate the in situ growth study of 1D nanostructures by TEM. The mechanical characterization of TiO2 1D nanostructures
provides useful information for future device integration of these nanoscale building blocks.
Acknowledgments T. Xu appreciates the support of the start-up
fund and junior research grant at the University of North Carolina at Charlotte (UNC Charlotte). W. Ding appreciates the support of the start-up fund at Clarkson University. We are grateful to the Center for Optoelectronics and Optical Communications at UNC Charlotte, the Center for Advanced Materials Processing at Clarkson, and NUANCE center at Northwestern University for supplying multi-user facilities used for this work.
References
1. X. Chen, S.S. Mao, J. Nanosci. Nanotechnol.6, 906 (2006) 2. A. Ghicov, P. Schmuki, Chem. Commun.20, 2791 (2009) 3. K.H. Yu, J.H. Chen, Nanoscale Res. Lett.4, 1 (2009)
4. J.-M. Wu, H.C. Shih, W.-T. Wu, Nanotechnology17, 105 (2006) 5. J.-C. Lee, K.-S. Park, T.-G. Kim, H.-J. Choi, Y.-M. Sung,
Nanotechnology17, 4317 (2006)
6. J.M. Baik, M.H. Kim, C. Larson, X.H. Chen, S.J. Guo, A.M. Wodtke, M. Moskovits, Appl. Phys. Lett.92, 242111 (2008) 7. J.J. Wu, C.C. Yu, J. Phys. Chem. B108, 3377 (2004)
8. C.A. Chen, Y.M. Chen, A. Korotcov, Y.S. Huang, D.S. Tsai, K.K. Tiong, Nanotechnology19, 075611 (2008)
9. X. Peng, J. Wang, D.F. Thomas, A. Chen, Nanotechnology16, 2389 (2005)
10. K.F. Huo, X.M. Zhang, L.S. Hu, X.J. Sun, J.J. Fu, P.K. Chu, Appl. Phys. Lett.93, 013105 (2008)
11. J. Park, Y. Ryu, H. Kim, C. Yu, Nanotechnology 20, 105608 (2009)
12. S.S. Amin, A.W. Nicholls, T.T. Xu, Nanotechnology18, 445609 (2007)
13. G.M. Begun, C.E. Bamberger, Appl. Spectrosc.43, 134 (1989) 14. JCPDS Database, PDF#21-1276, Materials Data, Inc
15. N.P. Kobayashi, S.Y. Wang, C. Santori, R.S. Williams, Appl. Phys. A Mater.85, 1 (2006)
16. L. Gao, R.L. Woo, B. Liang, M. Pozuelo, S. Prikhodko, M. Jackson, N. Goel, M.K. Hudait, D.L. Huffaker, M.S. Goorsky, S. Kodambaka, R.F. Hicks, Nano Lett.9, 2223 (2009)
17. U. Diebold, Surf. Sci. Rep.48, 53 (2003)
18. R.S. Wagner, W.C. Ellis, Appl. Phys. Lett.4, 89 (1964) 19. Y.N. Xia, P.D. Yang, Y.G. Sun, Y.Y. Wu, B. Mayers, B. Gates,
[image:5.595.50.544.73.172.2]Y.D. Yin, F. Kim, Y.Q. Yan, Adv. Mater.15, 353 (2003)
Table 1 Tensile testing results on four TiO21D nanostructures with sample #2 repeatedly tested three times
Sample # Diameter (nm) Length (lm) Breaking force (lN) Tensile strength (MPa) Failure strain (%) Young’s modulus (GPa)
1 52 7.85 1.57 740 1.5 52
2_1 47 17.13 0.51 290 0.6 48
2_2 47 14.60 0.83 460 1.0 48
2_3 47 9.68 1.94 1,170 2.5 47
3 28 15.02 2.58 4,200 4.7 89
20. W.Q. Ding, L. Calabri, X.Q. Chen, K.M. Kohhaas, R.S. Ruoff, Comp. Sci. Technol.66, 1112 (2006)
21. W. Ding, L. Calabri, K.M. Kohlhaas, X. Chen, D.A. Dikin, R.S. Ruoff, Exp. Mech.47, 25 (2007)
22. W.Q. Ding, Z.Y. Guo, R.S. Ruoff, J. Appl. Phys.101, 034316 (2007)
23. J.E. Sader, I. Larson, P. Mulvaney, L.R. White, Rev. Sci. Instrum.
66, 3789 (1995)
24. C.Q. Chen, Y. Shi, Y.S. Zhang, J. Zhu, Y.J. Yan, Phys. Rev. Lett.
96, 075505 (2006)
25. J.F. Nye, Physical Properties of Crystals (Oxford University Press, Oxford, 1985), pp. 143–149
26. D.G. Isaak, J.D. Carnes, O.L. Anderson, H. Cynn, E. Hake, Phys. Chem. Miner.26, 31 (1998)
27. X.D. Bai, P.X. Gao, Z.L. Wang, E.G. Wang, Appl. Phys. Lett.82, 4806 (2003)
28. J.H. Song, X.D. Wang, E. Riedo, Z.L. Wang, Nano Lett.5, 1954 (2005)
29. H. Ni, X.D. Li, Nanotechnology17, 3591 (2006)
30. S.-H. Lee, C. Tekmen, W.M. Sigmund, Mater. Sci. Eng. A398, 77 (2005)
31. G.F. Wang, X.D. Li, Appl. Phys. Lett.91, 231912 (2007) 32. I. Gheewala, R. Smith, S.D. Kenny, J. Phys. Condens. Matter20,