The role of insulin receptor substrate 2 in
hypothalamic and
bb
cell function
Agharul I. Choudhury, … , Michael L.J. Ashford, Dominic J.
Withers
J Clin Invest.
2005;
115(4)
:940-950.
https://doi.org/10.1172/JCI24445
.
Insulin receptor substrate 2 (Irs2) plays complex roles in energy homeostasis. We generated
mice lacking Irs2 in
b
cells and a population of hypothalamic neurons (
RIPCreIrs2KO
), in all
neurons (
NesCreIrs2KO
), and in proopiomelanocortin neurons (
POMCCreIrs2KO
) to
determine the role of Irs2 in the CNS and
b
cell.
RIPCreIrs2KO
mice displayed impaired
glucose tolerance and reduced
b
cell mass. Overt diabetes did not ensue, because
b
cells
escaping Cre-mediated recombination progressively populated islets.
RIPCreIrs2KO
and
NesCreIrs2KO
mice displayed hyperphagia, obesity, and increased body length, which
suggests altered melanocortin action.
POMCCreIrs2KO
mice did not display this phenotype.
RIPCreIrs2KO
and
NesCreIrs2KO
mice retained leptin sensitivity, which suggests that CNS
Irs2 pathways are not required for leptin action.
NesCreIrs2KO
and
POMCCreIrs2KO
mice
did not display reduced
b
cell mass, but
NesCreIrs2KO
mice displayed mild abnormalities
of glucose homeostasis. RIPCre neurons did not express POMC or neuropeptide Y. Insulin
and a melanocortin agonist depolarized RIPCre neurons, whereas leptin was ineffective.
Insulin hyperpolarized and leptin depolarized POMC neurons. Our findings demonstrate a
critical role for IRS2 in
b
cell and hypothalamic function and provide insights into the role of
RIPCre neurons, a distinct hypothalamic neuronal population, in growth and energy
homeostasis.
Article
Metabolism
Find the latest version:
Research article
940 The Journal of Clinical Investigation http://www.jci.org Volume 115 Number 4 April 2005
The role of insulin receptor substrate 2
in hypothalamic and
β
cell function
Agharul I. Choudhury,1 Helen Heffron,1 Mark A. Smith,2 Hind Al-Qassab,1
Allison W. Xu,3 Colin Selman,1 Marcus Simmgen,1 Melanie Clements,1 Marc Claret,1
Gavin MacColl,1 David C. Bedford,1 Kazunari Hisadome,2 Ivan Diakonov,1
Vazira Moosajee,4 Jimmy D. Bell,4 John R. Speakman,5 Rachel L. Batterham,1
Gregory S. Barsh,3 Michael L.J. Ashford,2 and Dominic J. Withers1
1Centre for Diabetes and Endocrinology, Rayne Institute, University College London, London, United Kingdom. 2Neurosciences Institute, Division of Pathology and Neuroscience, Ninewells Hospital and Medical School, University of Dundee, Dundee, United Kingdom. 3Departments of Genetics and Pediatrics, Stanford University School of Medicine, Stanford, California, USA. 4Molecular Imaging Group, Medical Research Council Clinical Sciences Centre, Faculty of Medicine, Imperial College London, Hammersmith Hospital Campus, London, United Kingdom.
5Aberdeen Centre for Energy Regulation and Obesity (ACERO), School of Biological Sciences, University of Aberdeen, Aberdeen, United Kingdom.
Insulin receptor substrate 2 (Irs2) plays complex roles in energy homeostasis. We generated mice lacking
Irs2 in
β
cells and a population of hypothalamic neurons (
RIPCreIrs2KO
), in all neurons (
NesCreIrs2KO
),
and in proopiomelanocortin neurons (
POMCCreIrs2KO
) to determine the role of Irs2 in the CNS and
β
cell.
RIPCreIrs2KO
mice displayed impaired glucose tolerance and reduced
β
cell mass. Overt diabetes did not
ensue, because
β
cells escaping Cre-mediated recombination progressively populated islets.
RIPCreIrs2KO
and
NesCreIrs2KO
mice displayed hyperphagia, obesity, and increased body length, which suggests altered
melanocortin action.
POMCCreIrs2KO
mice did not display this phenotype.
RIPCreIrs2KO
and
NesCreIrs2KO
mice retained leptin sensitivity, which suggests that CNS Irs2 pathways are not required for leptin action.
NesCreIrs2KO
and
POMCCreIrs2KO
mice did not display reduced
β
cell mass, but
NesCreIrs2KO
mice
dis-played mild abnormalities of glucose homeostasis. RIPCre neurons did not express POMC or neuropeptide Y.
Insulin and a melanocortin agonist depolarized RIPCre neurons, whereas leptin was ineffective. Insulin
hyperpolarized and leptin depolarized POMC neurons. Our findings demonstrate a critical role for IRS2 in
β
cell and hypothalamic function and provide insights into the role of RIPCre neurons, a distinct
hypotha-lamic neuronal population, in growth and energy homeostasis.
Introduction
Insulin regulates peripheral energy homeostasis by acting on mul-tiple tissues to control carbohydrate, lipid, and protein metabolism (1). Gene targeting in mice has shown that β cell deletion of the insulin receptor causes reduced first-phase insulin release, reduced
β cell insulin content, and progressive deterioration in glucose tol-erance (2). Early studies of the effects of insulin in the CNS dem-onstrated a role for intracerebroventricularly administered insulin in the control of food intake and body weight (3). Mouse brain insulin receptor deletion causes mild hyperphagia and adiposity in female mice, diet-sensitive obesity, and defects in reproductive function (4). Results from studies in which insulinomimetics and insulin receptor antisense were centrally administered also sup-port a role for CNS insulin signaling in energy homeostasis regula-tion (5, 6). Insulin signaling mechanisms therefore regulate β cell and CNS function, but it is unclear which postreceptor
compo-nents mediate which physiological effects and, in the case of the CNS, which neuronal populations are involved. It is also unclear how insulin signaling components interact with other molecules involved in energy homeostasis, such as leptin.
Insulin receptor substrate (Irs) proteins lie downstream of the activated insulin and type 1 insulin-like growth factor receptor (7). Gene targeting studies have revealed distinct physiological roles for the 4 major Irs proteins (7). Mice lacking Irs1 display profound growth retardation and insulin resistance but, due to β cell com-pensation, do not develop diabetes (8, 9). Irs3- and Irs4-null mice have minimal metabolic, endocrine, and growth phenotypes (7). In contrast, mice lacking Irs2 develop diabetes due to insulin resis-tance and pancreatic β cell dysfunction (10). These studies have suggested that Irs2 is the major mediator of the metabolic effects of insulin and have identified a novel role for Irs2 signaling in the maintenance of β cell mass. Irs2 signaling also plays complex roles in neuroendocrine function. Female Irs2-null mice are infertile, hyperphagic, and develop obesity (11). Irs2-null mice are reported to be leptin resistant (12), which suggests that Irs2 acts as a point of convergence for leptin and insulin signaling.
It has recently been reported that mice lacking Irs2 in both pancre-atic β cells and a poorly defined hypothalamic neuronal population (generated using a rat insulin 2 promoter Cre [RIPCre] recombinase transgene) display reduced islet mass, impaired glucose tolerance, and hypothalamic dysfunction (13, 14). Unlike mice with global deletion of Irs2, these mice did not develop progressive diabetes. One study (13) reported that they displayed a hypothalamic phenotype sug-gesting melanocortin dysfunction, proposed that RIPCre neurons
Nonstandard abbreviations used: AgRP, agouti-related protein; DBA, Dolichos biflorus agglutinin; DIG, digoxigenin; ICC, immunocytochemistry; Irs, insulin recep-tor substrate; Irs2lox mice, mice with a floxed allele of Irs2; ISH, in situ hybridization;
αMSH, α melanocyte-stimulating hormone; MTII, melanotan II; NesCreIrs2KO mice, mice lacking Irs2 in nestin Cre-expressing cells; NPY, neuropeptide Y; POMC, proopiomelanocortin; POMCCreIrs2KO mice, mice lacking Irs2 in POMC-expressing cells; RIP, rat insulin 2 promoter; RIPCre mice, mice expressing Cre under the control of the rat insulin 2 promoter; RIPCreIrs2KO mice, mice lacking Irs2 in β cells and a poorly characterized population of hypothalamic neurons; TTX, tetrodotoxin; VMH, ventromedial hypothalamus.
Conflict of interest: The authors have declared that no conflict of interest exists. Citation for this article:J. Clin. Invest.115:940–950 (2005).
research article
The Journal of Clinical Investigation http://www.jci.org Volume 115 Number 4 April 2005 941
are proopiomelanocortin (POMC) neurons, and noted β cell recov-ery with time through an undetermined mechanism. Another study (14) demonstrated reduced islet mass, obesity, and leptin resistance but did not report other features of hypothalamic dysfunction or long-term analysis of islet function. Consequently, these studies have raised a number of critical but unanswered questions (15). In particular it is unclear (a) why there is a relative recovery of the β cell phenotype; (b) what role the CNS plays in the β cell phenotype and the impairment of glucose homeostasis; (c) what is the role of Irs2 in leptin action; and (d) what are the identity and characteristics of the hypothalamic neuronal population involved (15).
To address these questions, we generated mice lacking Irs2
in specific cell types: RIPCreIrs2KO mice, lacking Irs2 in β cells and a poorly characterized population of hypothalamic neu-rons; NesCreIrs2KO mice, lacking Irs2 in all neurons but not the endocrine pancreas; and POMCCreIrs2KO mice, lacking Irs2 in POMCCre-expressing cells.
Results
Generation of mice with a floxed allele of Irs2. We generated mice with a floxed allele of Irs2 (Irs2lox mice) to permit its deletion in different cell types and tissues (Figure 1, A–E). Irs2lox mice,
when bred to homozygosity, were phenotypically indistinguish-able from wild-type animals and displayed normal Irs2 expres-sion (data not shown).
Using 3 Cre recombinase transgenic lines, we generated
RIPCreIrs2KO, NesCreIrs2KO, and POMCCreIrs2KO mice. We also intercrossed RIPCre and POMCCre mice with ZEG (16) and
Rosa26lacZ (17) indicator mice on both wild-type and Irs2lox/lox
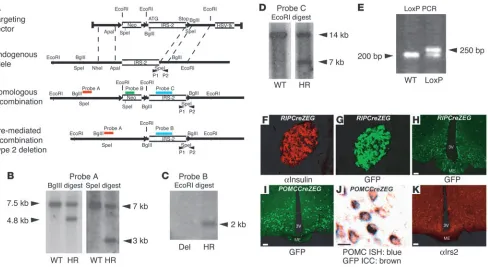
backgrounds. This allowed identification of cell types in which recombination occurredand permitted Irs2 deletion and GFP or lacZ expression in the same cell types. RIPCreZEG mice expressed GFP in pancreatic islets, hypothalamic structures such as the arcuate, lateral, and ventromedial hypothalamus (VMH), and a discrete population of forebrain neurons (Figure 1, F–H, and data not shown). In POMCCreZEG mice, GFP expression was found in a discrete population of arcuate nucleus neurons (Figure 1I). Com-bined in situ hybridization (ISH) and immunocytochemistry (ICC) studies demonstrated colocalization of GFP and POMC (Figure 1J) in more than 90% of cells examined, which indicated that most POMC neurons also expressed functional Cre recombinase. No GFP expression was found in pancreatic β cells (data not shown). NesCre
[image:3.585.52.540.81.348.2]mice delete in neurons but not pancreatic endocrine cells (18) and have been used to manipulate insulin signaling in the CNS (4).
Figure 1
Generation of Irs2flox mice and characteristics of RIPCre and POMCCre mice. (A) Schema of targeting construct design, simplified restriction map of the Irs2 locus, the locus after homologous recombination and the deletion of neomycin cassette (Neo), and Southern blotting and PCR genotyping strategies used to identify these events. External probe A was used to identify homologous recombination (HR), probe B to detect the selection cassette, and probe C to detect the coding region of Irs2. HSV-tk, herpes simplex virus thymidine kinase. (B) Southern blot analysis with probe A demonstrating homologous recombination after targeting. (C and D) Southern blots using probe B after Cre-mediated recombination demonstrating deletion (Del) of the neomycin cassette and using probe C to demonstrate retention of Irs2 coding region confirming type 2 recombination. (E) PCR analysis with primers P1 and P2 of HR clone that has lost the neomycin cassette but retained the loxP site downstream of the Irs2 coding region. (F–H) We examined Cre expression in RIPCre mice by analyzing GFP expression in pancreatic sections costained with insulin and hypothalamic sections from RIPCreZEG mice. (I) We examined Cre expression in POMCCre mice by analyzing hypothalamic sections from POMCCreZEG
research article
942 The Journal of Clinical Investigation http://www.jci.org Volume 115 Number 4 April 2005 Irs2 expression was found in pancreatic islets and in the arcuate, the
VMH, and the paraventricular nucleus (Figure 1K and Figure 2B and data not shown).
To confirm deletion of Irs2 in the RIPCreIrs2KO, NesCreIrs2KO, and POMCCreIrs2KO mice, we analyzed recombination of the
Irs2flox allele by PCR in islet and hypothalamic DNA. In 4-week- old mice, the recombined allele was detected in both tissues in RIPCreIrs2KO mice (Figure 2A) but only in the hypothal-ami of NesCreIrs2KO and POMCCreIrs2KO mice (Figure 2A). Immunoprecipitation and Western blotting confirmed the lack of Irs2 expression in isolated islets from RIPCreIrs2KO and in either whole brain or hypothalamic lysates from NesCreIrs2KO mice (Figure 2, B and C). ICC analysis of RIPCreZEG mice demonstrat-ed Irs2 colocalization with GFP in some but not all hypothalamic arcuate neurons (Figure 2D, left panel). In RIPCreIrs2KOZEG mice, there was no colocalization of Irs2 and GFP, which confirmed Irs2
deletion in RIPCre neurons (Figure 2D, right). Irs2 expression remained in other hypothalamic neurons. Analysis of Irs2 expres-sion in POMCCreZEG mice demonstrated colocalization of Irs2 with GFP in some POMC neurons (Figure 2E). Irs2 deletion was confirmed in POMCCreIrs2KOlacZ mice (we were unable to breed
POMCCreIrs2KOZEG mice), but Irs2 expression remained in other hypothalamic arcuate neurons (Figure 2F). Normal Irs2 expression was detected in muscle, liver, adipose, and other tissues in mice of all 3 lines (data not shown).
Glucose homeostasis in RIPCreIrs2KO, NesCreIrs2KO, and POMCCreIrs2KO mice. In 4-week-old male RIPCreIrs2KO,
NesCreIrs2KO, and POMCCreIrs2KO mice, fasting blood glucose lev-els were indistinguishable from those of control animals (data not shown). At 12 weeks of age, when male Irs2-null mice are diabetic,
RIPCreIrs2KO mice had higher fasting blood glucose levels than control mice, and glucose tolerance tests revealed defective glucose disposal (Figure 3, A and B). However, the elevation in fasting blood glucose levels was modest, and thus RIPCreIrs2KO mice did not dis-play the overt diabetes and catabolic state that Irs2-null mice devel-op. Fasting glucose levels were also elevated in NesCreIrs2KO mice,
and glucose tolerance was mildly impaired (Figure 3, A and C).
RIPCreIrs2KO and NesCreIrs2KO miceat 6 months of age and older did not develop markedly elevated fasting blood glucose levels but remained glucose intolerant (Figure 3D and data not shown). In contrast, fasting glucose levels and glucose tolerance were equiva-lent to those of controls in POMCCreIrs2KO mice at 12 weeks and older (Figure 3A and data not shown).
At 12 weeks, RIPCreIrs2KO and NesCreIrs2KO mice, but not
POMCCreIrs2KO mice, displayed fasting hyperinsulinemia com-pared with control animals, which suggests development of insu-lin resistance (Figure 3E). At 6 months, both RIPCreIrs2KO and
NesCreIrs2KO mice remained hyperinsulinemic (data not shown). At 4 weeks, when there was a 50% reduction in β cell mass in Irs2-null mice (10), no decrease in β cell mass was seen in RIPCreIrs2KO
compared with control animals (data not shown). However, by 12 weeks, RIPCreIrs2KO mice had a 40% reduction in β cell mass com-pared with control mice (Figure 3F, left), consistent with the dete-rioration in glucose homeostasis at this age. In contrast, 12-week-old NesCreIrs2KO mice exhibited an increased β cell mass, evidence of a compensatory response to insulin resistance (Figure 3F, left).
POMCCreIrs2KO did not display altered β cell mass compared with age-matched controls (data not shown).
To investigate the preservation of glucose homeostasis com-pared with Irs2-null mice, we examined β cell mass in 9-month-old RIPCreIrs2KO mice. RIPCreIrs2KO mice had a reduced islet area compared with control animals (Figure 3F, right), but the area had increased from that seen in 12-week-old RIPCreIrs2KO mice, which suggests partial recovery in β cell mass (Figure 3F, right).
Hypothalamic function in RIPCreIrs2KO, NesCreIrs2KO, and POMCCreIrs2KO mice. RIPCreIrs2KO and NesCreIrs2KO mice dis-played increased body weight compared with control mice starting around 4–5 weeks of age. By 12 weeks of age, they were 20% heavier than control animals (Figure 4A). RIPCreIrs2KO and NesCreIrs2KO
[image:4.585.93.492.84.226.2]mice were significantly longer than control mice (Supplemental Figure 1; supplemental material available online with this article; doi:10.1172/JCI200524445DS1). MRI scanning performed at 16
Figure 2
research article
The Journal of Clinical Investigation http://www.jci.org Volume 115 Number 4 April 2005 943
weeks showed increased fat mass that was more significant in
NesCreIrs2KO mice (Figure 4B). At 12 weeks, 24-hour food con-sumption was greater in both RIPCreIrs2KO and NesCreIrs2KO mice than in control animals (Figure 4C). In contrast, analysis of rest-ing metabolic rate, core temperature, and activity revealed no dif-ferences between RIPCreIrs2KO or NesCreIrs2KO mice and control animals (Supplemental Table 1). Furthermore POMCCreIrs2KO
mice did not display increased body weight (Figure 4A), were of the same length as controls (Supplemental Figure 1), anddid not eat more than control mice (Figure 4C).
At 12 weeks of age when RIPCreIrs2KO and NesCreIrs2KO mice displayed marked obesity, leptin levels were significantly elevated in these mice but not in POMCCreIrs2KO mice (Figure 4D). We administered leptin (5 mg/kg) peripherally for 3 days to accli-matized 6-week-old mice. This treatment inhibited cumulative 3-day food intake in control animals by 20% compared with vehicle-treated animals (Figure 4, E and F). RIPCreIrs2KO and
NesCreIrs2KO mice, despite being hyperphagic, also responded to leptin treatment with a 20% decrease in cumulative food intake (Figure 4, E and F). The reduction in food intake was accompa-nied in control, RIPCreIrs2KO, and NesCreIrs2KO mice by a signifi-cant reduction in body weight (Figure 4G). To further investigate the temporal development of the feeding phenotype, we measured leptin levels and food intake in 5-week-old male RIPCreIrs2KO
mice. At this age, RIPCreIrs2KO mice were hyperphagic but did not display hyperleptinemia (Figure 4H). Findings for NesCreIrs2KO
mice were similar (data not shown).
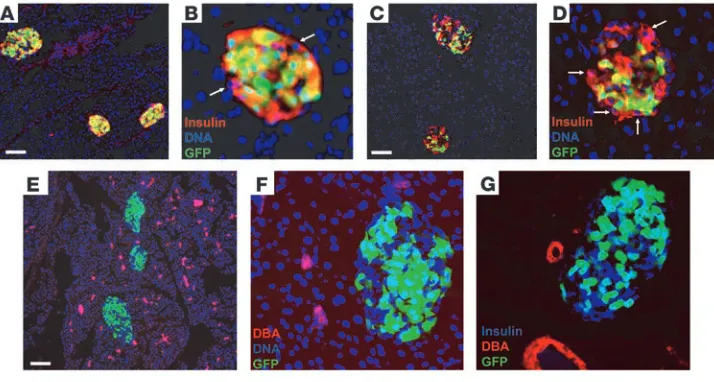
Characterization of β cell recovery in RIPCreIrs2KO mice. Our studies and others (13, 15, 19) raise the question of the mechanism for the relative recovery of the β cell mass in RIPCreIrs2KO mice with age. Analysis of 4-week-old RIPCreIrs2KOZEG mice demonstrated that a vast majority of insulin-positive cells coexpressed GFP, which sug-gests that recombination was occurring in most β cells (Figure 5, A and B). However, we detected small numbers of insulin-express-ing cells that were GFP negative (Figure 5B), which indicates lack of recombination and that the RIPCre promoter was not active in all
β cells. It would be predicted that Irs2 would not be deleted in these cells and therefore they are involved in the preservation or recovery of β cell mass. Indeed, analysis of 9-month-old RIPCreIrs2KOZEG
mice demonstrated that in many islets, a significant proportion of the insulin-positive β cells no longer expressed GFP (Figure 5, C and D). Comparison of the numbers of GFP-positive β cells in 9-month-old mice demonstrated that GFP expression loss occurred significantly more often in RIPCreIrs2KOZEG than con-trol mice (percentage of GFP-negative β cells: RIPCreIrs2KOZEG, 50.9% ± 1.2% vs. RIPCreZEG, 10.1% ± 1.1%; P <0.001; 2,062 β cells sampled in 54 islets from 4 RIPCreIrs2KOZEG mice and 2,987 β
cells sampled in 45 islets from 3 RIPCreZEG mice).
To further characterize the mechanism of β cell recovery, we used a duct-specific lectin (Dolichos biflorus agglutinin [DBA]) to identify duct epithelial cells (20). GFP or insulin expressionwas not detected in DBA-positive duct structures in RIPCreIrs2KOZEG
[image:5.585.55.528.80.311.2]mice at 9 months of age (Figure 5, E–G). Likewise, in 9-month-old RIPCreIrs2KOZEG mice, in 296 islets sampled from 4 mice, no
Figure 3
Glucose homeostasis in RIPCreIrs2KO, NesCreIrs2KO, and POMCCreIrs2KO mice. (A) Fasting blood glucose levels of 12-week-old male mice of the indicated genotypes were measured after a 16-hour overnight fast. (B). Glucose tolerance tests were performed on 12-week-old male RIPCreIrs2KO (filled squares) and control mice (open squares). (C) Glucose tolerance tests were performed on 12-week-old male
NesCreIrs2KO (filled squares) and control mice (open squares). (D) Fasting blood glucose levels of 6-month-old male mice of the indicated genotypes were measured after a 16-hour overnight fast. (E) Fasting blood insulin levels of 12-week-old male mice of the indicated genotypes were measured after a 16-hour overnight fast. Data in A–E represent the mean ± SEM for 8–10 animals of each genotype. (F) We calculated the percentage of the total pancreatic area occupied by β cells in 12-week-old male mice of the indicated genotypes using insulin-stained pancreatic sections. The right side shows data for 9-month-old RIPCreIrs2KO and control mice. Four pancreata were analyzed per genotype at each time point, and for each pancreas, 4 sections were analyzed. The data presented are mean ± SEM for 4 mice of each genotype. *P < 0.05, **P < 0.01, and ***P < 0.001. Cont, control.
research article
research article
944 The Journal of Clinical Investigation http://www.jci.org Volume 115 Number 4 April 2005 DBA-positive cells were found within islets (Figure 5, E–G). These
findings suggest that duct cells that have differentiated to insu-lin-producing cells within ducts or duct cells that migrate to islet structures before converting to β cells do not make a significant contribution to the β cell repopulation. These findings do not exclude the possibility that ductal precursor cells that express nei-ther duct markers nor insulin are involved in this process.
Characterization of RIPCre neurons and comparison with POMC neurons. Our studies demonstrate that RIPCre neurons play a role in energy homeostasis and growth and that deletion of Irs2 in these cells gener-ates a phenotype with similarities to that of melanocortin pathway mutants. However, our genetic evidence suggests that deletion of Irs2
in POMC neurons does not account for the hypothalamic pheno-type seen in RIPCreIrs2KO or NesCreIrs2KO mice. RT-PCR analysis of expression of hypothalamic feeding peptides in RIPCreIrs2KO and
NesCreIrs2KO mice demonstrated reduced POMC expression (POMC mRNA: 42% reduction in NesCreIrs2KO mice normalized to control mice, P <0.05, n =5; 48% reduction in RIPCreIrs2KO mice normalized to control mice, P <0.05, n =8) but normal neuropeptide Y (NPY) and agouti-related protein (AgRP) expression (data not shown), which
suggests an effect on melanocortin circuits. No alteration in hypotha-lamic POMC, AgRP, and NPY expression was seen in POMCCreIrs2KO
mice. Therefore, to characterize the relationship between RIPCre neu-rons and melanocortin pathways, we performed ISH/ICC analysis and electrophysiological studies of RIPCre and POMCCre neurons. POMC- and GFP-expressing neurons in the hypothalamus were clear-ly identified by ISH and ICC, respectiveclear-ly, in the same slices (Figure 6, A and B), and no GFP-positive neurons colocalized with POMC mRNA. POMC and RIPCre neurons, however, are closely associ-ated with each other.Similarly, no coexpression of GFP was dem-onstrated in NPY neurons, but close apposition of these neuronal populations was observed (Figure 6, C and D). Combined ICC for α
melanocyte-stimulating hormone (αMSH) and GFP demonstrated no coexpression, but many GFP neurons were in close proximity to
αMSH-positive fibers, which suggests that they may be targets for POMC neurons (Figure 6E).
[image:6.585.52.536.82.416.2]Whole-cell current-clamp recordings were made from GFP-posi-tive hypothalamic arcuate neurons from RIPCreZEG mice. Under control recording conditions, RIPCre neurons spontaneously fired action potentials and had a mean resting potential of –50 ± 1 mV
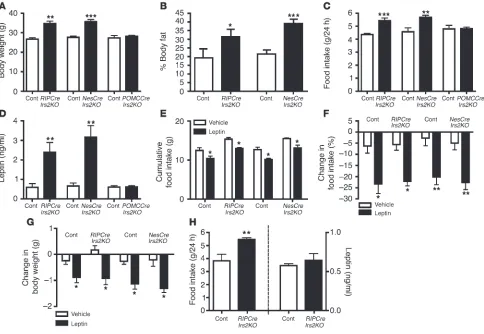
Figure 4
Hypothalamic function in RIPCreIrs2KO, NesCreIrs2KO, and POMCCreIrs2KO mice. (A) Body weight was measured in 12-week-old male mice of the indicated genotypes. (B) Total body fat was determined by MRI in 16-week-old male mice of the indicated genotypes. (C) Cumulative 24-hour food intake was measured in 12-week-old male mice of the indicated genotypes. (D) Fasting blood leptin levels of 12-week-old male mice of the indicated genotypes were measured after a 16-hour overnight fast. (E–G) Cumulative food intake, percent reduction in food intake com-pared with baseline, and reduction in bodyweight were measured over a 3-day period of treatment with leptin (5 mg/kg) or vehicle in 6–8-week-old male mice of the indicated genotypes. (H) Food intake and fasting leptin levels were determined in 5-week-old male mice of the indicated genotypes. Data in A–H data represent the mean ± SEM for 8–10 animals of each genotype. *P < 0.05, **P < 0.01, and ***P < 0.001.
research article
research article
The Journal of Clinical Investigation http://www.jci.org Volume 115 Number 4 April 2005 945
and input resistance of 1,862 ± 197 MΩ (n =62). Bath applica-tion of the αMSH analog melanotan II (MTII) (a nonselective melanocortin 3/4 receptor agonist) at 100 nM caused long-lasting depolarization in the majority of cells tested (from –53 ± 3 mV to –48 ± 2 mV; P <0.01; n =9/13), associated with increased spike firing (Figure 6, F and G).
To demonstrate the MTII excitatory effect more clearly, we applied a small hyperpolarizing current to individual neurons, such that action potential frequency was markedly reduced. Under these conditions, MTII (100 nM) caused depolarization and increased firing frequency (Figure 6H). Furthermore, the applica-tion of MTII (100 nM) to RIPCre neurons, following incubaapplica-tion of the slice with tetrodotoxin (TTX; 500 nM) to block spike firing and prevent synaptic transmission, caused significant depolariza-tion (n =4), which indicates a direct action (Figure 6I). To further characterize RIPCre neurons and differentiate them from POMC (and NPY) neurons, we determined the actions of insulin and leptin on the electrical properties of RIPCre and POMC neurons. Leptin has been demonstrated to depolarize POMC neurons (21), and our current results support this finding. Pressure ejection of leptin (50 nM) for 60 seconds directly above the recorded neuron caused an increase in spike frequency and a small depolarization (from –47 ± 2 mV to –44 ± 3 mV; P <0.04) of a minority population of POMCneurons (n =5/13) (Figure 7, A–C). In contrast, leptin (50 nM) did not affect action potential frequency or resting mem-brane potential (–46 ± 3 mV vs. –47 ± 3 mV; n =10; Figure 7, D and E) in RIPCre neurons. Pressure ejection of insulin (10 nM) for 60 sec-onds produced a significant increase in action potential frequency, concomitant with cell depolarization (from –49 ± 4 to –40 ± 4 mV;
P <0.01) in the majority of recordings (n =6/9) from RIP-Cre neurons (Figure 7, F–H). In contrast, pressure injec-tion of insulin (10 nM) onto POMC neurons resulted in hyperpolarization (from –48 ± 1 mV to –55 ± 2 mV;
P <0.001) and reduced action potential frequency in most
(n =9/11) neurons (Figure 7, I and J). The effect of insulin, MTII, and leptin on neuronal activity was extremely slow to reverse and was, in many cases, irrevers-ible over the time course of the experiments. These experiments suggest that RIPCre neurons are a population distinct from either POMC or NPY neurons but lie within a melanocortin- and insulin-regulated neuronal mechanism.
Discussion
Through global gene deletion, we and others have previously implicated Irs2 in the regulation of β cell function and peripheral glucose metabolism and the central regulation of energy homeostasis (10, 11, 19, 22). These studies have suggested but not proved that Irs2 medi-ates both β cell growth and leptin and insulin action in the CNS. To elucidate the contribution of Irs2 to this complex phe-notype in specific tissues, we generated mice with a conditional allele of Irs2 to permit deletion in a number of cell types. We ini-tially used RIPCre transgenic mice to generate RIPCreIrs2KO mice lacking Irs2 in β cells and a population of hypothalamic neurons, and indeed it has recently been reported that RIPCreIrs2KO mice display phenotypes due to this mixed pattern of deletion (13, 14). These mice developed reduced β cell mass, obesity, somatic overgrowth, hyperinsulinemia, and hyperleptinemia but did not progress to an overt diabetic phenotype because of an unex-plained recovery in β cell mass. However, because of the inabil-ity to dissociate β cell and hypothalamic phenotypes, a number of questions regarding the role of Irs2 remain unanswered (15). To directly address such issues that we encountered with our own RIPCreIrs2KO mice, we also generated NesCreIrs2KO mice, lacking Irs2 in all neurons but not the endocrine pancreas, and
POMCCreIrs2KO mice, lacking Irs2 in hypothalamic POMC neu-rons, which have been implicated in mediating leptin’s effects on energy homeostasis (23).
Consistent with recent reports (13, 14), 12-week-old
RIPCreIrs2KO mice had reduced β cell mass and displayed mildly elevated fasting blood glucose levels, impaired glucose tolerance, and hyperinsulinemia. They developed a marked hypothalamic phenotype resembling that of mice with defects in melanocortin action. In contrast, NesCreIrs2KO mice, which have normal β cell Irs2 expression, had increased β cell mass in response to insulin resistance and displayed the obesity and overgrowth syndrome. These findings demonstrate that β cell mass reduction is due to Irs2 deletion solely in β cells and not in the CNS. However,
[image:7.585.46.403.83.274.2]NesCreIrs2KO did develop elevated fasting blood glucose levels and hyperinsulinemia, which suggests that neuronal Irs2 path-ways are required for normal glucose homeostasis but that the increase in β cell mass seen in NesCreIrs2KO mice could compen-sate for insulin resistance.
Figure 5
Analysis of recombination and duct-marker expression in islets from RIPCreIrs2KOZEG mice. (A–D) Immunofluorescence staining for insulin (red) in islets from 4-week-old (A and B) and 9-month-old (C and D)
research article
946 The Journal of Clinical Investigation http://www.jci.org Volume 115 Number 4 April 2005 In contrast to Lin et al. (13), we found that in 9-month-old
RIPCreIrs2KO mice, there was a persistent reduction in β cell mass compared with that of control mice, although the mass was increased compared with that of 3-month-old RIPCreIrs2KO mice. At later ages, therefore, RIPCreIrs2KO mice had glucose intolerance but did not display marked fasting hyperglycemia and never devel-oped the marked progressive diabetic phenotype of the global Irs2 -null mouse. Anatomical studies of recombination using a GFP indi-cator mouse in either a wild-type or Irs2flox background revealed that as early as 4 weeks, small numbers of β cells did not harbor the recombination event. By 9 months of age, significant numbers of
β cells in RIPCreIrs2KO mice not expressing GFP had repopulated the islets, but many GFP-positive cells undergoing recombination were still present, which explains the persistent reduction in β cell mass. Our studies demonstrate that the reduction in
recombina-tion occurs predominantly in RIPCreIrs2KOZEG as opposed to
RIPCreZEG islets, which suggests that Irs2 signaling itself is required for expression of the RIPCre transgene. Indeed, insulin gene expres-sion appears to require an intact insulin signaling pathway in the β
[image:8.585.83.488.83.428.2]cell (2, 24, 25). With Irs2 largely absent within β cells, under condi-tions of insulin resistance there may be potential selection for pre-existing β cells not expressing the RIPCre transgene and therefore not undergoing deletion of Irs2 to expand and repopulate the islet. In 9-month-old mice, we did not detect GFP expression and Cre-mediated recombination in pancreatic ducts, and so potentially the GFP-negative β cells could have arisen from duct cells. However, we could not detect expression of a duct cell marker within islets of 9-month-old RIPCreIrs2KO mice nor could we find insulin expres-sion in ducts. The absence of deletion in ducts also suggests that the β cell phenotype in RIPCreIrs2KO mice results from loss of
Figure 6
research article
The Journal of Clinical Investigation http://www.jci.org Volume 115 Number 4 April 2005 947
Irs2 in mature insulin-producing cells rather than any precursor or stem cell population. Taken together, these findings provide anatomical evidence that a small number of preexisting β cells that escape Irs2 deletion at an early stage in RIPCreIrs2KO mice repopu-late the islets. Our studies cannot categorically exclude the possibil-ity that duct-derived precursors expressing neither insulin nor duct markers contribute to the repopulation process. However, recent lineage tracing studies (20) suggest that proliferation of mature β
cells is the major mechanism for β cell expansion in adult mice. Our findings suggest that persistent Irs2 expression in mature β cells is required for the compensatory response to insulin resistance.
The preservation of β cell mass in NesCreIrs2KO mice dissoci-ates hypothalamic dysfunction from reduced β cell mass. It has been suggested that nestin expression is a characteristic of pan-creatic islet stem cells (26, 27), but recently lineage tracing stud-ies, utilizing the same NesCre mouse used in our studies, dem-onstrated that pancreatic exocrine, ductal, and endothelial cells but not islet endocrine cells express nestin (18, 28). The finding of increased islet mass in NesCreIrs2KO mice further supports the concept that nestin-positive cells do not contribute to the endo-crine pancreas, as deletion of Irs2 in these cells would have been anticipated to reduce β cell mass.
The hypothalamic phenotypes seen in RIPCreIrs2KO and
NesCreIrs2KO mice suggested defects in melanocortin function, and in RIPCreIrs2KO and NesCreIrs2KO mice, we detected reduced hypothalamic POMC expression. Deletion of the leptin receptor in POMC neurons generates mice that have some phenotypic features in common with RIPCreIrs2KO mice, including obesity (23). It has been suggested that RIPCre neurons are POMC neurons and that Irs2 signaling events are required for central leptin action (14, 29). Our results, however, do not confirm these findings and provide evidence to define the role and sites of Irs2 pathways in the CNS. We demonstrate that deletion of Irs2 in POMC neurons did not recapitulate the hypothalamic phenotype and that RIPCre neurons do not express POMC or NPY. Furthermore, RIPCreIRS2KO and
[image:9.585.45.539.75.382.2]NesCreIRSKO mice were sensitive to peripherally administered leptin at 6 weeks of age. Five-week-old RIPCreIRS2KO and NesCreIRSKO mice are hyperphagic but not hyperleptinemic, which suggests that elevated leptin levels seen at later ages result from greater adiposity due to increased energy intake rather than primary central leptin resistance. This is consistent with the observation that central leptin administration to Irs2-null mice causes reduction in fat mass (12). Young nonobese hyperphagic melanocortin 4 receptor–null mice, which resemble RIPCreIRS2KO and NesCreIRSKO mice, are sensitive
Figure 7
research article
948 The Journal of Clinical Investigation http://www.jci.org Volume 115 Number 4 April 2005 to the anorexigenic effects of leptin but develop leptin resistance
as they become obese (30). In preliminary observations, mice lack-ing Irs2 in AgRP neurons, generated using an AgRPCre transgenic mouse (31), also do not develop a marked hypothalamic phenotype (H. Al-Qassab et al., unpublished observations). Therefore, these studies implicate Irs2 signaling in neurons distinct from POMC and AgRP/NPY populations in the regulation of energy homeosta-sis and growth and suggest that Irs2 is not an obligatory compo-nent of CNS leptin signaling pathways.
Electrophysiological analysis showed that RIPCre neurons depo-larized in response to insulin and MTII, which suggests that they could be mediating the effects of insulin in the CNS in a mela-nocortin-sensitive neuronal pathway. Furthermore, we found no electrophysiological effect of leptin upon arcuate RIPCre neurons, which suggests that this is not a leptin-sensitive neuronal popula-tion and therefore may explain why RIPCreIRS2KO mice are not leptin resistant. In contrast, leptin depolarized and insulin hyper-polarized POMC neurons. These opposite effects upon neuronal activity perhaps explain the lack of phenotype in POMCCreIrs2KO
mice and distinguish RIPCre neurons electrophysiologically from both POMC and NPY neurons (21, 32). It remains possible that the RIPCre neurons in other hypothalamic regions such as the VMH may be mediating the effects of leptin, and we have started to examine this possibility using additional mouse mutants. How-ever, our observation of leptin sensitivity in the NesCreIrs2KO mice suggests that CNS Irs2 is not required for leptin action.
Our studies have demonstrated that CNS Irs2 pathways acting in a neuronal population distinct from POMC and NPY neurons regulate energy homeostasis and growth. Arcuate RIPCre neurons are targets for insulin and melanocortin but not leptin action, but it remains to be determined what neuropeptides and transmitters are expressed in this population. Irs2 in β cells is required for the maintenance of β cell mass, but β cells that escape Cre-mediated recombination are able to repopulate islets with time. Our obser-vations clarify the role of Irs2 in β cell function and energy homeo-stasis and suggest that modulation of Irs2 function may be of use in the treatment of diabetes and obesity.
Methods
Generation of floxed allele of Irs2 and genotyping strategies for Irs2lox and Cre and ZEG transgenic mice. The murine Irs2 gene was cloned from a 129Sv mouse genomic PAC library. We cloned 2.8 kb of 5′ homology from the Irs2 locus upstream of a floxed neomycin cassette using appropriate linkers. The Irs2
coding region was subcloned with linkers, introducing a loxP site 3′ to the
Irs2 coding region. A 3-kb fragment of 3′ region of the Irs2 locus was cloned downstream of this loxP site using linkers to generate the final construct (Figure 1A). 129Sv/EvTac1 ES cells were transfected with Pac1-linearized targeting construct by electroporation. Cells were subjected to selection with G418 and ganciclovir; surviving clones were expanded and genomic DNA extracted and subjected to analysis by PCR and Southern blotting to detect homologous recombination (Figure 1, B–D). Targeted clones were subsequently transfected with Cre recombinase plasmid to remove the neomycin cassette and screened by Southern blotting and PCR (Figure 1, C and D). ES cells were injected into blastocysts derived from C57BL/6J mice, which were implanted into pseudopregnant CD-1 foster mothers. Chimeric male mice were bred with C57BL/6J mice and germ-line transmission con-firmed by PCR and Southern blot analysis. Irs2lox mice were intercrossed with C57BL/6J RIPCre and C57BL/6J NesCre mice obtained from the Jack-son Laboratory (33, 34) to generate compound heterozygous mice. Double-heterozygous mice were crossed with Irs2lox mice to obtain WT, Irs2lox/lox, Cre,
and CreIrs2lox/lox mice. Mice lacking Irs2 in RIPCre-expressing cells were desig-nated RIPCreIrs2KO and in nestin Cre–expressing cells NesCreIrs2KO. POMCCre mice were generated using a BAC transgenic approach (35). POMCCre mice were intercrossed with Irs2lox mice and bred as described above to obtain
POMCCreIrs2KO mice. ZEG mice, which carry a Cre-activated GFP transgene (16), or Rosa26lacZ indicator mice (17) were intercrossed with the RIPCre and
POMCCre mice and Irs2lox mice to obtain mice that express GFP or lacZ in
RIPCre- or POMCCre-expressing cells as well as mice that also lack Irs2 and express the indicator gene. Mice were maintained on a 12-hour light/dark cycle with free access to water and standard mouse chow (4% fat, RM1; Special Diet Services) and housed in specific pathogen–free barrier facilities. Mice were handled and all in vivo studies performed with approval by the Home Office (London, United Kingdom). All knockout and transgenic mice were studied with appropriate littermate controls. Wild-type, Cre transgenic and Irs2lox/lox
mice were phenotypically indistinguishable, and equal numbers of the mice of these genotypes were used as controls. Genotyping of the mice was performed by PCR amplification of tail DNA. For Irs2lox genotyping, we used primers that flank the 3′ loxP site (Figure 1E): loxP forward, 5′ -ACTTGAAGGAAGC-CACAGTCG-3′ and loxP reverse, 5′-AGTCCACTTTCCTGACAAGC-3′. Cre
recombinase, Rosa26lacZ, and ZEG genotyping was performed as previously described (16, 17). For detection of Cre-mediated excision of Irs2, genomic DNA was isolated from pancreatic islets, hypothalami, and other tissues by heating in 50 mM NaOH at 100°C for 10 minutes. Primers located 1.1 kb upstream of the 5′ loxP site (5′-GGGAACCTGACAAGTGAATG-3′) and 0.2 kb downstream of the 3′ loxP site (loxP 5′-AGTCCACTTTCCTGACAAGC-3′) amplified a 1.3-kb product if recombination had occurred.
Immunoprecipitation and Western blotting. Tissues were removed and homogenized in lysis buffer, solubilized for 30 minutes on ice, and clari-fied by centrifugation. Supernatants were immunoprecipitated for 2 hours with an anti-Irs2 antibody as described (10). Immune complexes were col-lected with 100 μl of 50% slurry of protein A-sepharose, washed with lysis buffer, resolved on 7.5% SDS-PAGE, and transferred to nitrocellulose. The blots were probed with polyclonal antibody against Irs2 and enhanced che-miluminescence (Amersham Biosciences) detection.
Metabolic studies. Body weights were determined using a Sartorius BP610 balance. Nose to anus length was measured either postmortem or in anes-thetized mice, with the observer blinded to genotype. Blood samples were collected from mice via tail vein bleeds or from cardiac puncture performed on terminally anesthetized mice. Blood glucose was measured using a Glu-cometer Elite (Bayer Corp.). We determined plasma insulin levels using an ultrasensitive rat insulin ELISA (Crystalchem Inc.) using a mouse standard and leptin levels using a mouse leptin ELISA (Crystalchem Inc.). Glucose tolerance tests were performed on mice after a 16-hour overnight fast. Ani-mals were injected intraperitoneally with D-glucose (1.5 g/kg) and blood
glucose levels determined at the time points indicated in Figure 3, B and C.
Food intake and leptin and treatment studies. Mice were singly housed and allowed to acclimatize for a week prior to study. Food intake and body weight were measured for 3 consecutive days at the ages indicated in the Figure 4 legend. As necessary, we acclimatized mice by subjecting them to overnight fasts and sham injections prior to the study protocol. For peripheral leptin treatment, mice were treated with either 5 mg/kg recombinant mouse leptin (R&D Systems) or vehicle injected i.p. 1 hour before lights out for 3 consecu-tive days. Food and body weights were recorded before injection, during the treatment period, and for a 3-day wash-out period following the study.
research article
The Journal of Clinical Investigation http://www.jci.org Volume 115 Number 4 April 2005 949 in potassium PBS (KPBS), pH 7.4, blocked with 2% serum in KPBS/0.4%
Triton X-100 (KPBS-T) for 1 hour at room temperature, and then incu-bated with primary antibodies in KPBS-T for 48 hours at 4°C. Slices were incubated with appropriate secondary antibodies for 1 hour in KPBS-T before being washed in KPBS. For chromogenic detection, slices were incubated for 60 minutes in avidin-DH/biotinylated HRP (ABC Elite; Vector Laboratories) in KPBS-T and washed in KPBS, then in 150 mM sodium acetate, and nickel-enhanced detection was performed with a 3,3′ -diaminobenzidine substrate kit for peroxidase (Vector Laboratories). For some anti-αMSH staining experiments, mice were treated with intracere-broventricular colchicine (2 μl of 20 mg/ml solution in 0.9% saline infused over 10 minutes into the lateral ventricle) 24 hours prior to perfusion fixation and biotinylated tyramide amplification and fluorescent detec-tion with streptavidin-conjugated Alexa Fluor 594 (Invitrogen Corp.) were used. Slices were mounted on polylysine-coated microscope slides and coverslipped with buffered glycerol. Primary antibodies used were rab-bit anti-Irs2 antibody (United Biomedical Inc.), sheep anti-NPY (Chemi-con International), sheep anti-αMSH (Chemicon International), mouse monoclonal anti-GFP (Chemicon International), and mouse monoclonal anti-lacZ (Promega). For combined ISH and ICC, ISH was performed first under RNAse-free conditions. In brief, sections on slides were fixed in formaldehyde solution for 20 minutes on ice, washed twice in PBS for 5 minutes, and acetylated at room temperature for 10 minutes in 0.1 M tri-ethanolamine (pH 8.0) with acetic acid anhydride. After washing, sections were dehydrated and air dried for 30 minutes. Hybridization buffer con-taining 2 ng/μl digoxigenin-labeled (DIG-labeled) probe was applied and sections covered with glass coverslips and hybridized overnight at 60°C. Sections were placed in 4× SSC to remove coverslips, RNase A treated for 30 minutes at 37°C, and washed in 2× SSC at 6°C for 10 minutes, 1×
SSC at 6°C for 10 minutes, 0.5× SSC at 60°C twice for 10 minutes, and 0.1× SSC at 60°C for 30 minutes. Sections were cooled to room tempera-ture in 0.1× SSC, and we used alkaline phosphatase–conjugated anti-DIG antibody to detect bound DIG-labeled probe (Roche Diagnostics Ltd.) as described above. We generated ISH riboprobes using mouse sequences (POMC, GenBank accession number NM_008895; NPY, GenBank acces-sion number NM_023456). Imaging was performed with an Olympus BX51 microscope with either a Hamamatsu 95 black-and-white camera or a Jenoptik ProgRes C14 color camera combined with SimplePCI cap-ture and deconvolution software (version 5.2.1, Compix Inc.). Confocal microscopy was performed on a Bio-Rad MRC1000 microscope. Colocal-ization of either POMC or NPY with GFP was scored in 4 arcuate sections from each of 4 RIPCreZEG mice by 2 independent observers.
Pancreatic ICC and measurement of islet mass and number. Pancreata were removed, cleared of fat and lymph nodes, fixed in Bouins solution, embed-ded in paraffin, and cut into 5-μm sections. For GFP detection, pancreata were harvested from paraformaldehyde-perfused mice as described above. For insulin staining, sections were incubated with blocking solution con-taining PBS buffer with 5% normal chicken serum and 2% BSA for 30 min-utes, and mouse anti-insulin antibody (clone K36aC10; Sigma-Aldrich) was then applied for 2 hours at room temperature or overnight at 4°C. The sections were then incubated with chicken anti-mouse IgG–AlexaFluor 488 conjugate (Invitrogen Corp.) for 2 hours at room temperature. Transmit-ted light and fluorescent images were captured as described above. For quantification of β cell area, we analyzed 5 pancreata per genotype at each time point using 4 sections at least 150 μm apart from each other. For each section, the total area occupied by insulin-positive cells was scored using SimplePCI software. Results are expressed as the percentage of the total pancreatic area. Pancreatic ducts were labeled with biotinylated DBA lectin (Vector Laboratories), detection performed with fluorescently labeled streptavidin 610 (Invitrogen Corp.), and DAPI used to identify nuclei.
Islet isolation. Mice were sacrificed, the common bile duct cannulated, and its duodenal end occluded by clamping. Two milliliters of collagenase V solution (1 mg/ml in HBSS) was injected into the duct to distend the pancreas. The pancreas was excised, incubated at 37°C for 15 minutes, and mechanically disrupted in 10 ml of HBSS. Cellular components were collected by centrifugation (220 g for 1 minute) and resuspended in 10 ml of HBSS. Islets were handpicked under a microscope and washed once in HBSS. Islets were centrifuged at 15,600 g for 5 minutes and stored at –20°C until DNA or protein extraction.
mRNA quantification by RT-PCR analysis. Hypothalami were removed from fasted mice, homogenized in Trizol reagent (Invitrogen Corp.), and 1 μg RNA was reverse transcribed using Taqman reagents (Applera Ltd.). Quan-titative PCR was carried out with first-strand cDNA with primers for hypo-thalamic feeding peptides (23), using hypoxanthine ribosyl transferase as an internal control on an ABI Prism 7900HT sequence detection system, with SYBR green reagents (Applied Biosystems Inc.), and data analyzed according to the 2–ΔΔCT method (36).
Electrophysiology. Male RIPCreZEG and POMCCreZEG mice (8–16 weeks old) were killed by cervical dislocation. Brains were rapidly transferred to a ice-cold slicing solution containing 2.5 mM KCl, 1.25 mM NaH2PO4,
28 mM NaHCO3, 0.5 mM CaCl2, 7 mM MgCl2, 7 mM D-glucose, 1 mM
ascorbate, 3 mM pyruvate, and 235 mM sucrose and equilibrated with 95% O2/5% CO2 to give a pH of 7.4, and 350-μm coronal brain slices were
prepared using a Vibratome Series 1000. Arcuate nucleus slices were kept at room temperature in a normal external solution containing 125 mM NaCl, 2.5 mM KCl, 1.25 mM NaH2PO4, 25 mM NaHCO3, 2 mM CaCl2,
1 mM MgCl2, 10 mM D-glucose, 15 mM D-mannitol, 1 mM ascorbate,
and 3 mM pyruvate equilibrated with 95% O2/5% CO2, pH 7.4. For
whole-cell recordings, slices were continuously perfused with normal external solution (in the absence of ascorbate and pyruvate and with CaCl2 and
MgCl2 concentrations adjusted to 0.5 and 2.5 mM, respectively) at a rate of
5–10 ml/min. Neurons were identified using epifluorescence and differ-ential interference contrast optics using an upright Zeiss Axioskop 2 FS plus microscope. Borosilicate patch pipettes (5–8 MΩ) were filled with an internal solution containing 130 mM potassium gluconate, 10 mM KCl, 0.5 mM EGTA, 10 mM HEPES, 1 mM NaCl, 0.28 mM CaCl2, 3 mM MgCl2,
3 mM NaATP, 0.3 mM tris-GTP, 14 mM phosphocreatine (pH 7.2). Data were recorded and stored on digital audio tape, which enabled off-line analysis. We examined changes in input resistance by monitoring membrane poten-tial responses to negative, rectangular current pulses (5–20 pA, 200 ms, 0.05 Hz) injected via the recording electrode. Application of drugs was made via the bath perfusion system or locally by pressure ejection from a broken pipette (approximately 5-μm tip) positioned approximately 50 μm above the recorded neuron at the concentrations indicated.
MRI and magnetic resonance spectroscopy. Mice were scanned using a 4.7T Varian system under isoflurane anesthesia. Whole-body images (between 50 and 60 slices; 2 mm thick) were obtained for each mouse using a spin-echo sequence (TR4500/TE20). Semiautomatic image segmentation soft-ware (sliceOmatic version 4.2; Tomovision) was used to separate and quan-tify tissue volumes (37). For adipose tissue, the volume was multiplied by a correction factor of 0.9 in order to account for hydration (38).
Statistical analysis. All statistics were performed using GraphPad Prism 4 software and paired and unpaired Student’s t tests and 2-way ANOVA, with Bonferroni post-hoc tests performed as appropriate.
Acknowledgments
confo-research article
950 The Journal of Clinical Investigation http://www.jci.org Volume 115 Number 4 April 2005 cal microscopy. We thank the Biological Imaging Centre (BIC),
Imaging Sciences Department, Imperial College London, for assistance with the MRI studies. The work was supported by grants from the Wellcome Trust (to A. Choudhury, C. Selman, M.A. Smith, M. Simmgen, K. Hisadome, M.L.J. Ashford, and D.J. Withers); the Biotechnology and Biological Sciences Research Council (BBSRC) (to M. Claret); the Medical Research Council (MRC; to H. Al-Qassab, I. Diakonov, J.D. Bell, R.L. Batterham, and D.J. Withers); Diabetes UK (to A. Choudhury and D.C. Bed-ford);the NIH (DK-48506, to G.S. Barsh); the Stanford Bio-X Interdisciplinary Initiatives Program (to G.S. Barsh); and by an AstraZeneca BBSRC CASE award (to H. Heffron). Part of this work was conducted within the BetaCellTherapy consortium that is supported as an integrated project by the sixth European
Union–framework program. R.L. Batterham is an MRC Clinician Scientist. D.J. Withers is an MRC Senior Clinical Fellow.
Received for publication January 10, 2005, and accepted in revised form February 22, 2005.
Address correspondence to: Dominic Withers, Centre for Dia-betes and Endocrinology, Rayne Institute, University College London, 5 University Street, London WC1E 6JJ, United King-dom. Phone: 44-20-7679-6586; Fax: 44-20-7679-6211; E-mail: [email protected].
Agharul I. Choudhury, Helen Heffron, Mark A. Smith, and Hind Al-Qassab contributed equally to this work.
1. DeFronzo, R.A. 1997. Pathogenesis of type 2 diabe-tes: metabolic and molecular implications for iden-tifying diabetes genes. Diabetes Rev.5:177–268. 2. Kulkarni, R.N., et al. 1999. Tissue-specific
knock-out of the insulin receptor in pancreatic beta cells creates an insulin secretory defect similar to that in type 2 diabetes. Cell.96:329–339.
3. Woods, S.C., Lotter, E.C., McKay, L.D., and Porte, D., Jr. 1979. Chronic intracerebroventricular infusion of insulin reduces food intake and body weight of baboons. Nature.282:503–505. 4. Bruning, J.C., et al. 2000. Role of brain insulin
receptor in control of body weight and reproduc-tion. Science.289:2122–2125.
5. Obici, S., Feng, Z., Karkanias, G., Baskin, D.G., and Rossetti, L. 2002. Decreasing hypothalamic insulin receptors causes hyperphagia and insulin resistance in rats. Nat. Neurosci.5:566–572. 6. Air, E.L., et al. 2002. Small molecule insulin
mimet-ics reduce food intake and body weight and prevent development of obesity. Nat. Med.8:179–183. 7. Withers, D.J. 2001. Insulin receptor substrate
pro-teins and neuroendocrine function. Biochem. Soc. Trans.29:525–529.
8. Tamemoto, H., et al. 1994. Insulin resistance and growth retardation in mice lacking insulin recep-tor substrate-1. Nature.372:182–186.
9. Araki, E., et al. 1994. Alternative pathway of insulin signalling in mice with targeted disruption of the IRS-1 gene. Nature.372:186–190.
10. Withers, D.J., et al. 1998. Disruption of IRS-2 causes type 2 diabetes in mice. Nature.391:900–904. 11. Burks, D.J., et al. 2000. IRS-2 pathways integrate
female reproduction and energy homeostasis.
Nature.407:377–382.
12. Suzuki, R., et al. 2004. Both insulin signaling defects in the liver and obesity contribute to insu-lin resistance and cause diabetes in Irs2(–/–) mice.
J. Biol. Chem.279:25039–25049.
13. Lin, X., et al. 2004. Dysregulation of insulin receptor substrate 2 in β cells and brain causes obesity and diabetes. J. Clin. Invest.114:908–916. doi:10.1172/JCI200422217.
14. Kubota, N., et al. 2004. Insulin receptor substrate 2 plays a crucial role in β cells and the
hypothala-mus. J. Clin. Invest.114:917–927. doi:10.1172/ JCI200421484.
15. Brady, M.J. 2004. IRS2 takes center stage in the development of type 2 diabetes. J. Clin. Invest.
114:886–888. doi:10.1172/JCI200423108. 16. Novak, A., Guo, C., Yang, W., Nagy, A., and Lobe,
C.G. 2000. Z/EG, a double reporter mouse line that expresses enhanced green fluorescent protein upon Cre-mediated excision. Genesis.28:147–155. 17. Soriano, P. 1999. Generalized lacZ expression
with the ROSA26 Cre reporter strain. Nat. Genet.
21:70–71.
18. Delacour, A., Nepote, V., Trumpp, A., and Herrera, P.L. 2004. Nestin expression in pancreatic exocrine cell lineages. Mech. Dev.121:3–14.
19. Kubota, N., et al. 2000. Disruption of insulin recep-tor substrate 2 causes type 2 diabetes because of liver insulin resistance and lack of compensatory beta-cell hyperplasia. Diabetes.49:1880–1889. 20. Dor, Y., Brown, J., Martinez, O.I., and Melton, D.A.
2004. Adult pancreatic beta-cells are formed by self-duplication rather than stem-cell differentia-tion. Nature.429:41–46.
21. Cowley, M.A., et al. 2001. Leptin activates anorexi-genic POMC neurons through a neural network in the arcuate nucleus. Nature.411:480–484. 22. Withers, D.J., et al. 1999. Irs-2 coordinates Igf-1
receptor-mediated beta-cell development and peripheral insulin signalling. Nat. Genet.23:32–40. 23. Balthasar, N., et al. 2004. Leptin receptor signal-ing in POMC neurons is required for normal body weight homeostasis. Neuron.42:983–991. 24. Leibiger, I.B., Leibiger, B., Moede, T., and Berggren,
P.O. 1998. Exocytosis of insulin promotes insulin gene transcription via the insulin receptor/PI-3 kinase/p70 s6 kinase and CaM kinase pathways.
Mol. Cell.1:933–938.
25. Kulkarni, R.N., et al. 1999. Altered function of insulin receptor substrate-1-deficient mouse islets and cultured beta-cell lines. J. Clin. Invest.
104:R69–R75.
26. Zulewski, H., et al. 2001. Multipotential nestin-posi-tive stem cells isolated from adult pancreatic islets differentiate ex vivo into pancreatic endocrine, exo-crine, and hepatic phenotypes. Diabetes.50:521–533.
27. Lumelsky, N., et al. 2001. Differentiation of embry-onic stem cells to insulin-secreting structures simi-lar to pancreatic islets. Science.292:1389–1394. 28. Treutelaar, M.K., et al. 2003. Nestin-lineage cells
contribute to the microvasculature but not endo-crine cells of the islet. Diabetes.52:2503–2512. 29. Tobe, K., et al. 2001. Increased expression of the
sterol regulatory element-binding protein-1 gene in insulin receptor substrate-2(–/–) mouse liver.
J. Biol. Chem.276:38337–38340.
30. Marsh, D.J., et al. 1999. Response of melanocortin-4 receptor-deficient mice to anorectic and orexigenic peptides. Nat. Genet.21:119–122.
31. Kaelin, C.B., Xu, A.W., Lu, X.Y., and Barsh, G.S. 2004. Transcriptional regulation of agouti-related protein (Agrp) in transgenic mice. Endocrinology.
145:5798–5806.
32. Roseberry, A.G., Liu, H., Jackson, A.C., Cai, X., and Friedman, J.M. 2004. Neuropeptide Y-mediated inhibition of proopiomelanocortin neurons in the arcuate nucleus shows enhanced desensitization in ob/ob mice. Neuron.41:711–722.
33. Postic, C., et al. 1999. Dual roles for glucokinase in glucose homeostasis as determined by liver and pancreatic beta cell-specific gene knock-outs using Cre recombinase. J. Biol. Chem.274:305–315. 34. Tronche, F., et al. 1999. Disruption of the
glucocor-ticoid receptor gene in the nervous system results in reduced anxiety. Nat. Genet.23:99–103. 35. Xu, A.W., et al. 2005. PI3K integrates the action of
insulin and leptin on hypothalamic neurons. J. Clin. Invest.115:951–958. doi:10.1172/JCI200524301. 36. Livak, K.J., and Schmittgen, T.D. 2001. Analysis of
relative gene expression data using real-time quan-titative PCR and the 2(-Delta Delta C(T)) Method.
Methods.25:402–408.
37. Ross, R., Leger, L., Guardo, R., De Guise, J., and Pike, B.G. 1991. Adipose tissue volume measured by magnetic resonance imaging and computerized tomography in rats. J. Appl. Physiol.70:2164–2172. 38. Tang, H., Vasselli, J.R., Wu, E.X., Boozer, C.N., and