© 2016, IRJET ISO 9001:2008 Certified Journal Page 564
Superior Technique to Cluster Large Objects
Ms.T.Mythili
1, Ms.R.D.Priyanka
2, Dr.R.Sabitha
31Assistant Professor, Dept. of Information Technology, Info Institute of Engg., Tamilnadu, India 2Assistant Professor, Dept. of CSE, Info Institute of Engg., Tamilnadu, India
3Associate Professor, Dept. of Information Technology, Info Institute of Engg., Tamilnadu, India
---***---Abstract -
Data Mining (DM) is the science of extractinguseful and non-trivial information from the huge amounts of data that is possible to collect in many and diverse fields of science, business and engineering. One of the most widely studied problems in this area is the identification of clusters, or densely populated region, in a multidimensional dataset. Cluster analysis is a primary method for database mining. It is either used as a standalone tool to get insight into the distribution of a data set, e.g. to focus further analysis and data processing, or as a pre-processing step for other algorithms operating on the detected clusters The clustering problem has been addressed by researchers in many disciplines; this reflects its broad appeal and usefulness as one of the steps in exploratory data analysis. In this paper we examine the problem of clustering on adult dataset using
Ordering Points To Identify the Clustering Structure (OPTICS) algorithm. The various Optimisation techniques like ACO, PSO and Genetic Algorithm are applied to the algorithm to find the best that has the highest accuracy and less execution time. The adult dataset contains the information regarding the individual’s, which was extracted from the census dataset and was originally obtained from the UCI Repository of Machine Learning Databases. The idea is that it does not produce clustering of data set explicitly; but instead creates an augmented ordering of the database representing its density-based clustering structure. This cluster-ordering contains information which is equivalent to the density based clustering corresponding to a broad range of parameter settings. When Particle Swarm Optimisation (PSO) is applied to the algorithm, it performs well in terms of execution time and accuracy.
Key Words: Data mining, Clustering, OPTICS, Optimisation techniques, Feature Selection
1. INTRODUCTION
Data mining refers to extracting or mining knowledge from large amounts of data [1]. Clustering is the unsupervised classification of patterns (observations, data items, or feature vectors) into groups (clusters). It is the division of data into groups of similar objects. Representing the data by fewer clusters necessarily loses certain fine details, but achieves simplification. It models data by its clusters [2]. Data mining deals with large databases that impose on clustering analysis additional severe computational requirements. The ultimate goal of clustering is to assign
points to a finite system of k subsets, clusters. Usually subsets do not intersect, and their union is equal to a full dataset with possible exception of outliers.
This paper deals with the implementation of the OPTICS algorithm [3] along with the various feature selection algorithms [5] on adult dataset. The adult dataset contains the information regarding the people, which was extracted from the census dataset and was originally obtained from the UCI Repository of Machine Learning Databases [4]. This paper is organized as follows. The problem statement is discussed in section 2. Related work on density based clustering is discussed in section 3. In section 4, the basic notions of density-based clustering are defined and the methodology is discussed. The various feature selection techniques are focused in section 5. Section 6 deals with the implementation and results. Section 7 summarizes the work.
2. PROBLEM STATEMENT
Data analysis underlies many computing applications, either in a design phase or as part of their on-line operations. Data analysis procedures can be dichotomized as either exploratory or confirmatory, based on the availability of appropriate models for the data source, but a key element in both types of procedures is the grouping, or classification of measurements based on either:
(i) goodness-of-fit to a postulated model, or (ii)natural groupings (clustering) revealed
through analysis.
© 2016, IRJET ISO 9001:2008 Certified Journal Page 565 label. The variety of techniques for representing data,
[image:2.595.67.254.174.320.2]measuring proximity (similarity) between data elements, and grouping data elements has produced a rich and often confusing assortment of clustering methods. [7]
Figure 2.1 Data Clustering
3. RELATED WORK
3.1 Motivation
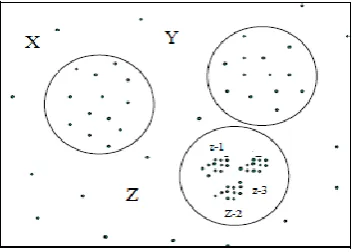
An important property of many real-data sets is that their intrinsic cluster structure cannot be characterized by global density parameters. Very different local densities may be needed to reveal clusters in different regions of the data space. For example, for the data set depicted in figure 3.1, it is not possible to detect the clusters X, Y, Z1, Z2, and Z3 simultaneously using one global density parameter. A global density-based decomposition would consist only of the clusters X, Y, and Z, or Z1, Z2, and Z3. In the second case, the objects from Xand Yare noise. The first alternative to detect and analyze such clustering structures is to use a hierarchical clustering algorithm, for instance the single-link method. This alternative, however, has two drawbacks. First, in general it suffers considerably from the single-link effect, i.e. from the fact that clusters which are connected by a line of few points having a small inter-object distance are not separated. Second, the results produced by hierarchical algorithms, i.e. the dendrograms, are hard to understand or analyze for more than a few hundred objects. The second alternative is to use a density-based partitioning algorithm with different parameter settings. There are various number of possible parameter values to be applied. Even if we use a very large number of different values - which requires a lot of secondary memory to store the different cluster memberships for each point. The basic idea to
overcome these problems is to use an algorithm such as OPTICS which produces a special order of the database with respect to its density-based clustering structure containing the information about every
clustering level of the data set (up to a “generating distance” e), and is very easy to analyze.[3]
Figure 3.1 Clusters with respect to different density
parameters [3]
4. Density-Based Clustering
The key idea of density-based clustering is that for each object of a cluster the neighborhood of a given radius (e) has to contain at least a minimum number of objects (MinPts), i.e. the cardinality of the neighborhood has to exceed a threshold. [3]
4.1 OPTICS algorithm
The algorithm OPTICS creates an ordering of a database, additionally storing the core-distance and a suitable reachability-distance for each object. This information is sufficient to extract all density-based clusterings with respect to any distance e’ which is smaller than the generating distance e from this order. A file OrderedFile is opened for writing and it is closed at the end of the loop. Each object from a database SetOfObjects is simply handed over to a procedure ExpandClusterOrder if the object is not yet processed.
Figure 4.1 Algorithm [3]
OPTICS (SetOfObj, e, MinPts, OrderedFile)
OrderedFile.open();
FOR i FROM 1 TO SetOfObj.size DO
Object := SetOfObj.get(i);
IF NOT Obj.Processed THEN
ExpandClusterOrder(SetOfObj, Obj, e,
MinPts, OrderedFile)
OrderedFile.close();
[image:2.595.345.522.187.313.2]© 2016, IRJET ISO 9001:2008 Certified Journal Page 566 5. FEATURE SELECTION
[image:3.595.52.273.414.558.2]Feature selection is one of the important and frequently used techniques in data preprocessing for data mining. It reduces the number of features, removes irrelevant, redundant, or noisy data, and brings the immediate effects for applications: speeding up a data mining algorithm, improving mining performance such as predictive accuracy and result comprehensibility. Feature selection is a process that selects a subset of original features. The optimality of a feature subset is measured by an evaluation criterion. As the dimensionality of a domain expands, the number of features N increases. Finding an optimal feature subset is usually intractable and many problems related to feature selection have been shown to be NP-hard. A typical feature selection process consists of four basic steps namely, subset generation, subset evaluation, stopping criterion, and result validation. Subset generation is a search procedure [8] that produces candidate feature subsets for evaluation based on a certain search strategy. Each candidate subset is evaluated and compared with the previous best one according to a certain evaluation criterion.
Figure. 5.1 Four key steps of feature selection.[8]
If the new subset turns out to be better, it replaces the previous best subset. The process of subset generation and evaluation is repeated until a given stopping criterion is satisfied. Then, the selected best subset usually needs to be validated by prior knowledge or different tests via synthetic and/or real world data sets. The four key steps as shown in the figure 5.1. [8]
5.1 OPTIMIZATION METHODS
5.1.1 Ant Colony Optimization
Ant Colony Optimization (ACO) is a paradigm for designing metaheuristic algorithms for
combinatorial optimization problems. The first algorithm which can be classified within this framework was presented in 1991 [9]. The essential trait of ACO algorithms is the combination of a priori information about the structure of a promising solution with a posteriori information about the structure of previously obtained good solutions. [10]
5.1.2 PARTICLE SWARM OPTIMISATION
Particle swarm optimization (PSO) is a swarm intelligence based algorithm to find a solution to an optimization problem in a search space, or model and predict social behaviour in the presence of objectives. Particle swarm optimization is a stochastic, population-based computer algorithm for problem solving. It is a kind of swarm intelligence that is based on social-psychological principles and provides insights into social behaviour, as well as contributing to engineering applications. [11]
5.1.3GENETIC ALGORITHM
Genetic algorithms, are numerical optimisation algorithms inspired by the nature evolution process and directed random search techniques. Genetic algorithms are optimization and machine learning algorithms based loosely on processes of biological evolution. Genetic algorithms (GA) emulate genetic evolution. The characteristics of individuals are therefore expressed using genotypes. The original form of the GA had distinct features: (1) a bit string representation, (2) proportional selection, and (3) cross-over as the primary method to produce new individuals. [12]
6. EXPERIMENTAL ANALYSIS
The OPTICS clustering algorithm was implemented on benchmark dataset ‘adult’. The algorithm was coded in JAVA language. This OPTICS clustering algorithm is applied to all the three optimisation techniques discussed in the previous chapter and the results of all the algorithms are analysed. The best feature subset selected, execution time and the accuracy are the major goals of consideration.
DATASET DESCRIPTION:
Title : Adult Dataset
© 2016, IRJET ISO 9001:2008 Certified Journal Page 567 are removed No of attributes: 6 continuous, 8
nominal, 1 class
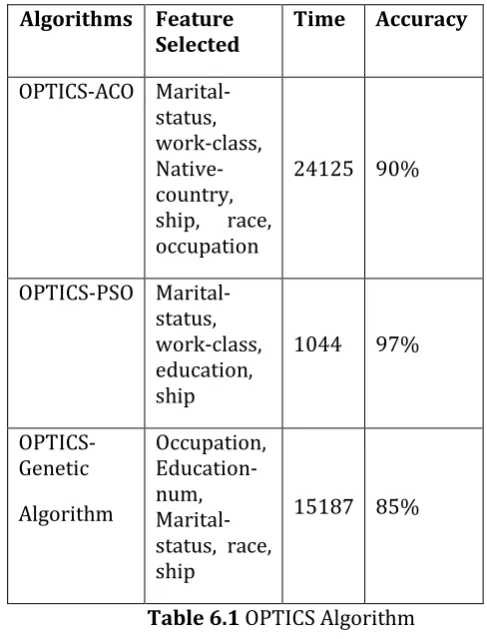
[image:4.595.311.555.133.453.2]Table 6.1 and Figure 6.1 and 6.2 shows the Execution time and Accuracy of OPTICS Algorithm.
Figure 6.1 Execution Time of Optics Algorithm
Figure 6.2 Accuracy of Optics Algorithm
7. CONCLUSION
To evaluate the efficiency and scalability of the algorithm, an extensive performance study was performed. When Particle Swarm Optimisation (PSO) is applied to the algorithm; it performs well in terms of execution time and accuracy. OPTICS with PSO has the highest accuracy of 97% and less execution time of 1044(ms). OPTICS with ACO and genetic algorithm has the accuracy of 90% and 85%. Execution time is
24125(ms) and 15187(ms). Feature subset selected varies for different number of clusters.
Algorithms Feature Selected
Time Accuracy
OPTICS-ACO Marital-status, work-class, Native-country, ship, race, occupation
24125 90%
OPTICS-PSO Marital-status, work-class, education, ship
1044 97%
OPTICS-Genetic
Algorithm
Occupation, Education-num, Marital-status, race, ship
[image:4.595.44.255.189.328.2]15187 85%
Table 6.1 OPTICS Algorithm
REFERENCES
[1] Jaiwei Han and Micheline Kamber,“Datamining:
Concepts and Techniques”, Morg Kaufman Publishers, 2001.
[2] R.Agrawal, T.Imielinski and A. Swami, “Mining
Association Rules between Sets of Items in Large Databases”, Proc.1993. ACM SIGMOD Int’l. Conf. Management of Data, pp.207-216, Washington, D.C., May, 1993.
[3] Mihael Ankerst, Markus M. Breunig, Hans- Peter Kriegel,
Jörg Sander, “OPTICS: Ordering Points To Identify the Clustering Structure”, In Proc. ACM SIGMOD’99 Int. Conf. on Management of Data, Philadelphia PA, 1999.
[4] UCI Repository of Machine Learning databases,
University of California, Irvine, dept. of Information and Science. http://www.ics.uci.ed/~mlearn/MLRepository.html
[5] L. Talavera, “Feature Selection as a Preprocessing Step
for Hierarchical Clustering,” Proc. Int’l Conf. Machine Learning (ICML ’99), pp. 389-397, 1999.
[6] Ester M., Kriegel H.-P., Sander J., Xu X.: “A Density-Based
[image:4.595.21.246.411.586.2]© 2016, IRJET ISO 9001:2008 Certified Journal Page 568
[7] ANDERBERG, M. 1973, “Cluster Analysis and
Applications”, Academic Press, New York.
[8] H. Liu and H. Motoda, Feature Selection for Knowledge
Discovery and Data Mining. Boston: Kluwer Academic, 1998.
[9] A. Colorni, M. Dorigo, and V. Maniezzo, Distributed
optimization by ant colonies, Proceedings of ECAL'91, European Conference on Artificial Life, Elsevier Publishing, Amsterdam, 1991.
[10] M. Dorigo, Ant colony optimization
http://iridia.ulb.ac.be/mdorigo/ACO/ACO.html.
[11] J. Kennedy, and R.C. Eberhart. Particle swarm
optimization. In Proceedings IEEE International Conference on Neural Networks, Vol. IV, pp. 1942-1948, 1995.
[12] Coley, A D., 1999. An Introduction to Genetic Algorithms
![Figure. 5.1 Four key steps of feature selection.[8]](https://thumb-us.123doks.com/thumbv2/123dok_us/8198176.814944/3.595.52.273.414.558/figure-key-steps-feature-selection.webp)