© 2015, IRJET ISO 9001:2008 Certified Journal Page
48
A STUDY ON PROBABILITY FAILURE OF A COLUMN IN RC FRAME BY
VARYING LIVE LOAD
Manjunath J
1, Dr. K Manjunath
2, Naveen Kumar S
3, Sunil Kumar M S
41
M.Tech Student, Civil Engineering, PESCE Mandya, Karnataka, India
2Professor & HOD, Civil Engineering, MCE Hassan, Karnataka, India
3Assistant Professor, Civil Engineering, PESCE Mandya, Karnataka, India
4
Assistant Professor, CT&M Engineering, SJCE Mysore, Karnataka, India
---***---Abstract -
The present method of designing Reinforced Concrete Columns is based on limit state philosophy which makes use of partial safety factors for material strengths and loads. However, the overall safety of column as a member and the probability of failure of a column against a given load is not explicitly obtained. The design variables being random, it becomes much more important to assess the level of safety in the probabilistic design situation. Column being the vital most structural element, probability of failure of a column is linked to the overall safety of a structural system. With this in view, an attempt is made to assess the safety levels ensured by the design methodology of the present code of practice IS 456-2000. This requires the information on the probability distributions of the resistance part and action part in each limit state.For a particular column statistics and probability distribution of axial load with uniaxial moments are generated by digital simulation on a R.C. frame using ETABS 2013. The generated data on axial load with uniaxial moment is subjected to statistical analysis, probability modeling using program supported on MATLAB. Resistance statistics are generated using the relevant equations form IS 456-2000. Several design situations corresponding to different material grades and dimensions are considered. Probability of failure is obtained by Monte Carlo Simulation which establishes the statistics of safety margin M = R – S.
It is attempted to see if the safety level is uniform over a range of design situation.
Key Words:
Reliability Analysis, Probability of
Failure, RC Frame, Monte-Carlo Simulation
1.
INTRODUCTION
A column is an important component of reinforced concrete structures. In general, column may be defined as a member carrying direct axial load which causes compressive stresses of such magnitude that these stresses largely control its design. The evaluation of safety of a column is a task of much importance. The safety of a column depends on the resistance R, of the column and action S (load or load effects) on the column. The action is a function of loads (live load, wind load, dead load..,) which are random variables.
Similarly, the resistance or response of the column depends on the physical properties of the materials, and geometrical dimensions of column which are also subjected to statistical variations, and are probabilistic. Hence to be rational in the estimation of the structural safety, the random variations of the basic parameters are to be taken into account. Since load and strength are random variables, the safety of the column is also a statistical variable.
In the present work an attempt is made to assess the safety of a column by establishing reliability using Monte Carlo method.
2.
RELIABILITY ANALYSIS
Reliability analysis is defined as the consistent evaluation of design risk using probability theory.
The reliability is the probability of an item performing its intended function over a given period of time under the operating conditions encountered. It is important to note that the above definition stresses four significant elements namely viz Probability, Intended function, Time & Operating conditions.
2.1 Variables In Engineering Problems
© 2015, IRJET ISO 9001:2008 Certified Journal Page
49
set of questions to which there is an explicit and uniqueanswer is a deterministic approach. Example: material characteristics.
Probabilistic: A probabilistic approach is based on the concept that several or varied outcomes of a situation are possible to this approach. Uncertainty recognized as yes or no type of answer to a question concerning structural performance is considered to be simplistic. Probabilistic modeling aims at a study of a range of outcomes to a given input data.
Accordingly the description of a physical situation or system includes randomness of data and other uncertainties. The selected data for a deterministic approach would not be sufficient for a probabilistic study of the same problem. The raw data would provide a meaningful probabilistic analysis.
A probabilistic approach aims in determining the probability p, of an outcome, one of that may occur. Probability would be any percentage between p=0% and probability=100% or any value between p=0 and p=1. In a specific problem the number of likely outcomes may be limited and it may be possible to consider the probability of each outcome.
Example: Wind load, ocean-wave height, earthquake etc.
2.2 Probability
Probability theory and reliability-based design provide a formal framework for developing criteria for design, which insure that the probability of unfavorable performance is acceptably small. The overall aim of structural reliability analysis is to quantify the reliability of structures under consideration of the uncertainties associated with the resistances and loads.
The structural performance is assessed by means of models based on physical understanding and empirical data. Due to idealizations, inherent physical uncertainties and inadequate or insufficient data the models themselves and the parameters entering the models such as material parameters and load characteristics are uncertain. Structural reliability theory takes basis in the probabilistic modeling of these uncertainties and provides methods for the quantification of the probability that the structures do not fulfill the performance criteria.
2.3 Probability of failure
The achievement of absolute safety or reliability is impossible, a probabilistic approach to a evaluation of safety becomes a sensible solution which are subjected to random variables. There is a need for a rational approach to the evaluation of the structural safety, taking into account these random variations. The study of variability comes under the domain of statistics and probability. Using the probabilistic approach, there is a possibility of obtaining uniform reliability (uniform performance in
structure under different design situation). Hence probabilistic approach must be used. For convenience, the reliability, R, is defined in terms of the probability of failure, Pf, which is taken as R=1-Pf. When probability theory is used in the limit state design, the method is called probability-based limit state design.
3.
DETERMINISTIC DESIGN DETAILS
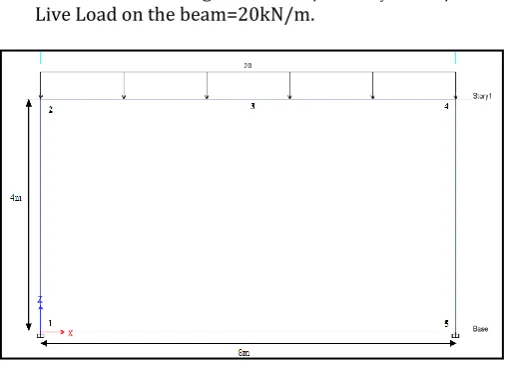
For deterministic design single bay RC Portal frame fixed at the base is considered with a following data.
3.1 Symmetrical Loading on RC frame
Height of column=4m Length of the beam=8m
Column dimension 400*600mm Beam dimension 400*700mm
Characteristic strength fck =20N/mm2 , fy=415N/mm2
Live Load on the beam=20kN/m.
Fig -1: RC frame due to symmetrical loading
[image:2.595.309.562.328.511.2]The moment and axial load is obtained at the different location by using ETABS 2013.
Table -1: Moment and Axial load of the column
Moment at different location (kN-m)
Axial Load at different location (kN)
M1/M5 M2/M4 P1/P5 P2/P4
47.52 101.29 131.98 107.99
In the deterministic design of RC frame due to symmetrical loading, the column is designed by taking M2=101.29 kN-m, P2=107.99kN and by using interaction curves of SP-16 the percentage of the steel in the column was found to be
0.8 (pt=0.8%) and the area of the steel=1920mm2.
© 2015, IRJET ISO 9001:2008 Certified Journal Page
50
In the process of codal assessment, reliability analysis ofexisting design of column as per the current codal provisions are carried out for limit state of collapse in compression and then the reliability levels of the present designs under different design situations are established. Columns subjected to axial load with uniaxial bending are considered.
4.1 Distribution of parameters
The basic design variables are identified as,
a) Geometric dimensions
b) Material properties
[image:3.595.310.557.196.310.2]c) Load
Table -2: Parameters variation
Geometric Properties Material properties Load
Breadth 3%
fck 20% Live Load
20%,40%, 60%
Depth 5%
fy 10%
Length 3%
4.2 Monte Carlo simulation
The Monte Carlo simulation is a technique used to generate the random variables whose probability distribution is known.
a) Generate random numbers between 0 to 1. (v1 &
v2)
b) The normal deviates is given by
u1=[2ln(1/v1)]0.5 cos(2v2)
u2=[2ln(1/v1)]0.5 sin(2v2)
c) Normal variates
y1=+*u1
y2=+*u2
100 data sets were randomly generated for each cross section of beam and column, height of the column, length of the beam, characteristic strength of concrete and steel, live loads and each data set varied randomly as a function of statistical models for the variables involved by using Monte-Carlo simulation in EXCEL.
4.3 Probability Design Details
In Probabilistic design methods where design parameters are considered as random. It is well known that loads (live load on floors, wind load, ocean waves, earthquake, etc.) coming on structure are random variables. Similarly, the strength of materials (strength of concrete, steel, etc.) and the geometric parameters (dimensions of section, effective depth, diameter of bars, height, length, etc.) are subjected to statistical variations. Hence, to be rational in the estimation of the structural safety, the random variations of basic parameters are to be taken into account. Since load, strength and geometric properties are random variables, the safety of the structure is also a statistical variable.
A RC portal frame considered for the deterministic analysis and design have been considered for the probabilistic analysis and design. The probabilistic design is carried out for 100 iterations for symmetrical on RC frame.
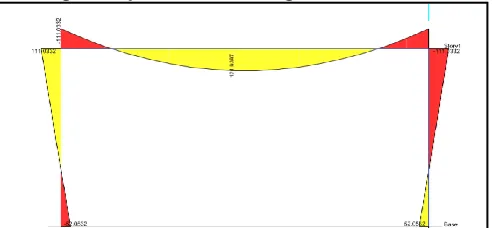
The bending moment diagram for one of the cases is shown in the fig 2 and axial loading on the frame is shown in the fig 3 for symmetrical loading on RC frame.
Fig -2: Bending moment diagram for symmetrical loading
Fig -3: Axial Load for symmetrical loading
Similarly, all the parameters are varied, the moment and axial load are obtained for 20% ,40% and 60% variation in live load. The probability failure for 20%,40% and 60% variation in live load is obtained and compared.
4.4 Probability Modeling of Action
100 data sets of values were obtained by Monte-Carlo simulation in EXCEL. The model has been made to run for 100 times in ETABS 2013 and analyzed. Moment and axial load is obtained in different position for 100 times in symmetrical and unsymmetrical loading of RC frame.
[image:3.595.31.296.290.360.2] [image:3.595.306.556.342.475.2]© 2015, IRJET ISO 9001:2008 Certified Journal Page
51
The suitability of a probabilistic model to fit the data isarrived after applying any one of the following goodness-of fit test in MATLAB.
a) Chi-square Test.
b) Kolmogorove-Smirnov (K S) Test.
It is found that Normal distribution fits the generated data well, Based on the Chi-square Test. During the reliability analysis of the present design, the resistance model is calculated by performing Monte-Carlo simulations. The variables included in the study are dimensions, material properties and load. Loads were obtained from ETABS model. The current study assumes a normal distribution for all variables.
Fig-4: Histogram for moment M1
Fig-5: Probability distribution curve for Moment M1
Fig-6: Cummulative density function for Moment M1
Fig-7: Probability Plot for Moment M1
Fig-8: Histogram for Axial Load P1
Fig-9: Probability distribution curve for Axial Load P1
Fig-10: Cummulative density function for Axial Load P1
0 10 20 30 40 50 60 70 80 90 0 5 10 15 20 25
Moment M1 (kN-m)
F r e q u e n c y M1
0 10 20 30 40 50 60 70 80 90
0 0.005 0.01 0.015 0.02 0.025
Moment M1 (kN-m)
D e n s it y M1 data M1 fit
0 10 20 30 40 50 60 70 80 90
0 0.1 0.2 0.3 0.4 0.5 0.6 0.7 0.8 0.9 1
Moment M1 (kN-m)
C u m u la ti v e p r o b a b il it y M1 data M1 fit
10 20 30 40 50 60 70 80
0.001 0.005 0.01 0.05 0.1 0.25 0.5 0.75 0.9 0.95 0.99 0.995
Moment M1 (kN-m)
P r o b a b il it y M1 data M1 fit
20 40 60 80 100 120 140 160 180 200 220 0 5 10 15 20 25
Axial Load P1 (kN)
F r e q u e n c y P1
20 40 60 80 100 120 140 160 180 200 220 0 0.002 0.004 0.006 0.008 0.01 0.012
Axial Load P1 (kN)
D e n s it y P1 data P1 fit
40 60 80 100 120 140 160 180 200
0 0.1 0.2 0.3 0.4 0.5 0.6 0.7 0.8 0.9 1
Axial Load P1 (kN)
© 2015, IRJET ISO 9001:2008 Certified Journal Page
52
Fig-11: Probability Plot for Axial Load P1
Similarly,The histogram, probability distribution curve,
cumulative density function and probability plot of the generated sample are obtained for all the moment and axial load for different location.
5.
COMPUTATION OF PROBABILITY OF FAILURE
For random variations in different grades of
concrete, characteristic strength, dimensions and live load, corresponding moment and axial values are obtained from ETABS.
Compute deterministic value of Pt.
Find Pti where i= 1, 2, 3,..., 100.(ETABS values)
If Pt < Pti then it is failure.
Compute probability of failure ,Pf=(Number of
[image:5.595.38.283.127.285.2]failure/Total number of observation)
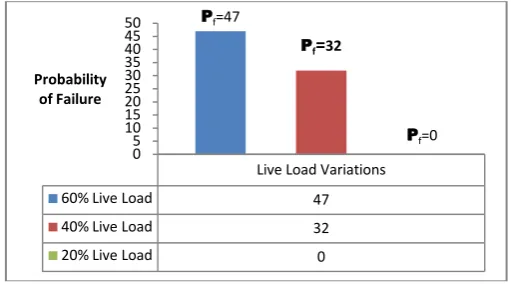
Table -3: Probability Failure
Live load 60% 40% 20%
Pf 0.47 0.32 10-6
Reliability 0.53 0.68 1
Graph 1: Probability Failure
6.
CONCLUSION
Attempt is made to quantify the safety level in terms of probability failure of a reinforced concrete frame. Basic design variables are treated as random and their statistics are collected from the literature. A typical RC frame is selected and designed using deterministic approach, as per the provision of IS 456-2000.Using ETABS software the frame is analysed and repeated for 100 times, every time using the generated values of design variables as input. The generated values of Action (S) in terms of bending moments at typical locations are statistically analysed and probabilistically modeled using MATLAB software. Probability distribution like Normal function is tried. It is observed that bending moment at different locations do follow the normal distribution as tested by Chi-Square for goodness-of-fit. K-S test is to check the goodness-of-fit of a given probability distribution to generated data. The generated values of Mu & Pu at a given section are used to generate further non-
dimensional parameters Pu/(fck*b*D) and Mu/(fck*b*D2) ,
using these non-dimension parameters P/fck is obtained
appropriate interaction curve from SP-16. Thus the value of P required is obtained. If this value of P required is greater than P provided by the deterministic design, it is considered as failure. Such failures are counted during simulation. The probability failure of column section in limit state of combined axial force and uniaxial bending is determined by the ratio of number of failure to total number of simulation. The reliability of column section as 1-Pf .It is observed that rate of failure of the column section is about 32 % or probability failure is 0.32 (40% live load), 47% or probability failure is 0.47 (60% live load), probability failure is very low i.e 0 (10-6) for 20% live load for symmetrical loading. The designers do not know the explicit level of safety when designed is done by the provision of IS 456-2000.For important structure the Pf has to keep as low as possible.
The reliability based design aims at the formulation of design procedure for a known level of reliability.
40 60 80 100 120 140 160 180 200 0.005
0.01 0.05 0.1 0.25 0.5 0.75 0.9 0.95 0.99 0.995
Axial Load P1 (kN)
P
r
o
b
a
b
i
l
i
t
y
P1 data P1 fit
Live Load Variations
60% Live Load 47
40% Live Load 32
20% Live Load 0
Pf=47
Pf=32
Pf=0
0 5 10 15 20 25 30 35 40 45 50
© 2015, IRJET ISO 9001:2008 Certified Journal Page
53
REFERENCES
1. R. Ranganathan, Reliability Analysis and Design of
Structures, Tata Mc Grawhill Publishing Company limited.
2. N.Krishna Raju, Advanced reinforced concrete
design, 2nd Edition, CBS Publishers & Distributors.
3. Alfredo H-Sang, Wilson H. Tang – Probability
Concepts in Engineering Planning and Design, Volume-2.
4. H. P. Hong and W. H. Zhou, ASCE – Reliability
analysis of RC columns, journal of Structural Engineering, Volume 125, July 1999.
5. M. Ala Saadeghvaziri and Douglas A. Foutch,
ASCE- Behavior of RC Columns under Nonproportionally varying axial loads, Journal of Structural Engineering, Volume 116, July 1990.
6. IS 456:2000 “Indian Standard Code of Practice for
Plain and Reinforced Concrete” (Fourth revision), Bureau of Indian Standards.
7. A. J. Kappos, M. K. Chryssanthopoulos and C.
Dymiotis, Uncertainty Analysis of Strength and Ductility of Confined Reinforced Concrete Members, Engineering Structures, Volume 21, September 1997.
8. Howard B. Wilson, Louis H. Turcotte and David
Halpera , Advanced Mathematics and Mechanics Applications using MATLAB, Third Edition, 2003.
9. Jin- Keun Kim and Sang Soon Lee, The behaviour
of reinforced concrete columns subjected to axial load and biaxial bending, Journal of Engineering Structures, Volume-23, 2000.
10. C. G. Trezos, Reliability considerations on the