R E S E A R C H A R T I C L E
Open Access
Exercise-induced pain changes associate
with changes in muscle perfusion in knee
osteoarthritis: exploratory outcome
analyses of a randomised controlled trial
Elisabeth Bandak
1*, Mikael Boesen
1,2, Henning Bliddal
1, Robert G. C. Riis
1,2, Sabrina Mai Nielsen
1,3, Louise Klokker
1,
Cecilie Bartholdy
1,4, Janus Damm Nybing
2and Marius Henriksen
1,4Abstract
Background:Exercise therapy is recommended for knee osteoarthritis (OA), but the underlying mechanisms of
pain relief are not fully understood. The purpose of this study was to explore the effects of exercise on muscle perfusion assessed by dynamic contrast enhanced MRI (DCE-MRI) and its association with changes in pain in patients with knee OA.
Methods:Exploratory outcome analyses of a randomised controlled study with per-protocol analyses (ClinicalTrials.
gov: NCT01545258) performed at an outpatient clinic at a public hospital in Denmark. We compared 12 weeks of supervised exercise therapy 3 times per week (ET) with a no attention control group (CG). Analyses of covariance (ANCOVA) were used to assess group mean differences in changes from baseline to week 12 in knee muscle perfusion quantified by DCE-MRI, patient-reported pain and function using the Knee Injury and Osteoarthritis Outcome Score (KOOS) questionnaire, knee extensor and flexor muscle strength tests, and the six-minute walking test (6MWT). Spearman’s correlation coefficients were used to determine the correlation between changes in DCE-MRI variables, KOOS, muscle strength, and 6MWT. The potential effect mediation of the DCE-DCE-MRI perfusion variables was investigated in a post-hoc mediation analysis.
Results:Of 60 participants randomised with knee osteoarthritis, 33 (ET,n= 16, CG,n= 17) adhered to the protocol and had complete DCE-MRI data.At follow-up, there were significant group differences in muscle perfusion changes and clinically relevant group differences in KOOS pain changes (10.7, 95% CI 3.3 to 18.1,P= 0.006) in favor of ET. There were no significant between-group differences on muscle strength and function. The changes in pain and muscle perfusion were significantly correlated (highest Spearman’s rho = 0.42,P= 0.014). The mediation analyses were generally not statistically significant.
Conclusion:The pain-reducing effects of a 12-week exercise program are associated with changes in knee muscle
perfusion quantified by DCE-MRI in individuals with knee OA, but whether the effects are mediated by muscle perfusion changes remains unclear.
Trial registration:ClinicalTrials.gov:NCT01545258, first posted March 6, 2012.
Keywords:Muscle perfusion, Exercise, Pain, Osteoarthritis
© The Author(s). 2019Open AccessThis article is distributed under the terms of the Creative Commons Attribution 4.0 International License (http://creativecommons.org/licenses/by/4.0/), which permits unrestricted use, distribution, and reproduction in any medium, provided you give appropriate credit to the original author(s) and the source, provide a link to the Creative Commons license, and indicate if changes were made. The Creative Commons Public Domain Dedication waiver (http://creativecommons.org/publicdomain/zero/1.0/) applies to the data made available in this article, unless otherwise stated.
* Correspondence:[email protected]
1The Parker Institute, Copenhagen University Hospital, Bispebjerg and
Frederiksberg, Copenhagen, Denmark
Background
Exercise therapy is recommended as first line treatment of knee osteoarthritis (OA) based on extensive research evidence on beneficial effects of exercise on pain and function [1–4]. However further investigations of the underlying mechanisms of exercise are needed in order to substantiate a possible mode of action.
The beneficial effects of exercise on knee OA pain and function may be caused by increased muscle strength, increased knee range of motion, or improvements in proprioception [5,6]. Also, a reduction of pressure-pain sensitivity in parallel with pain reduction has indicated alterations in pain processing as a mechanism of exercise [7]. The measurement instruments for these outcomes, however, are either performance-based or assessor-dependent, which lowers the objectivity of the measure and increases the risk of bias [8]. Objective measure-ments of local physiological changes are needed in order to understand the mode of action behind the symptom-atic relief caused by exercise therapy in knee OA.
Muscles are the primary tissue affected by most exer-cise types; thus, any physiological changes caused by ex-ercise are expected to be reflected in the muscles. Indeed, exercise causes physiological changes in the muscles, such as increased capillarisation or angiogenesis [9–11]. We have recently shown that more widespread muscle perfusion in the peri-articular knee muscles was associated with less pain in patients with knee OA [12]. However, no conclusions on causality between exercise-induced changes in muscle perfusion and decreased knee OA pain can be drawn based on this cross-sectional ma-terial; the association must be tested prospectively.
Dynamic Contrast Enhanced Magnetic Resonance Im-aging (DCE-MRI) is a method to quantify tissue perfu-sion through temporal variations of the MRI signal intensity following intravenous injection of a contrast agent [13]. Such quantification of localized perfusion of synovium reflects the histological degree of inflamma-tion of the synovium in both rheumatoid arthritis and end-stage knee OA [14, 15]. Furthermore, in knee OA, increased perfusion of the infrapatellar fat pad and syno-vium is associated with higher pain scores [16–18]. DCE-MRI derived perfusion is a sensitive method to as-sess skeletal muscle perfusion [19].
The purposes of this study were to explore 1) the ef-fects of a 12-week therapeutic exercise program on muscle perfusion in the peri-articular knee muscles assessed by DCE-MRI and 2) the association between changes in muscle perfusion and changes in pain, phys-ical function and performance in patients with knee OA. We hypothesized that exercise would increase muscle perfusion in parallel with improved pain, physical func-tion and performance when compared with a no-attention control intervention.
Methods Study design
This is an exploratory sub-study of a previously pub-lished randomised controlled parallel-group-trial investi-gating the effects of a 12-week exercise program on the pain sensitivity in patients with knee OA focusing on the per-protocol population [7] performed at an outpatient’s clinic at a public hospital in Denmark (2012–2013). The study was approved by the Regional Health Research Ethics Committee of The Capital Region of Denmark (H-2-2011-159) and registered prior to commencement of the trial (www.ClinicalTrials.gov: NCT01545258).
Participants
A comprehensive description of the recruitment process and inclusion/exclusion criteria is published elsewhere [7]. Briefly, eligibility criteria included age≥40 years, a clinical diagnosis of knee OA confirmed by radiography assessed by an experienced radiologist, and a body mass index between 20 and 35 kg/m2. Exclusion criteria in-cluded participation in exercise therapy within the previ-ous 3 months, having inflammatory and autoimmune diseases, and lower extremity joint replacement.
Sample size, randomisation and blinding
The sample size of the main trial was based on group differences in the primary outcome, pressure-pain threshold, and was calculated to 60 participants [7].
After baseline assessments, participants were randomly assigned (1:1 stratified by gender) to exercise therapy (ET) or to a control group (CG). A computer-generated list of random numbers was used and concealed from the researchers enrolling and assessing participants. Par-ticipants were aware of their group allocation; outcome assessors and data analysts were kept blinded to the allo-cation [7].
Interventions
The ET group was offered facility-based, functional and individualised exercise therapy supervised by a trained physiotherapist 3 times weekly for 12 weeks. A full de-scription of the.
exercise program is available in [7] and in the Add-itional file 1. Attendance at minimum 24/36 sessions was defined as protocol adherence. The CG received no attention during the 12 weeks and was requested not to engage in therapeutic exercise during study participation.
MRI protocol
clinical MRI protocol, a sagittal DCE T1 VIBE sequence was performed with a temporal resolution of 9 s and 30 repetitions. During the third repetition an intravenous injection of 0.1 ml/kg body weight Gadolinium (Gd) contrast agent (Prohance®, Bracco Diagnostics Inc., Italy) was administered (2 ml/s). The total scanning time was 30 min with the DCE-MRI sequence performed after 20 min. The full MRI protocol is available in the Additional file1.
Image analysis
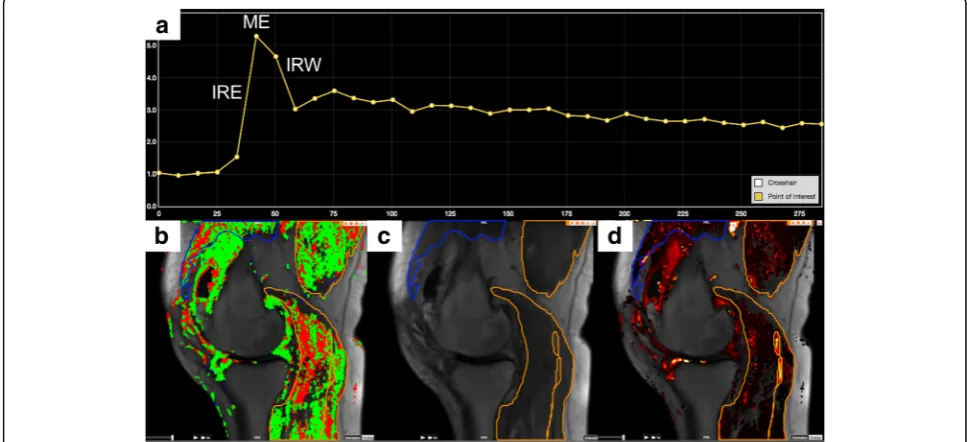
The investigator analysing the DCE-MRI images (EB) was blinded to group allocation and clinical data and su-pervised by experienced radiologists (MB and RR). Dedi-cated software (Dynamika® version 4.2.2., Image Analysis Ltd., London, UK) was used for all DCE-MRI analyses [20,21]: motion correction between temporal slices was applied, followed by determination of a baseline level of signal intensity (Fig.1a), and regions of interests (ROIs) were manually drawn on all slices around the peri-articular muscle groups: extensors (vastus lateralis, vas-tus medialis) and flexors (biceps femoris, sartorius, graci-lis, triceps surae, popliteus, semitendinosus, and semimembranosus) without delineation of individual muscles (Fig.1c). Major vascular branches were avoided. Finally, the ROIs were summed and averaged into three volumes of interest (VOIs): Extensor VOI (extensor
ROIs), Flexor VOI (flexor ROIs) and Total Muscle VOI (consisting of all ROIs).
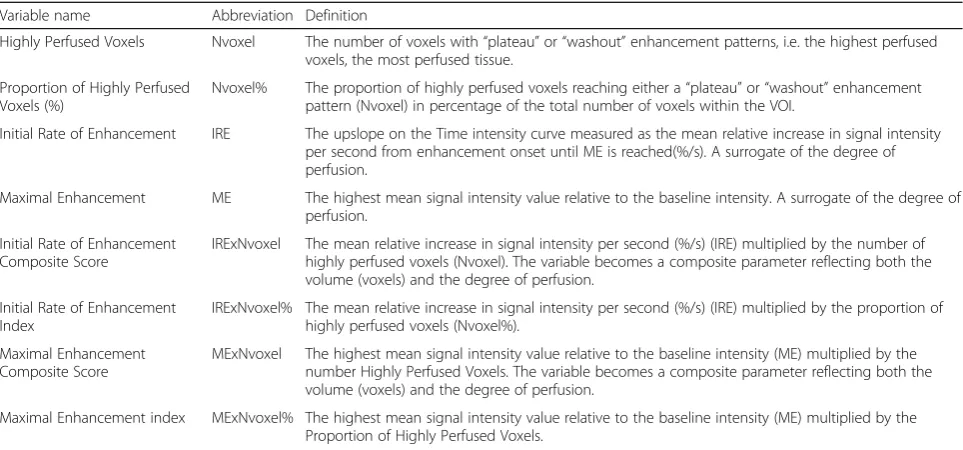
As previously described in detail [15, 21], heuristic DCE-MRI analysis is based on changes in signal intensity over time in each voxel. The signal intensity changes are calculated relatively to the baseline signal intensity and changes over time can be plotted as time-intensity-curves (TICs) (Fig. 1a). Based on a robust classification scheme [21], the dedicated software automatically as-signs each voxel, based on the shape of linear approxi-mations of the TICs, to one of four enhancement patterns (Fig.1b). The muscle perfusion parameters (see Table 1 and Additional file 1) were calculated on a voxel-by-voxel basis and averaged across each VOI [21,
22]. A pharmacokinetic parameter, Ktrans, was calculated as described in Riis et al. 2016 [16] with the T1-relaxivity values of muscle and blood set at 1420 and 1400 ms, respectively.
Outcomes
Outcomes were measured at baseline and after the 12 weeks of intervention. For the purpose of this explora-tory outcome analysis, we examined changes from base-line to follow-up, looking at the outcomes: muscle perfusion from DCE-MRI, patient-reported pain and function using the Knee Injury and Osteoarthritis Out-come Score (KOOS) questionnaire (0(worst)–100(best)
Fig. 1DCE-MRI analysis. DCE-MRI analysis is based on changes in signal intensity over time for each voxel within the VOI. The signal intensity changes calculated relatively to the baseline signal intensity and the changes over time can be plotted as time-intensity-curves (TICs):aTIC from a point of interest in the popliteal artery with the characteristics of tissue with high perfusion: rapid increase in signal intensity, which reaches a plateau and a subsequent rapid decrease (washout) (x-axis: time (s); y-axis: relative signal intensity (baseline = 1.0)). IRE: Initial Rate of
Enhancement; ME: Maximal Enhancement; IRW: initial rate of washout.bAssignment and color–coding of the voxels within the ROIs based on the shape of the TICs: No enhancement (no color); Persistent (blue); Plateau (green) and Washout (red) represent the most perfused voxels.c
Region of interests (ROIs) around the peri-articular knee muscles avoiding major vascular branches. Blue: extensor muscle; Yellow: flexor muscles.
[image:3.595.55.539.422.643.2][23], physical performance by knee extensor and flexor muscle strength test [24] and the six-minute walking test (6MWT) [25] (see the Additional file1for details).
DCE-MRI derived perfusion variables are listed and explained in Table 1. All have previously been used in knee OA- and rheumatoid arthritis studies [14–17,
26, 27]; except Initial Rate of Enhancement and Max-imal Enhancement Indices (for details see the Add-itional file 1).
Intra- and inter observer reproducibility of the DCE-MRI analyses were assessed for the Total VOI on a ran-dom subsample (n= 10) in which manual segmentations were repeated after a minimum of 4 weeks. The intra-observer reliability of the volume (cm3) of the Total Muscle VOI was ICC = 0.99 (95% CI: 0.98 to 0.99). ICC of the muscle perfusion variables was ≥0.99 (in each case, the lower limit of the 95% CI was ≥0.91′). Due to low reproducibility of the Ktrans it was not in-cluded in the further analysis. Details of reproducibil-ity of the DCE-MRI variables are presented in the Additional file 1.
The reliability of KOOS [28], muscle strength tests [24], and 6MWT has been demonstrated [29].
Statistical methods
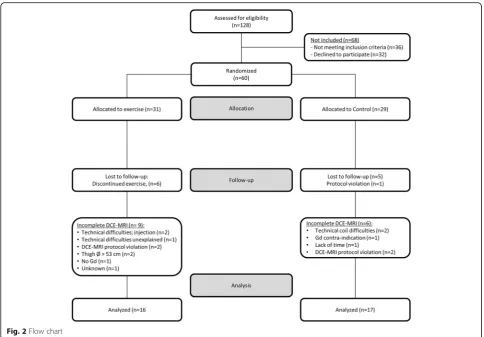
As pre-specified in the main trial protocol, the study fo-cuses on individuals who adhere to the protocol. The per-protocol population was defined as participants with 12 or fewer incidences of non-attendance at exercise ses-sions in the ET group, and no exercise in the CG. The present exploratory analyses aim at investigating the ef-fects of exercise on muscle perfusion in the peri-articular knee muscles; thus, only individuals included in
the per-protocol population with complete DCE-MRI data sets at baseline and follow-up were included in the present analyses (Fig.2).
Individual changes from baseline were calculated by subtracting the baseline value from the follow-up value for all outcomes. To assess group mean differences in the changes from baseline in all variables (purpose 1), analyses of covariance (ANCOVA) was used with change from baseline at follow-up as dependent variable, and baseline value of the dependent variable, treatment group, and gender (due to stratification by gender when randomising) as covariates [30]. For sensitivity purposes the analyses were repeated with further inclusion of age, weight and gender as covariates. All analyses were per-formed using SAS software (SAS Inc., Cary, NC, USA).
Ancillary analyses
To explore whether changes from baseline to follow-up in the muscle perfusion variables were associated with changes in pain and function (KOOS) and physical per-formance measures (purpose 2), we assessed the rank correlation (Spearman’s rho) of changes from baseline between the DCE-MRI muscle perfusion variables, KOOS subscales, muscle strength, and 6MWT across the entire population.
[image:4.595.57.539.98.323.2]Furthermore, we investigated the potential effect medi-ation of changes in the DCE-MRI perfusion variables for changes in KOOS pain in a post-hoc mediation analysis using a model-based approach with nonparametric boot-strap for variance estimation. The mediation models were adjusted for the same variables as the primary ana-lysis (i.e. baseline KOOS pain and gender). We estimated an average causal mediation effect [31], i.e. the amount
Table 1Definitions of the muscle perfusion variables (DCE-MRI)
Variable name Abbreviation Definition
Highly Perfused Voxels Nvoxel The number of voxels with“plateau”or“washout”enhancement patterns, i.e. the highest perfused voxels, the most perfused tissue.
Proportion of Highly Perfused Voxels (%)
Nvoxel% The proportion of highly perfused voxels reaching either a“plateau”or“washout”enhancement pattern (Nvoxel) in percentage of the total number of voxels within the VOI.
Initial Rate of Enhancement IRE The upslope on the Time intensity curve measured as the mean relative increase in signal intensity per second from enhancement onset until ME is reached(%/s). A surrogate of the degree of perfusion.
Maximal Enhancement ME The highest mean signal intensity value relative to the baseline intensity. A surrogate of the degree of perfusion.
Initial Rate of Enhancement Composite Score
IRExNvoxel The mean relative increase in signal intensity per second (%/s) (IRE) multiplied by the number of highly perfused voxels (Nvoxel). The variable becomes a composite parameter reflecting both the volume (voxels) and the degree of perfusion.
Initial Rate of Enhancement Index
IRExNvoxel% The mean relative increase in signal intensity per second (%/s) (IRE) multiplied by the proportion of highly perfused voxels (Nvoxel%).
Maximal Enhancement Composite Score
MExNvoxel The highest mean signal intensity value relative to the baseline intensity (ME) multiplied by the number Highly Perfused Voxels. The variable becomes a composite parameter reflecting both the volume (voxels) and the degree of perfusion.
of the total effect that are mediated by a specific variable, as well as the proportion of the total effect that is medi-ated. The R software, version 3.5.1 (R Foundation for Stat-istical Computing, Vienna, Austria), with the R Package
‘mediation’for Causal Mediation Analysis [32] was used.
Results
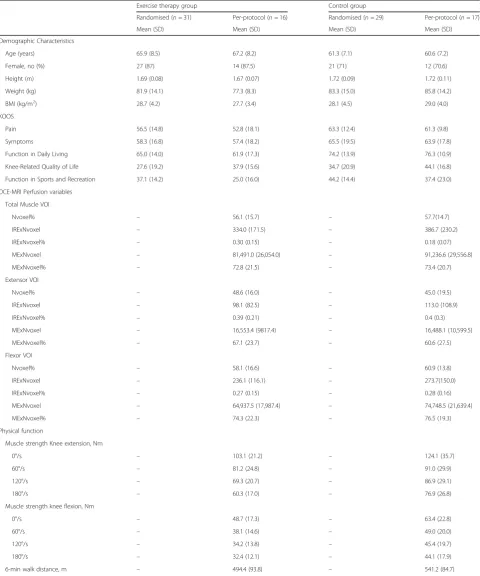
Of the 60 included participants in the main trial, 31 were randomised to ET and 29 to the CG. The present ana-lyses involved participants who adhered to the protocol with complete DCE-MRI data: 33 participants consti-tuted the DCE-MRI per-protocol population (ET,n= 16; CG, n = 17). In the DCE-MRI per-protocol population group, imbalances were present in age, weight and BMI at baseline, with the ET group being older and less over-weight. Details of study flow are given in Fig. 2. For baseline characteristics and data, see Table 2. There were no statistically significant differences between the DCE-MRI per-protocol population and the population not included in this study (ET,n= 15; CG,n= 12).
DCE-MRI perfusion variables
At follow-up there were statistically significant group differences in changes from baseline in all muscle
perfusion variables in favor of ET in the Total Muscle and Flexor VOIs showing a relative increase in the ET group compared with the CG.
Furthermore, in the Extensor VOI, the changes in Ini-tial Rate of Enhancement Composite Score (IRExNvoxel) and Initial Rate of Enhancement Index (IRExNvoxel%) were statistically significantly different in favor of ET, showing similar patterns as for the Total Muscle and Flexor VOIs, with a relative increase in the ET group compared with the CG. The results are summarized in Table3.
KOOS questionnaire
There was a statistically significant and clinically relevant group difference (10.7 KOOS points (95%CI 3.3 to 18.1)) in changes from baseline in KOOS pain in favor of ET similar to the per-protocol population in the main study [7]. No statistically significant group differences were ob-served in the other KOOS subscales (Table3).
Physical performance measures
No statistically significant group differences were ob-served in changes from baseline to follow-up in the muscle strength variables and in 6MWT (Table3).
[image:5.595.56.541.86.423.2]Table 2Baseline characteristics of the patients: Demographics, self-reported symptoms (KOOS), DCE-MRI perfusion variables, and physical function
Exercise therapy group Control group
Randomised (n= 31) Per-protocol (n= 16) Randomised (n= 29) Per-protocol (n= 17)
Mean (SD) Mean (SD) Mean (SD) Mean (SD)
Demographic Characteristics
Age (years) 65.9 (8.5) 67.2 (8.2) 61.3 (7.1) 60.6 (7.2)
Female, no (%) 27 (87) 14 (87.5) 21 (71) 12 (70.6)
Height (m) 1.69 (0.08) 1.67 (0.07) 1.72 (0.09) 1.72 (0.11)
Weight (kg) 81.9 (14.1) 77.3 (8.3) 83.3 (15.0) 85.8 (14.2)
BMI (kg/m2) 28.7 (4.2) 27.7 (3.4) 28.1 (4.5) 29.0 (4.0)
KOOS
Pain 56.5 (14.8) 52.8 (18.1) 63.3 (12.4) 61.3 (9.8)
Symptoms 58.3 (16.8) 57.4 (18.2) 65.5 (19.5) 63.9 (17.8)
Function in Daily Living 65.0 (14.0) 61.9 (17.3) 74.2 (13.9) 76.3 (10.9)
Knee-Related Quality of Life 27.6 (19.2) 37.9 (15.6) 34.7 (20.9) 44.1 (16.8)
Function in Sports and Recreation 37.1 (14.2) 25.0 (16.0) 44.2 (14.4) 37.4 (23.0)
DCE-MRI Perfusion variables
Total Muscle VOI
Nvoxel% – 56.1 (15.7) – 57.7(14.7)
IRExNvoxel – 334.0 (171.5) – 386.7 (230.2)
IRExNvoxel% – 0.30 (0.15) – 0.18 (0.07)
MExNvoxel – 81,491.0 (26,054.0) – 91,236.6 (29,556.8)
MExNvoxel% – 72.8 (21.5) – 73.4 (20.7)
Extensor VOI
Nvoxel% – 48.6 (16.0) – 45.0 (19.5)
IRExNvoxel – 98.1 (82.5) – 113.0 (108.9)
IRExNvoxel% – 0.39 (0.21) – 0.4 (0.3)
MExNvoxel – 16,553.4 (9817.4) – 16,488.1 (10,599.5)
MExNvoxel% – 67.1 (23.7) – 60.6 (27.5)
Flexor VOI
Nvoxel% – 58.1 (16.6) – 60.9 (13.8)
IRExNvoxel – 236.1 (116.1) – 273.7(150.0)
IRExNvoxel% – 0.27 (0.15) – 0.28 (0.16)
MExNvoxel – 64,937.5 (17,987.4) – 74,748.5 (21,639.4)
MExNvoxel% – 74.3 (22.3) – 76.5 (19.3)
Physical function
Muscle strength Knee extension, Nm
0°/s – 103.1 (21.2) – 124.1 (35.7)
60°/s – 81.2 (24.8) – 91.0 (29.9)
120°/s – 69.3 (20.7) – 86.9 (29.1)
180°/s – 60.3 (17.0) – 76.9 (26.8)
Muscle strength knee flexion, Nm
0°/s – 48.7 (17.3) – 63.4 (22.8)
60°/s – 38.1 (14.6) – 49.0 (20.0)
120°/s – 34.2 (13.8) – 45.4 (19.7)
180°/s – 32.4 (12.1) – 44.1 (17.9)
6-min walk distance, m – 494.4 (93.8) – 541.2 (84.7)
Table 3Comparison of changes from baseline in outcomes adjusted for baseline values and gender
Exercise group Control group Comparison
Mean (SE) Mean (SE) Mean Difference (95% CI) P-value
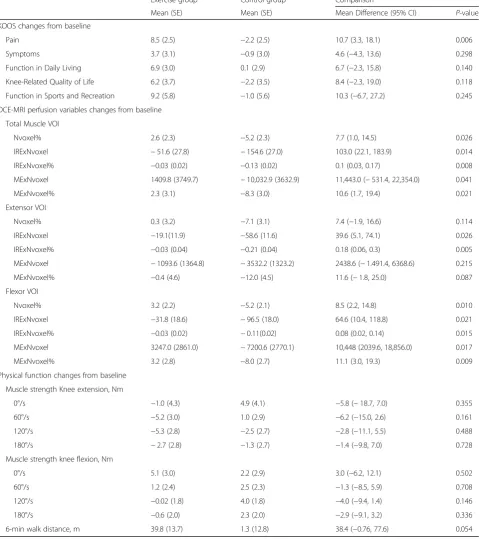
KOOS changes from baseline
Pain 8.5 (2.5) −2.2 (2.5) 10.7 (3.3, 18.1) 0.006
Symptoms 3.7 (3.1) −0.9 (3.0) 4.6 (−4.3, 13.6) 0.298
Function in Daily Living 6.9 (3.0) 0.1 (2.9) 6.7 (−2.3, 15.8) 0.140
Knee-Related Quality of Life 6.2 (3.7) −2.2 (3.5) 8.4 (−2.3, 19.0) 0.118
Function in Sports and Recreation 9.2 (5.8) −1.0 (5.6) 10.3 (−6.7, 27.2) 0.245
DCE-MRI perfusion variables changes from baseline
Total Muscle VOI
Nvoxel% 2.6 (2.3) −5.2 (2.3) 7.7 (1.0, 14.5) 0.026
IRExNvoxel −51.6 (27.8) −154.6 (27.0) 103.0 (22.1, 183.9) 0.014
IRExNvoxel% −0.03 (0.02) −0.13 (0.02) 0.1 (0.03, 0.17) 0.008
MExNvoxel 1409.8 (3749.7) −10,032.9 (3632.9) 11,443.0 (−531.4, 22,354.0) 0.041
MExNvoxel% 2.3 (3.1) −8.3 (3.0) 10.6 (1.7, 19.4) 0.021
Extensor VOI
Nvoxel% 0.3 (3.2) −7.1 (3.1) 7.4 (−1.9, 16.6) 0.114
IRExNvoxel −19.1(11.9) −58.6 (11.6) 39.6 (5.1, 74.1) 0.026
IRExNvoxel% −0.03 (0.04) −0.21 (0.04) 0.18 (0.06, 0.3) 0.005
MExNvoxel −1093.6 (1364.8) −3532.2 (1323.2) 2438.6 (−1.491.4, 6368.6) 0.215
MExNvoxel% −0.4 (4.6) −12.0 (4.5) 11.6 (−1.8, 25.0) 0.087
Flexor VOI
Nvoxel% 3.2 (2.2) −5.2 (2.1) 8.5 (2.2, 14.8) 0.010
IRExNvoxel −31.8 (18.6) −96.5 (18.0) 64.6 (10.4, 118.8) 0.021
IRExNvoxel% −0.03 (0.02) −0.11(0.02) 0.08 (0.02, 0.14) 0.015
MExNvoxel 3247.0 (2861.0) −7200.6 (2770.1) 10,448 (2039.6, 18,856.0) 0.017
MExNvoxel% 3.2 (2.8) −8.0 (2.7) 11.1 (3.0, 19.3) 0.009
Physical function changes from baseline
Muscle strength Knee extension, Nm
0°/s −1.0 (4.3) 4.9 (4.1) −5.8 (−18.7, 7.0) 0.355
60°/s −5.2 (3.0) 1.0 (2.9) −6.2 (−15.0, 2.6) 0.161
120°/s −5.3 (2.8) −2.5 (2.7) −2.8 (−11.1, 5.5) 0.488
180°/s −2.7 (2.8) −1.3 (2.7) −1.4 (−9.8, 7.0) 0.728
Muscle strength knee flexion, Nm
0°/s 5.1 (3.0) 2.2 (2.9) 3.0 (−6.2, 12.1) 0.502
60°/s 1.2 (2.4) 2.5 (2.3) −1.3 (−8.5, 5.9) 0.708
120°/s −0.02 (1.8) 4.0 (1.8) −4.0 (−9.4, 1.4) 0.146
180°/s −0.6 (2.0) 2.3 (2.0) −2.9 (−9.1, 3.2) 0.336
6-min walk distance, m 39.8 (13.7) 1.3 (12.8) 38.4 (−0.76, 77.6) 0.054
ANCOVA Analysis of covariance with each dependent variable adjusted for its baseline value and gender.
Abbreviations:MeanLeast Squares means (covariate adjusted means),SEStandard Error,CIConfidence interval,KOOSThe Knee Injury and Osteoarthritis Outcome
Score,DCE-MRIDynamic contrast enhanced magnetic resonance imaging,Total Muscle VOIA volume of interest consisting of the summed and averaged
peri-articular knee extensor and flexor muscle ROIs,Extensor VOIA volume of interest consisting of summed and averaged ROIs of the peri-articular knee extensor
muscles,Flexor VOIA volume of interest consisting of summed and averaged ROIs of the peri-articular knee flexor muscles,Nvoxel%Proportion of Highly Perfused
Voxels (%),IRExNvoxelInitial Rate of Enhancement Composite Score,IRExNvoxel%Initial Rate of Enhancement Index,MExNvoxelMaximal Enhancement Composite
Sensitivity analyses
The results were robust to sensitivity analysis, with only slight changes in the estimates (see the Additional file1).
Ancillary analyses
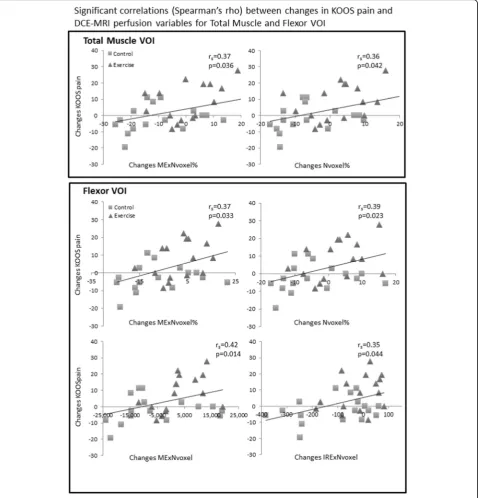
Changes from baseline in KOOS pain were positively correlated with changes in The Proportion of Highly Perfused Voxels (%) (Nvoxel%) and Maximal Enhance-ment Index (MExNvoxel%) in the Total and Flexor VOIs (r≥0.36, P ≤0.042). Further, changes in KOOS pain were positively correlated with changes in IRE Compos-ite score (IRExNvoxel) and ME ComposCompos-ite score (MExNvoxel) in the Flexor VOI (r≥0.35, P ≤0.044). This indicates that pain reduction was associated with increase in the degree and area of perfusion of the peri-articular muscles (Fig.3).
No statistically significant associations were found be-tween changes in muscle perfusion variables and the remaining 4 KOOS subscales (r < 0.18, P > 0.317). Changes from baseline in isometric knee extensor muscle strength were the only muscle strength variable which correlated significantly with changes in the muscle perfusion variables (the highest Spearman’s rho = −0.46, P= 0.028). No other statistically significant asso-ciations were found between changes in muscle perfu-sion variables and changes in the variables of physical performance (highest Spearman’s rho =−0.38,P= 0.076) (See the Additional file1for correlation matrix).
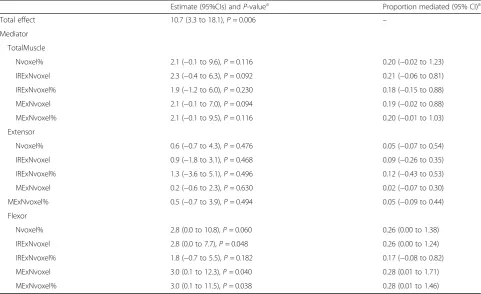
Over all, in the comparison between exercise and a no-attention control group, for changes in muscle perfu-sion variables (DCE-MRI) there was no statistically sig-nificant mediation of the pain-reducing effect of exercise in patients with knee OA, except for three muscle perfu-sion variables in the Flexor VOI. These were initial Rate of Enhancement Composite Score (IRExNvoxel), Max-imal Enhancement Composite Score (MExNvoxel) and Maximal Enhancement index (MExNvoxel%) (Table 4), mediating 26% (95% CI, 0 to 1.24), 28% (95% CI, 1 to 1.71) and 28% (95% CI, 1 to 1.46), of the total effect of the pain-reducing effect of exercise, respectively. How-ever, the upper limit of the 95% CI of the estimated pro-portions mediated suggest a potential mediation of effects on pain by all muscle perfusion variables (DCE-MRI) (Table4).
Discussion
Our results suggest that exercise therapy sustain peri-articular knee muscle perfusion compared to a no atten-tion CG, as the participants in the ET exhibited a constant level of muscle perfusion in contrast to decreased perfu-sion in the CG over the 12-week intervention period. Be-sides the differences in muscle perfusion, exercise had a clinically relevant effect on self-reported pain. Further,
across the population, changes in muscle perfusion were associated with changes in self-reported pain but not with physical function and performance. Although the medi-ation analyses overall were not statistically significant, all effects were in the expected direction. Altogether, these results indicate that muscle perfusion may be part of the underlying mechanisms of the pain-relieving effects of ex-ercise. The present results extend our previous cross-sectional observation that more widespread muscle perfu-sion associates with less pain [12] and support the notion that muscle perfusion plays a role in the effects of exercise on knee OA pain [12].
Mechanisms of changed muscle perfusion
The current study does not provide insight into the underlying mechanism of changed muscle perfusion. Ex-ercise causes structural adaptations in the muscles, such as increased capillarisation or angiogenesis as a physio-logical response [9–11]. Based on the present results, it could be speculated that exercise in knee OA prevents such loss of capillarisation in the muscle tissue. Exercise programs specifically aiming at physiological muscle adap-tations (e.g. resistance or cardiovascular training) may prove even more effective in inducing changes in muscle perfusion and are also beneficial in terms of pain [33,34].
Evaluating the effects of exercise
Pain experience is affected by psychological variables, such as depression and quality of life [35,36], and exer-cise is likely to change these [37–39]. It is plausible that exercise-induced pain reductions may also be mediated through improvements in psychological well-being.
As exercise therapy cannot be blinded to the provider or to the patient, the observed clinical effects may be fa-cilitated by effects associated with attention and study participation [8]. However, as the DCE-MRI assessment of muscle perfusion is a truly objective method, this study provides evidence of biological mechanisms associ-ated with the pain-relieving effects of exercise therapy. Unlike radiographs, where there is discordance between radiographic findings and pain [40], and a poor short-term responsiveness to detecting change [41], muscle perfusion may be a potential objective marker of exercise-induced pain reduction (and potentially other treatments) on a structural level in knee OA.
peri-articular perfusion in the response to inflammation or treatment with subsequent changes in pain. This pro-posed mechanism needs further exploration.
We assessed knee OA pain using the KOOS question-naire and found clinically relevant group differences that exceed the minimal clinically important difference (MCID) of 8–10 KOOS points as suggested by the devel-opers of the questionnaire (www.koos.nu). This increases the relevance of our findings. In contrast, the MCIDs in
the muscle perfusion variables have not been established, which encumbers interpretation of our results. However, the observed differences in muscle perfusion variables were all beyond the smallest detectable changes, and the reliability of the image analyses was satisfactory, which altogether strengthens our confidence in the results.
When evaluating the effects of exercise in knee OA, patient-reported outcomes (PROs) and performance-based tests are recommended and frequently used [5,42,
[image:9.595.60.539.89.588.2]43]. PROs and performance-based tests are affected by patient-provider interaction [44,45], which is an import-ant source of bias when the intervention cannot be blinded. Furthermore, the validity of performance-based tests (e.g. muscle strength) may be challenged by pain or fear of pain during the test [46, 47]. This means that a high degree of participant cooperation is necessary, which increases the risks of measurement bias and un-derlines the need for objective and sensitive measures in the evaluation of the underlying effects of exercise. DCE-MRI is such an objective method, and we applied it in the analysis of muscle perfusion, which is novel within OA research.
Strengths and limitations
The use of a rigorous randomised study design with pre-specified methods using standardised and validated image analyses with high reproducibility are major strengths of our study. On the other hand, the limited sample size and the many variables and statistical tests performed increase the chances for multiplicity. The fact that the study was designed and powered for another
[image:10.595.57.539.99.393.2]outcome are limitations and calls for replication in larger studies specifically designed for DCE-MRI. Nevertheless, we could detect clinically meaningful important signals associated with the effects of exercise, a universally rec-ommended treatment for knee OA. Another important aspect to consider is the per protocol design of the study. This was done to investigate the underlying mechanisms of exercise and thus it is necessary to focus on the participants who had complete DCE-MRI assess-ments at both baseline and follow-up and who had ad-hered to the protocol, i.e. received the allocated intervention (exercise vs control). This is fundamentally different from intention to treat study designs and therefore this study cannot be used to inform clinical practice. An important limitation is that out of 14 po-tential mediation analyses (corresponding to KOOS subdomains, muscle strength measurements, and 6-min walk distance) we only analysed mediation of effects on KOOS pain as this was the only outcome with signifi-cant group differences. This analysis did not support that changes in muscle perfusion mediate pain improvements.
Table 4The mediation effect of changes in DCE-MRI perfusion variables for changes in KOOS pain
Estimate (95%CIs) andP-valuea Proportion mediated (95% CI)a
Total effect 10.7 (3.3 to 18.1),P= 0.006 –
Mediator
TotalMuscle
Nvoxel% 2.1 (−0.1 to 9.6),P= 0.116 0.20 (−0.02 to 1.23)
IRExNvoxel 2.3 (−0.4 to 6.3),P= 0.092 0.21 (−0.06 to 0.81)
IRExNvoxel% 1.9 (−1.2 to 6.0),P= 0.230 0.18 (−0.15 to 0.88)
MExNvoxel 2.1 (−0.1 to 7.0),P= 0.094 0.19 (−0.02 to 0.88)
MExNvoxel% 2.1 (−0.1 to 9.5),P= 0.116 0.20 (−0.01 to 1.03)
Extensor
Nvoxel% 0.6 (−0.7 to 4.3),P= 0.476 0.05 (−0.07 to 0.54)
IRExNvoxel 0.9 (−1.8 to 3.1),P= 0.468 0.09 (−0.26 to 0.35)
IRExNvoxel% 1.3 (−3.6 to 5.1),P= 0.496 0.12 (−0.43 to 0.53)
MExNvoxel 0.2 (−0.6 to 2.3),P= 0.630 0.02 (−0.07 to 0.30)
MExNvoxel% 0.5 (−0.7 to 3.9),P= 0.494 0.05 (−0.09 to 0.44)
Flexor
Nvoxel% 2.8 (0.0 to 10.8),P= 0.060 0.26 (0.00 to 1.38)
IRExNvoxel 2.8 (0.0 to 7.7),P= 0.048 0.26 (0.00 to 1.24)
IRExNvoxel% 1.8 (−0.7 to 5.5),P= 0.182 0.17 (−0.08 to 0.82)
MExNvoxel 3.0 (0.1 to 12.3),P= 0.040 0.28 (0.01 to 1.71)
MExNvoxel% 3.0 (0.1 to 11.5),P= 0.038 0.28 (0.01 to 1.46)
a
The mediation effect of changes in the DCE-MRI perfusion variables for changes in KOOS pain were calculated in a post-hoc mediation analysis using a model-based approach with nonparametric bootstrap for variance estimation. The models were adjusted for the same variables as the primary analysis (i.e. baseline KOOS pain and gender). An average causal mediation effect was estimated
Abbreviations:CIConfidence interval,KOOSThe Knee Injury and Osteoarthritis Outcome Score,DCE-MRIDynamic contrast enhanced magnetic resonance imaging,
Total Muscle VOIA volume of interest consisting of the summed and averaged peri-articular knee extensor and flexor muscle ROIs,Extensor VOIA volume of
interest consisting of summed and averaged ROIs of the peri-articular knee extensor muscles,Flexor VOIA volume of interest consisting of summed and averaged
ROIs of the peri-articular knee flexor muscles,Nvoxel%Proportion of Highly Perfused Voxels (%),IRExNvoxelInitial Rate of Enhancement Composite Score,
Conclusion
The pain-reducing effects of a 12-week exercise program are associated with changes in muscle perfusion quanti-fied by DCE-MRI in individuals with knee OA, but whether the effects are mediated by muscle perfusion changes remains unclear.
Supplementary information
Supplementary informationaccompanies this paper athttps://doi.org/10. 1186/s12891-019-2858-8.
Additional file 1:Supplementary information.
Abbreviations
6MWT:The six-minute walking test; ANCOVA: Analyses of covariance; CG: Control group; DCE-MRI: Dynamic contrast enhanced magnetic resonance imaging; ET: Exercise therapy; Gd: Gadolinium; KOOS: The knee Injury and Osteoarthritis Outcome Score; Ktrans: Contrast transfer coefficient
from blood to extracellular space over time (min-1) and thus a measure of capillary permeability calculated using extended Tofts’s model.;
MCID: Minimal clinically important difference; OA: Osteoarthritis; PROs: Patient-reported outcomes; ROIs: Regions of interest; TICs: Time-intensity-curves; VOIs: Volumes of interest
Acknowledgements
We would like to thank the staff at the Department of Radiology, Bispebjerg and Frederiksberg Hospitals for helping in obtaining the MRI.
Authors’contributions
All authors revised the manuscript for important intellectual content and approved the final version. EB performed all the MRI analyses, contributed to the study design, statistical design and analysis, interpretation of the data and drafted the manuscript; MB contributed to the study design, radiological supervision, and interpretation of the data; RR contributed in the inter-observer reliability analysis, radiological supervision, and interpretation of the data; SMN conducted the mediation analyses and contributed in interpret-ation of the data; HB, CB, LK, JDN contributed to the study design and inter-pretation of the data; MH contributed to the study design, statistical design and analysis, and interpretation of the data. All the authors had access to the data and analyses. MH takes responsibility for the integrity of the work as a whole, from inception to finished article.
Funding
This study was supported by grants from The Association of Danish Physiotherapists; Bispebjerg- and Frederiksberg Hospital; The Danish Rheumatism Association, The Oak Foundation; The Lundbeck Foundation; and The Danish Council for Independent Research, Medical Sciences (grant no: 10–093704). The funding sources did not influence study design, collection, analysis and interpretation of data, writing, or the decision to submit the manuscript for publication.
Availability of data and materials
The datasets analysed during the current study are available from the corresponding author on reasonable request.
Ethics approval and consent to participate
The study was approved by the Regional Health Research Ethics Committee of The Capital Region of Denmark (H-2-2011-159) and was conducted in accordance with the Helsinki Declaration. Prior to inclusion all participants gave written informed consent to participate.
Consent for publication
Not applicable.
Competing interests
MB is chairman of the medical and scientific board, Image Analysis Ltd., London, UK and has stock options. He has received fees/honoraria
(<$10,000) covering travel/accommodation costs as well as a small yearly honorarium. All other authors have nothing to declare.
RR and JDN: Consultants for Image Analysis Ltd. (analyses of MRIs and conventional radiographs).
Author details
1The Parker Institute, Copenhagen University Hospital, Bispebjerg and
Frederiksberg, Copenhagen, Denmark.2Department of Radiology,
Copenhagen University Hospital, Bispebjerg and Frederiksberg, Copenhagen, Denmark.3Research Unit of Rheumatology, Department of Clinical Research,
University of Southern Denmark, Odense University Hospital, Odense, Denmark.4Department of physical and occupational therapy, Copenhagen University Hospital, Bispebjerg and Frederiksberg, Copenhagen, Denmark.
Received: 5 April 2019 Accepted: 30 September 2019
References
1. National Institute for H, Clinical E. Osteoarthritis: national clinical guideline for care and management in adults. London: NICE; 2014.
2. Hochberg MC, Altman RD, April KT, Benkhalti M, Guyatt G, McGowan J, et al. American College of Rheumatology 2012 recommendations for the use of nonpharmacologic and pharmacologic therapies in osteoarthritis of the hand, hip, and knee. Arthritis Care Res. 2012;64(4):465–74.
3. McAlindon TE, Bannuru RR, Sullivan MC, Arden NK, Berenbaum F, Bierma-Zeinstra SM, et al. OARSI guidelines for the non-surgical management of knee osteoarthritis. Osteoarthr Cartil. 2014;22(3):363–88.
4. Fernandes L, Hagen KB, Bijlsma JWJ, Andreassen O, Christensen P, Conaghan PG, et al. EULAR recommendations for the non-pharmacological core management of hip and knee osteoarthritis. Ann Rheum Dis. 2013; 72(7):1125–35.
5. Runhaar J, Luijsterburg P, Dekker J, Bierma-Zeinstra SM. Identifying potential working mechanisms behind the positive effects of exercise therapy on pain and function in osteoarthritis; a systematic review. Osteoarthr Cartil. 2015;23(7):1071–82.
6. Beckwee D, Vaes P, Cnudde M, Swinnen E, Bautmans I. Osteoarthritis of the knee: why does exercise work? A qualitative study of the literature. Ageing Res Rev. 2013;12(1):226–36.
7. Henriksen M, Klokker L, Graven-Nielsen T, Bartholdy C, Schjodt JT, Bandak E, et al. Association of exercise therapy and reduction of pain sensitivity in patients with knee osteoarthritis: a randomized controlled trial. Arthritis Care Res(Hoboken). 2014;66(12):1836–43.
8. Fransen M, McConnell S, Harmer AR, Van der Esch M, Simic M, Bennell KL. Exercise for osteoarthritis of the knee: a Cochrane systematic review. Br J Sports Med. 2015;49(24):1554–7.
9. Harris BA. The influence of endurance and resistance exercise on muscle capillarization in the elderly: a review. Acta Physiol Scand. 2005;185(2):89–97. 10. Hoier B, Hellsten Y. Exercise-induced capillary growth in human skeletal
muscle and the dynamics of VEGF. Microcirculation. 2014;21(4):301–14. 11. Egginton S. Invited review: activityinduced angiogenesis. Pflugers Arch
-Eur J Physiol. 2008;457(5):963.
12. Bandak E, Boesen M, Bliddal H, Riis RG, Gudbergsen H, Henriksen M. Associations between muscle perfusion and symptoms in knee osteoarthritis: a cross sectional study. Osteoarthr Cartil. 2015;23(10):1721–7. 13. Galbraith SM, Lodge MA, Taylor NJ, Rustin GJ, Bentzen S, Stirling JJ, et al.
Reproducibility of dynamic contrast-enhanced MRI in human muscle and tumours: comparison of quantitative and semi-quantitative analysis. NMR Biomed. 2002;15(2):132–42.
14. Axelsen MB, Poggenborg RP, Stoltenberg M, Kubassova O, Boesen M, Horslev-Petersen K, et al. Reliability and responsiveness of dynamic contrast-enhanced magnetic resonance imaging in rheumatoid arthritis. Scand J Rheumatol. 2013;42(2):115–22.
15. Riis RG, Gudbergsen H, Simonsen O, Henriksen M, Al-Mashkur N, Eld M, et al. The association between histological, macroscopic and magnetic resonance imaging assessed synovitis in end-stage knee osteoarthritis: a cross-sectional study. Osteoarthr Cartil. 2017;25(2):272–80.
17. Ballegaard C, Riis RGC, Bliddal H, Christensen R, Henriksen M, Bartels EM, et al. Knee pain and inflammation in the infrapatellar fat pad estimated by conventional and dynamic contrast-enhanced magnetic resonance imaging in obese patients with osteoarthritis: a cross-sectional study. Osteoarthr Cartil. 2014;22(7):933–40.
18. Loeuille D, Rat AC, Goebel JC, Champigneulle J, Blum A, Netter P, et al. Magnetic resonance imaging in osteoarthritis: which method best reflects synovial membrane inflammation?: correlations with clinical, macroscopic and microscopic features. Osteoarthr Cartil. 2009;17(9):1186–92. 19. Weber MA, Krix M, Delorme S. Quantitative evaluation of muscle perfusion
with CEUS and with MR. Eur Radiol. 2007;17(10):2663–74.
20. Kubassova O, Boesen M, Boyle RD, Cimmino MA, Jensen KE, Bliddal H, et al. Fast and robust analysis of dynamic contrast enhanced MRI datasets. Med Image Comput Comput Assist Interv. 2007;10(Pt 2):261–9.
21. Kubassova O, Boesen M, Cimmino MA, Bliddal H. A computer-aided detection system for rheumatoid arthritis MRI data interpretation and quantification of synovial activity. Eur J Radiol. 2010;74(3):67–72.
22. Boesen M, Kubassova O, Cimmino MA, Ostergaard M, Taylor P, Danneskiold-Samsoe B, et al. Dynamic contrast enhanced MRI can monitor the very early inflammatory treatment response upon intra-articular steroid injection in the knee joint: a case report with review of the literature. Arthritis. 2011; 2011:578252.
23. Roos EM, Toksvig-Larsen S. Knee injury and osteoarthritis outcome score (KOOS) - validation and comparison to the WOMAC in total knee replacement. Health Qual Life Outcomes. 2003;1:17.
24. Lund H, Sondergaard K, Zachariassen T, Christensen R, Bulow P, Henriksen M, et al. Learning effect of isokinetic measurements in healthy subjects, and reliability and comparability of Biodex and lido dynamometers. Clin Physiol Funct Imaging. 2005;25(2):75–82.
25. Enright PL. The six-minute walk test. Respir Care. 2003;48(8):783–5. 26. Boesen M, Kubassova O, Parodi M, Bliddal H, Innocenti S, Garlaschi G, et al.
Comparison of the manual and computer-aided techniques for evaluation of wrist synovitis using dynamic contrast-enhanced MRI on a dedicated scanner. Eur J Radiol. 2011;77(2):202–6.
27. Riis RG, Henriksen M, Klokker L, Bartholdy C, Ellegaard K, Bandak E, et al. The effects of intra-articular glucocorticoids and exercise on pain and synovitis assessed on static and dynamic magnetic resonance imaging in knee osteoarthritis: exploratory outcomes from a randomized controlled trial. Osteoarthr Cartil. 2016.
28. Collins NJ, Prinsen CAC, Christensen R, Bartels EM, Terwee CB, Roos EM. Knee injury and osteoarthritis outcome score (KOOS): systematic review and meta-analysis of measurement properties. Osteoarthr Cartil. 2016;24(8):1317– 29.
29. Kennedy DM, Stratford PW, Wessel J, Gollish JD, Penney D. Assessing stability and change of four performance measures: a longitudinal study evaluating outcome following total hip and knee arthroplasty. BMC Musculoskelet Disord. 2005;6(1):1–12.
30. Lydersen S. Statistical review: frequently given comments. Ann Rheum Dis. 2015;74(2):323–5.
31. Kosuke Imai LK, Tingley D, Yamamoto T. Unpacking the black box of causality: learning about causal mechanisms from experimental and observational studies. Am Polit Sci Rev. 2011;105(4):765–89.
32. Dustin Tingley TY. Kentaro Hirose, Luke Keele, Kosuke Imai. Mediation: R package for causal mediation analysis. J Stat Softw. 2014;59(5):1–38. 33. Bennell KL, Wrigley TV, Hunt MA, Lim BW, Hinman RS. Update on the role of
muscle in the genesis and Management of Knee Osteoarthritis. Rheum Dis Clin N Am. 2013;39(1):145–76.
34. Lange AK, Vanwanseele B, Fiatarone Singh MA. Strength training for treatment of osteoarthritis of the knee: a systematic review. Arthritis Rheum. 2008;59(10):1488–94.
35. de Rooij M, van der Leeden M, Heymans MW, Holla JF, Hakkinen A, Lems WF, et al. Prognosis of pain and physical functioning in patients with knee osteoarthritis: a systematic review and meta-analysis. Arthritis Care Res(Hoboken). 2016;68(4):481–92.
36. Edwards RR, Cahalan C, Mensing G, Smith M, Haythornthwaite JA. Pain, catastrophizing, and depression in the rheumatic diseases. Nat Rev Rheumatol. 2011;7(4):216–24.
37. Penninx BW, Rejeski WJ, Pandya J, Miller ME, Di BM, Applegate WB, et al. Exercise and depressive symptoms: a comparison of aerobic and resistance exercise effects on emotional and physical function in older persons with
high and low depressive symptomatology. J Gerontol B Psychol Sci Soc Sci. 2002;57(2):124–32.
38. Fransen M, Crosbie J, Edmonds J. Physical therapy is effective for patients with osteoarthritis of the knee: a randomized controlled clinical trial. J Rheumatol. 2001;28(1):156–64.
39. Tanaka R, Ozawa J, Kito N, Moriyama H. Does exercise therapy improve the health-related quality of life of people with knee osteoarthritis? A systematic review and meta-analysis of randomized controlled trials. J Phys Ther Sci. 2015;27(10):3309–14.
40. Bedson J, Croft PR. The discordance between clinical and radiographic knee osteoarthritis: a systematic search and summary of the literature. BMC Musculoskelet Disord. 2008;9:116.
41. Hunter DJ, Altman RD, Cicuttini F, Crema MD, Duryea J, Eckstein F, et al. OARSI clinical trials recommendations: knee imaging in clinical trials in osteoarthritis. Osteoarthr Cartil. 2015;23(5):698–715.
42. Messier SP, Callahan LF, Golightly YM, Keefe FJ. OARSI clinical trials recommendations: design and conduct of clinical trials of lifestyle diet and exercise interventions for osteoarthritis. Osteoarthr Cartil. 2015;23(5):787–97. 43. McAlindon TE, Driban JB, Henrotin Y, Hunter DJ, Jiang GL, Skou ST, et al.
OARSI clinical trials recommendations: design, conduct, and reporting of clinical trials for knee osteoarthritis. Osteoarthr Cartil. 2015;23(5):747–60. 44. Kaplan SH, Greenfield S, Ware JE Jr. Assessing the effects of
physician-patient interactions on the outcomes of chronic disease. Med Care. 1989; 27(3 Suppl):110–27.
45. Benedetti F. Placebo effects: understanding the mechanisms in health and disease. Oxford: Oxford University Press; 2009.
46. Henriksen M, Rosager S, Aaboe J, Graven-Nielsen T, Bliddal H. Experimental knee pain reduces muscle strength. J Pain. 2011;12(4):460–7.
47. Holm B, Kristensen MT, Husted H, Kehlet H, Bandholm T. Thigh and knee circumference, knee-extension strength, and functional performance after fast-track total hip arthroplasty. PMR. 2011;3(2):117–24.
Publisher’s Note