ORIGINAL RESEARCH ARTICLE
EFFECTS OF SCHOOL CHARACTERISTICS ON STUDENTS’ MATHEMATICS PERFORMANCES
IN HIGH SCHOOLS: DOES STEM EDUCATION MAKE ANY DIFFERENCE?
*Onder KOKLU
Florida Gulf Coast University
ARTICLE INFO ABSTRACT
The purpose of this study was to determine how different characteristics of Florida public high schools are related to students’ performances on the mathematics component of Advanced Placement (AP) exams, End of Course (EOC) exams, The Scholastic Aptitude Test (SAT) and American College Test (ACT) tests. The study also provides a summary of key findings and details about how students perform in STEM schools on the AP pass rates, EOC percentiles, and SAT and ACT test scores comparing to students in non-STEM schools in the State of Florida. The present study included 343 public high schools in the State of Florida. The sample consists of AP, EOC, SAT and ACT mathematics data for those 343 high schools selected among around 800 public high schools in the State. Selection criteria for the schools is based upon availability of required data. Multivariate Analysis of Variance (MANOVA), Cluster Analysis, and Independent Sample T-test Analysis techniques were used to analyze obtained data. Most stunning result of this study is that STEM and Non-STEM high school students’ performances on above mentioned assessments are not statistically significantly different. That brings a big question about quality and appropriateness of STEM applications for improving students’ understanding of mathematics concepts. Another important finding of the study is that even though student enrollment numbers do not play a role on students’ performances, minority rate, economically disadvantaged student rate and student-teacher ratio have statistically significant effects on students’ performances in both STEM and Non-STEM schools.
Copyright © 2019, Onder KOKLU. This is an open access article distributed under the Creative Commons Attribution License, which permits unrestricted use, distribution, and reproduction in any medium, provided the original work is properly cited.
INTRODUCTION
The quality of students’ performance remains at top priority for educators. It is meant for making a difference locally, regionally, nationally and globally. Educators, trainers, and researchers have long been interested in exploring variables contributing effectively for quality of performance of learners. There is a range of factors that effect on the quality of performance of students (Waters and Marzano, 2006). A series of variables are to be considered when to identify the affecting factors towards quality of academic success. Identifying the most contributing variables in quality of academic performance is a very complex and challenging job. The students in public schools belong to a variety of backgrounds depending upon their demography (Farooq et al.,
2011). The variables that affect students’ quality of academic achievement may be termed as student factors, family factors, school factors and peer factors (Crosnoe et al., 2004). Unfortunately, defining and measuring the quality of education is not a simple issue and the complexity of this process
increases due to the changing values of quality attributes associated with the different stakeholders’ view point (Blevins, 2009; Parri, 2006).
Role of STEM Education
Teaching and learning in the disciplines of science, technology, engineering, and mathematics in an interdisciplinary manner is called STEM education. In other words, STEM is a curriculum based on the idea of educating students in four specific disciplines Science, Technology, Engineering and Mathematics in an interdisciplinary and applied approach (National Research Council [NRC], 2011). Rather than teach the four disciplines as separate and discrete subjects, STEM integrates them into a cohesive learning paradigm based on real-world applications (Hom, 2014). What separates STEM from the traditional science and math education is the blended learning environment and showing students how the scientific method can be applied to everyday life. It teaches students computational thinking and focuses on the real-world applications of problem solving (Sheldon,
ISSN: 2230-9926
International Journal of Development Research
Vol. 09, Issue, 10, pp. 30737-30746, October, 2019
Article History: Received 22nd July, 2019 Received in revised form 08th August, 2019
Accepted 11th September, 2019 Published online 23rd October, 2019 Key Words:
STEM, High Schools, AP, EOC, SAT, ACT.
*Corresponding author: Onder KOKLU
Citation: Onder KOKLU, 2019. “Effects of school characteristics on students’ mathematics performances in high schools: does stem education make any difference?”, International Journal of Development Research, 09, (10), 30737-30746.
2017). Quality STEM education is critical in K-12 since today’s world requires every individual to understand scientific and technological knowledge (Young et al., 2011). By bee (2013) clearly articulates that the overall purpose of STEM education is to further develop a STEM literate society. His definition of “STEM literacy” refers to an individual’s:
1. Knowledge, attitudes, and skills to identify questions and problems in life situations, explain the natural and designed world, and draw evidence-based conclusions about STEM-related issues.
2. Understanding of the characteristic features of STEM disciplines as forms of human knowledge, inquiry and design;
3. Awareness of how STEM disciplines shape our material, intellectual, and cultural environments; and
4. Willingness to engage in STEM-related issues and with the ideas of science, technology, engineering and mathematics as a constructive, concerned, and reflective citizen.” (p.101).
STEM schools are designed to decrease the mathematics and science achievement gaps among various ethnic groups and to increase all K-12 students’ mathematics and science scores on both national and international standardized tests (Bicer et al.,
2014; Capraro et al., 2013; Capraro et al., 2013). STEM high schools are difficult to define because they do not operate under a single umbrella philosophy or organizational structure (Lynch, Behrend, Burton, and Means, 2013). Although these schools vary significantly in their educational practices, selective and inclusive STEM schools are the two most common STEM schools across the Unites States (NRC, 2011). The curriculum for selective and inclusive STEM schools was designed to improve students’ science and mathematics learning by engaging students with hands-on tasks in a collaborative and competitive environment (Gonzalez and Kuenzi, 2012). There are some differences between these two types of STEM schools in terms of their organization. The clearest distinction between selective STEM schools and inclusive STEM schools is the admission criteria. Selective STEM schools admit only students who are talented in and motivated toward STEM related fields while inclusive STEM schools have no selective admission criteria. Because of the difference between admission criteria of the two STEM school types, inclusive STEM schools are considered to serve a broader population (NRC, 2011). Young, House, Wang, and Singleton (2011) noted that “Inclusive STEM schools are predicated on the dual promises that math and science competencies can be developed, and students from traditionally underrepresented populations need access to opportunity to develop these competencies to become full participants in areas of economic growth and prosperity” (p. 2) LaForce, Noble, King, Holt and Century (2014) revealed that inclusive STEM schools have some common characteristics. First, they found that these schools feature problem-based learning, interdisciplinary instruction, student autonomy, and “rigorous learning,” which often entails mastery learning and a staff-created curriculum that features real-world applications. These schools also emphasize establishing a positive school culture, developing skills that students can use in their everyday lives and future careers (e.g., technological proficiency, communication, and collaboration), personalized learning (e.g., differentiation of instruction based on ability and relevance to students’ lives), and a connection between the school and local community (e.g., partnerships with external
educational and business organizations). Thus, LaForce et al.
(2014) discovered that what makes these schools “STEM” is not necessarily a greater emphasis on STEM subjects. Although that is the case in some inclusive STEM schools, what makes them “STEM” schools is primarily the use of problem-based, interdisciplinary, and personalized learning approaches none of which is unique to this recent STEM movement.
Role of Poverty and Diversity
As the impact of diversity is considered as a factor in student achievement, one cannot ignore the effects of SES and poverty. While individual SES, including generational poverty, is important in examining this issue, school level poverty also should be examined. Schools with a lack of diversity, specifically those with a high concentration of minority students, also display a high concentration of poverty. Frankenberg and Lee (2002), emphasized the important role of poverty on student achievement and the highly correlated relationship between minority status and poverty in schools.
They have stated:
The isolation of Blacks and Latinos has serious ramifications: this isolation is highly correlated with poverty, which is often strongly related to striking inequalities in test scores, graduation rates, courses offered, and college-going rates. Virtually no attention is being paid to this troubling pattern in the current discussion of educational reform even though it is very strongly related to many outcomes the reformers wish to change. (p. 22)
Orfield and Lee (2006) reported that in2001-2002, 43% of all U.S. schools contained less than 10% Black and Latino students. Of these highly concentrated White schools, only 15% had more than half of their students eligible for free/reduced price lunch. Conversely, 88% of schools with high concentrations of minority students had more than half of their students eligible for free/reduced price lunch. Therefore, as students continue to attend neighborhood schools in increasing numbers, students who come from high-poverty neighborhoods will be more likely to attend high-poverty/high-minority schools. The effects of attending high-poverty schools are discussed consistently throughout the literature. Rumberger and Palardy (2005) identified school-level poverty as having more of an effect than racial composition on student performance. A study conducted by Entwisle and Alexander (1992) determined that family SES and school-level segregation were the most significant factors in test-score differences for African American children in mathematics. Therefore, minority students face the triple challenge characterized by individual poverty, school-level poverty, and school-level segregation. Thus, the present study used school data to determine whether the factors such as diversity (minority rate), poverty (economically disadvantaged student rate) and School type (STEM and Non-STEM schools) have effects on students’ academic performances on SAT and ACT tests, Advance Placement (AP) and End-of-Course (EOC) exams in participating schools. Specific research questions for this current study are as follows:
1. How do high school students’ average mathematics performances on variety of assessments differ by STEM curriculum inclusion?
2. What are the other school characteristics that have or have not effects on students’ average
performances on variety of assessments?
METHODS
Overview
Considering the aim of this study, several quantitative data analysis techniques were used to answer research questions (Figure-1). Data were collected from 343 varying sizes of public high schools in the State of Florida selected among around 800 public high schools. School is called as STEM School if STEM related curriculum is used in education and called Non-STEM-School if it does not indicate any use of STEM curriculum in education. Among the participating schools, 232 were identified as STEM-School and 1
identified as Non-STEM-School. The student enrollment in participating schools is ranging from 113 to 4712, while the minority rates are ranging from 5% to 99%. Partici schools also have a minimum of 5% and a maximum of 96% of economically disadvantaged students’
[image:3.595.40.286.499.781.2]student-teacher ratios are ranging between 5 to 32. independent sample T-Tests were used in order to find out whether there were any achievement differences between STEM and Non-STEM schools. Then, Cluster analysis was used to determine homogeneous and clearly discriminated classes of schools. In order to confirm that clusters are distinct, MANOVA (Multiple Analysis of Variance) was use determine if there are any significant differences between clusters and 5 dependent variables (SAT scores, ACT scores, AP pass rates, mathematics proficiency levels and End Course exam score percentiles). In the last phase, four MANOVA analysis were run within each cluster in order to investigate differences in mathematics achievement between the levels of variables (School Type, Enrollment, Minority Rate, Student-Teacher Ratio and Disadvantaged Student Rate).
Figure 1. Overview of the Method
What are the other school characteristics that have or have not effects on students’ average mathematics performances on variety of assessments?
Considering the aim of this study, several quantitative data analysis techniques were used to answer research questions 1). Data were collected from 343 varying sizes of public high schools in the State of Florida selected among is called as STEM-School if STEM related curriculum is used in education and
School if it does not indicate any use of ation. Among the participating School and 111 were School. The student enrollment in participating schools is ranging from 113 to 4712, while the minority rates are ranging from 5% to 99%. Participating schools also have a minimum of 5% and a maximum of 96% rate while the teacher ratios are ranging between 5 to 32. First Tests were used in order to find out achievement differences between STEM schools. Then, Cluster analysis was homogeneous and clearly discriminated classes of schools. In order to confirm that clusters are distinct, MANOVA (Multiple Analysis of Variance) was used the determine if there are any significant differences between clusters and 5 dependent variables (SAT scores, ACT scores, AP pass rates, mathematics proficiency levels and End-of-Course exam score percentiles). In the last phase, four
re run within each cluster in order to investigate differences in mathematics achievement between Enrollment, Minority Teacher Ratio and Disadvantaged Student Rate).
Overview of the Method
Sample
For the purpose of this study around 800 public high schools in Florida were searched to be able to get information on Advance Placement (AP) courses pass rates, End
Exam percentile scores (EOC), overall Mathematics Performances (MP), SAT scale scores and ACT scale scores. Schools were excluded from the study if there was no information obtained on any of the AP, EOC, MP, SAT or ACT mathematics scores. Schools were also excluded if they have no information on number of enrollments, minority economically disadvantaged student rate, and student
ratio. These exclusions also ensured that the STEM schools have had STEM education curriculum for at least last three years. After all exclusions total of 343 public high schools in the State of Florida were selected for this investigation.
Variables and Scales
In the study, students’ average SAT and ACT mathematics test scale scores, AP pass rates, Mathematics Proficiency Levels and End-of-Course exam score percentiles in each participating school were used as an outcome estimate of students’ mathematics achievements in each school. Additionally, schools’ minority rates, enrollment numbers, disadvantaged student rates, and student
included to the analysis in order to estimate the effects of each of these characteristics besides STEM education. Further, school type (i.e., STEM or non
analysis in order to estimate effects of STEM education on students’ mathematics achievement. Variables
study are as follows:
School Type: This variable shows the type of the high school
and has two levels (STEM and Non
STEM-School if STEM related curriculum is used in education.
Advance Placement (AP) courses pass ra
higher educational institutions grant credits or advanced placement based on high school student’s performance on AP® exams. This variable shows percentages of all students who scored a three or higher (3+) on at least one AP exam.
End-of-Course Exam (EOC) percentile scores:
percentile score on Florida Standards Assessment and Mathematics End of Course Exams. This measures students’ mastery of mathematics exam based on the proportions of students who achieved each proficiency level
Mathematics Performances (MP):
Florida Standards Assessment and Mathematics End of Course Exams to high school students. This variable displays how well the school as a whole performed in mathematics.
SAT scale scores: This variable shows students’ average SAT
scale score on mathematics section of the test.
ACT scale scores: This variable shows students’ average ACT
scale score on mathematics section of the test.
Enrollment: This variable shows the total student enrollment
in each school.
For the purpose of this study around 800 public high schools in Florida were searched to be able to get information on Advance Placement (AP) courses pass rates, End-of-Course Exam percentile scores (EOC), overall Mathematics scale scores and ACT scale scores. Schools were excluded from the study if there was no information obtained on any of the AP, EOC, MP, SAT or ACT mathematics scores. Schools were also excluded if they have no information on number of enrollments, minority rate, economically disadvantaged student rate, and student-teacher ratio. These exclusions also ensured that the STEM schools have had STEM education curriculum for at least last three years. After all exclusions total of 343 public high schools in
ate of Florida were selected for this investigation.
In the study, students’ average SAT and ACT mathematics test scale scores, AP pass rates, Mathematics Proficiency Levels Course exam score percentiles in each participating school were used as an outcome estimate of students’ mathematics achievements in each school. Additionally, schools’ minority rates, enrollment numbers, disadvantaged student rates, and student-teacher ratios were order to estimate the effects of each of these characteristics besides STEM education. Further, school type (i.e., STEM or non-STEM) was included in the analysis in order to estimate effects of STEM education on students’ mathematics achievement. Variables used in this
This variable shows the type of the high school and has two levels (STEM and Non-STEM) Schools are called School if STEM related curriculum is used in
Advance Placement (AP) courses pass rates: Many U.S.
higher educational institutions grant credits or advanced placement based on high school student’s performance on AP® exams. This variable shows percentages of all students who scored a three or higher (3+) on at least one AP exam.
ourse Exam (EOC) percentile scores: This is a
percentile score on Florida Standards Assessment and Mathematics End of Course Exams. This measures students’ mastery of mathematics exam based on the proportions of students who achieved each proficiency level.
Mathematics Performances (MP): Florida administers the
Florida Standards Assessment and Mathematics End of Course Exams to high school students. This variable displays how well the school as a whole performed in mathematics.
able shows students’ average SAT scale score on mathematics section of the test.
This variable shows students’ average ACT scale score on mathematics section of the test.
Minority Rate: This variable shows the minority rate in each school.
Economically Disadvantaged Student Rate: This variable
shows the rate of economically disadvantaged students in each school. This variable is measured by the percentage of students at a high school qualifying for free and reduced lunch.
Student-Teacher Ratio: This variable shows the
student-teacher ratio in each school.
RESULTS
Independent Sample T-Tests
First, independent sample t-tests were used in order to determine whether there were any differences between independent school types (STEM and Non-STEM) on five continuous dependent variables (AP, MP, EOC, SAT, and ACT). From the five univariate tests that followed (one for each of the dependent variables), no statistically significant differences were found between the mean values of the STEM and Non-STEM schools in terms of mathematics achievement (Table-1).
As it can be seen in the table-1, all 2-tailed significance values are larger than the alpha level of 0.05. Descriptive statistics of STEM and Non-STEM schools for each dependent variable can be seen at table-2 below. From that table it can be obviously seen that although means for STEM schools are slightly higher than the means for Non-STEM schools for each dependent variable, no significant differences revealed between the means. Since no significant differences found in mathematics achievement between STEM and Non-STEM schools in the whole data, cluster analysis was used in the next step in order to investigate whether there is any significant difference between STEM and Non-STEM schools in each of the homogeneous and clearly discriminated classes of schools. The results of the cluster analysis were used to enhance the depth of the analysis by developing more interpretable classes of the high schools.
Cluster Analysis
[image:4.595.50.555.360.582.2]The use of clustering that presented here is one of the common uses of the technique, the K-means algorithm. From the variety of available cluster models and clustering procedures (e.g., hierarchical, partitioning, density-based, model-based, etc.), K-means algorithm was chosen as it is a relatively simple method
Table 1. Independent Samples Test for mean values of the STEM and Non-STEM schools
Table 2. Descriptive Statistics of STEM and Non-STEM schools for each dependent variable
School Type N Mean Std. Deviation Std. Error Mean
MP_Overall STEM 232 3.08 .540 .035
Non-STEM 111 3.01 .491 .047
EOC_Percentile STEM 232 83.25 15.725 1.032
Non-STEM 111 80.47 16.921 1.606
SAT STEM 232 596.94 32.215 2.115
Non-STEM 111 592.52 31.492 2.989
ACT STEM 232 25.25 1.877 .123
Non-STEM 111 25.08 1.912 .182
AP_Pass_Rate STEM 230 52.60 15.696 1.035
Non-STEM 111 52.66 15.923 1.511
F Sig. t df Sig. (2-tailed) Mean
Difference
Std. Error
Difference Lower Upper
Equal variances assumed
0.320 0.572 1.280 341 0.201 0.078 0.061 -0.042 0.197
Equal variances not assumed
1.324 236.418 0.187 0.078 0.059 -0.038 0.193
Equal variances assumed
1.971 0.161 1.494 341 0.136 2.779 1.860 -0.880 6.439
Equal variances not assumed
1.456 203.160 0.147 2.779 1.909 -0.985 6.544
Equal variances assumed
0.507 0.477 1.197 341 0.232 4.417 3.691 -2.843 11.677
Equal variances not assumed
1.206 221.300 0.229 4.417 3.662 -2.799 11.633
Equal variances assumed
0.125 0.724 0.795 341 0.427 0.173 0.218 -0.255 0.602
Equal variances not assumed
0.790 213.224 0.431 0.173 0.219 -0.259 0.606
Equal variances assumed
0.070 0.791 -0.032 339 0.975 -0.058 1.823 -3.643 3.527
Equal variances not assumed
-0.031 214.672 0.975 -0.058 1.832 -3.668 3.553
AP_Pass_Rate
Levene's Test for Equality of Variances
MP_Overall
EOC_Percentile
SAT
ACT
95% Confidence Interval of the Difference t-test for Equality of Means
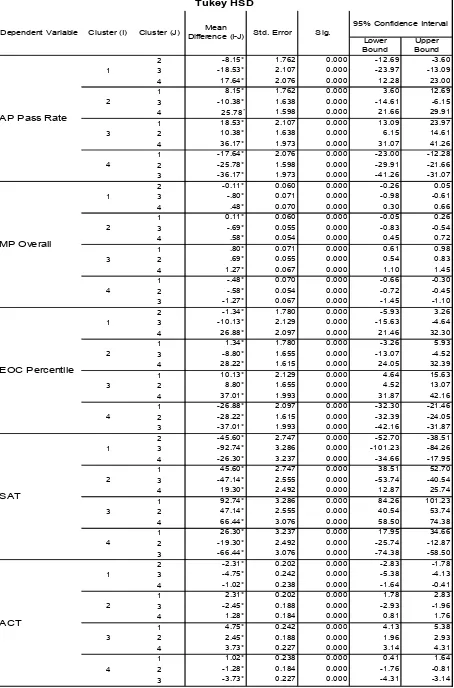
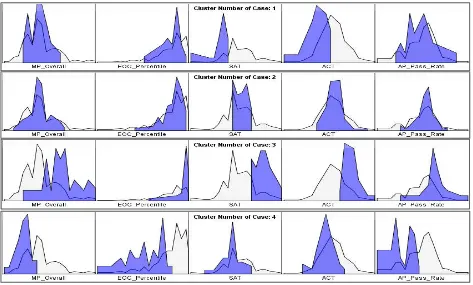
[image:4.595.67.531.605.790.2]that at the same time suits the purposes of trying to understand the data. In the K-means clustering, the goal is to group n observations into k clusters. Each cluster has a center computed as the mean of all the instances that belong to it. Then, each observation is assigned to the nearest cluster according to its center. Thus, the algorithm operates in an iterative manner starting from an initial set of cluster centers, assigning each observation to the nearest cluster, and then computing the new cluster centers. This procedure is repeated until a stopping criterion is reached. Then, all variables were converted to z-scores. Normalization is a necessary step because K-means clustering is strongly influenced by the magnitude of the variables. Without normalization, the partitioning of the dataset is driven mainly by the few variables with the highest magnitudes, relegating the others to a secondary role. The conversion of all variables to z-scores overcomes this problem. Therefore, independent variables (AP, MP, EOC, SAT, and ACT) were converted to standard scores (z-scores). Following a careful examination of the clusters, it was hypothesized there would be a 4-cluster partition. Initial four clusters were formed by using a hierarchical cluster analysis (Ward criterion). In order to investigate differences between the four clusters, a Multiple Analysis of Variance (MANOVA) was used with the four clusters variable used as the independent variable and five variables used in developing the clusters (AP, MP, EOC, SAT, and ACT) as the dependent variables. The multivariate test resulted in statistically significant differences between the four clusters. The statistical significance between the mean values of the four clusters was tested by using Tukey’s pair-wise comparison test. From the five univariate tests that followed (one for each of the dependent variables), statistically significant differences were found (Table-3) between the mean values of the four clusters and each of the five dependent variables (p < .001). After confirming that the developed clusters are significantly different from each other, means and standard deviations for four clusters across the variables were computed to understand the characteristics of each group of schools (clusters) more in depth. Table-4 provides the mean values and standard deviations for each cluster across the variables. Figure-2 also shows the distribution of variables in each the cluster for better visualize the structure of each cluster. Graph presented in figure-2 was produced by using standard scores instead of raw scores in order to see and compare all mean values of the variables in same scale. Another graph shown in figure-3 represents the distributions of mathematics performance variables (AP, EOC, MPL, SAT and ACT) in each cluster. The graph also allows to compare distributions of these variables in each cluster with overall distributions of the variables. Both descriptive and graphical summaries of the clusters were outlined in table-5 below to see the cluster characteristics much more clearly. The one-way multivariate analysis of variance (one-way MANOVA) was used again in the last phase of the study, four MANOVA analysis were run within each cluster in order to investigate differences in mathematics achievement between the levels of variables (School Type, Enrollment, Minority Rate, Student-Teacher Ratio and Disadvantaged Student Rate). More specifically, four separate one-way MANOVA’swere used to understand whether there were any differences in mathematics achievement between the levels of 5 variables (school types, enrollment, minority rate, student-teacher ratio and economically disadvantaged student rate) in each of the four cluster. Table-6 presents the four individual multivariate tests combined in one summary table. There was no statistically
significant difference found in cluster-1 between schools’ academic performance in mathematics based on a schools’ use of STEM curriculum, F (5, 15) = .119, p > .005; Wilk's Λ = 0.962. There was no statistically significant difference found in cluster-2 between schools’ academic performance in mathematics based on a schools’ use of STEM curriculum, F (5, 109) = .682, p > .005; Wilk's Λ = 0.970. There was no statistically significant difference found in cluster-3 between schools’ academic performance in mathematics based on a schools’ use of STEM curriculum, F (5, 20) = .135, p > .005; Wilk's Λ = 0.967. There was no statistically significant difference found in cluster-4 between schools’ academic performance in mathematics based on a schools’ use of STEM curriculum, F (5, 28) = .154, p > .005; Wilk's Λ = 0.973. On the other hand, there are significant differences detected between schools’ academic performances in mathematics based on total number of enrollments in all four clusters. There are significant differences between schools’ academic performances in mathematics based on total student-teacher ratios in clusters 1, 2, and 3. There are significant differences between schools’ academic performances in mathematics based on minority rates in clusters 2, 3, and 4. There are significant differences between schools’ academic performances in mathematics based on disadvantaged student rates in clusters 1, 2, and 4.
FINDINGS
From the statistical analyses and tables and figures produced according to these analyses, following findings have been reached related to research questions. There was no statistically significant difference found in between schools’ academic performances in mathematics based on a schools’ use of STEM curriculum. In other words, independent sample t-test conducted at the beginning of this study showed that students’ average mathematics performances in STEM schools are not different from those in Non-STEM schools. Upon this finding cluster analysis was done and following findings have been revealed from the analysis.
1. Cluster 1, with 14.07% of the sample, consisted of Florida public high schools with medium-low mathematics performances on AP exams and medium mathematics performance son EOC exams and low mathematics performances on SAT and ACT tests. Cluster 1 type schools were statistically significantly more likely to have low enrollments (µ=899.00), high minority rates (µ=72.58%), high economically disadvantaged student rates (µ=46.21%) and medium student-teacher ratios (µ=18.04). Mathematics performances of students in STEM and Non-STEM schools were not statistically different in Cluster 1 type schools.
Table 3. Results of Multivariate Analysis Tukey Post Hoc Tests
Lower Bound
Upper Bound
2 -8.15* 1.762 0.000 -12.69 -3.60
3 -18.53* 2.107 0.000 -23.97 -13.09
4 17.64* 2.076 0.000 12.28 23.00
1 8.15* 1.762 0.000 3.60 12.69
3 -10.38* 1.638 0.000 -14.61 -6.15
4 25.78* 1.598 0.000 21.66 29.91
1 18.53* 2.107 0.000 13.09 23.97
2 10.38* 1.638 0.000 6.15 14.61
4 36.17* 1.973 0.000 31.07 41.26
1 -17.64* 2.076 0.000 -23.00 -12.28
2 -25.78* 1.598 0.000 -29.91 -21.66
3 -36.17* 1.973 0.000 -41.26 -31.07
2 -0.11* 0.060 0.000 -0.26 0.05
3 -.80* 0.071 0.000 -0.98 -0.61
4 .48* 0.070 0.000 0.30 0.66
1 0.11* 0.060 0.000 -0.05 0.26
3 -.69* 0.055 0.000 -0.83 -0.54
4 .58* 0.054 0.000 0.45 0.72
1 .80* 0.071 0.000 0.61 0.98
2 .69* 0.055 0.000 0.54 0.83
4 1.27* 0.067 0.000 1.10 1.45
1 -.48* 0.070 0.000 -0.66 -0.30
2 -.58* 0.054 0.000 -0.72 -0.45
3 -1.27* 0.067 0.000 -1.45 -1.10
2 -1.34* 1.780 0.000 -5.93 3.26
3 -10.13* 2.129 0.000 -15.63 -4.64
4 26.88* 2.097 0.000 21.46 32.30
1 1.34* 1.780 0.000 -3.26 5.93
3 -8.80* 1.655 0.000 -13.07 -4.52
4 28.22* 1.615 0.000 24.05 32.39
1 10.13* 2.129 0.000 4.64 15.63
2 8.80* 1.655 0.000 4.52 13.07
4 37.01* 1.993 0.000 31.87 42.16
1 -26.88* 2.097 0.000 -32.30 -21.46
2 -28.22* 1.615 0.000 -32.39 -24.05
3 -37.01* 1.993 0.000 -42.16 -31.87
2 -45.60* 2.747 0.000 -52.70 -38.51
3 -92.74* 3.286 0.000 -101.23 -84.26
4 -26.30* 3.237 0.000 -34.66 -17.95
1 45.60* 2.747 0.000 38.51 52.70
3 -47.14* 2.555 0.000 -53.74 -40.54
4 19.30* 2.492 0.000 12.87 25.74
1 92.74* 3.286 0.000 84.26 101.23
2 47.14* 2.555 0.000 40.54 53.74
4 66.44* 3.076 0.000 58.50 74.38
1 26.30* 3.237 0.000 17.95 34.66
2 -19.30* 2.492 0.000 -25.74 -12.87
3 -66.44* 3.076 0.000 -74.38 -58.50
2 -2.31* 0.202 0.000 -2.83 -1.78
3 -4.75* 0.242 0.000 -5.38 -4.13
4 -1.02* 0.238 0.000 -1.64 -0.41
1 2.31* 0.202 0.000 1.78 2.83
3 -2.45* 0.188 0.000 -2.93 -1.96
4 1.28* 0.184 0.000 0.81 1.76
1 4.75* 0.242 0.000 4.13 5.38
2 2.45* 0.188 0.000 1.96 2.93
4 3.73* 0.227 0.000 3.14 4.31
1 1.02* 0.238 0.000 0.41 1.64
2 -1.28* 0.184 0.000 -1.76 -0.81
3 -3.73* 0.227 0.000 -4.31 -3.14
Std. Error Sig.
3
4 AP Pass Rate
MP Overall
EOC Percentile
SAT
ACT
1
2
3
4
1
2 3
4
1
2
3
4 1
2
3
4
1
2
Mean Difference (I-J)
Bas ed on obs erved m eans .The error term is Mean Square(Error) = 1.538. *. The m ean difference is s ignificant at the .05 level.
Dependent Variable Cluster (I) Cluster (J)
95% Confidence Interval
Tukey HSD
Table 4. Mean values and Standard deviations for
Table
Variables
Demographic Variables
Variables used to develop Clusters
Figure
Mean Std. Dev.
Enrollment 899.00 698.979
Stdnt/Tchr Ratio 18.04 4.849
Minorty Rate 72.58 25.352
EDS Rate 46.21 23.071
AP Pass Rate 48.54 12.483
MP Overall 2.96 0.307
EOC Percentile 84.88 8.432
SAT 578.39 21.234
ACT 24.06 1.611
De
mo
g
rafi
c
V
ar
ia
b
les
V
ar
iab
les
u
sed
t
o
d
evel
o
p
Cl
u
ster
s
Variables Cluster-1
Table 4. Mean values and Standard deviations for clusters across the variable
Table 5. Outline of the cluster characteristics
CLUSTERS
Cluster-1 Cluster-2 Cluster
Mean Mean Mean
Enrollment LOW MEDIUM LOW
Stdnt/Tchr Ratio MEDIUM MEDIUM LOW Minority Rate HIGH MEDIUM LOW LOW
EDS Rate HIGH MEDIUM LOW LOW
AP Pass Rate MEDIUM-LOW MEDIUM HIGH HIGH MP Overall MEDIUM-LOW MEDIUM HIGH EOC Percentile MEDIUM MEDIUM HIGH HIGH
SAT LOW MEDIUM HIGH
ACT LOW MEDIUM HIGH
Figure 2. Distributions of variables across clusters
Std. Dev. Mean Std. Dev. Mean Std. Dev. Mean Std. Dev.
698.979 1700.23 876.770 1152.52 761.577 1920.03 767.054
4.849 18.45 5.675 14.00 7.465 20.32
25.352 45.21 22.733 19.62 4.999 60.32
23.071 27.38 20.126 19.00 8.495 45.52
12.483 56.69 9.073 67.07 12.309 30.90
0.307 3.06 0.333 3.75 0.556 2.48
8.432 86.22 8.758 95.02 8.506 58.00
21.234 597.69 13.741 644.83 17.893 552.08
1.611 25.35 1.139 27.79 1.104 23.04
CLUSTERS
Cluster-1 Cluster-2 Cluster-3 Cluster-4
clusters across the variables
Cluster-3 Cluster-4 Mean Mean LOW HIGH LOW HIGH LOW HIGH LOW HIGH HIGH LOW HIGH LOW HIGH LOW HIGH LOW HIGH LOW
Std. Dev. Mean Std. Dev.
767.054 1548.33 874.918
3.293 18.32 5.705
18.872 49.34 23.507
15.521 31.90 22.710
12.266 52.62 15.747
0.251 3.06 0.526
17.856 82.40 16.185
19.686 595.78 31.906
1.304 25.21 1.891
[image:7.595.82.514.394.780.2]Table 6. Summary results of four multivariate tests across four clusters
Figure-3. Distributions of mathematics performance variables across clusters
Effect F Sig. F Sig. F Sig. F Sig.
Pillai's Trace 5150.940b 0.000
37128.558b 0.000
101147.741b 0.000
13364.091b 0.000
Wilks ' Lambda
5150.940b 0.000 37128.558b 0.000 101147.741b 0.000 13364.091b 0.000
Hotelling's Trace 5150.940b
0.000 37128.558b 0.000 101147.741b 0.000 13364.091b 0.000
Roy's Largest Root 5150.940b
0.000 37128.558b 0.000 101147.741b 0.000 13364.091b 0.000
Pillai's Trace .119b
0.986 .682b
0.638 .135b
0.982 .154b
0.977
Wilks ' Lambda
.119b 0.986 .682b 0.638 .135b 0.982 .154b 0.977
Hotelling's Trace .119b
0.986 .682b 0.638 .135b 0.982 .154b 0.977
Roy's Largest Root .119b 0.986
.682b 0.638
.135b 0.982
.154b 0.977
Pillai's Trace 2.5258416 0.023 4.5988964 0.000 5.1890474 0.000 5.3637042 0.000
Wilks ' Lambda 2.538b
0.024 4.676b
0.000 8.382b
0.000 5.545b
0.000
Hotelling's Trace 2.5333354 0.026 4.750711 0.000 12.487119 0.000 5.7131157 0.000
Roy's Largest Root 4.396c
0.010 7.376c 0.000 26.253c 0.000 9.173c 0.000
Pillai's Trace 2.192398 0.045 3.1839894 0.001 5.6494945 0.000 1.5752588 0.137
Wilks ' Lambda
2.344b 0.035 3.230b 0.001 6.080b 0.000 1.544b 0.148
Hotelling's Trace 2.4725115 0.029 3.27526 0.001 6.4902482 0.000 1.5118872 0.161
Roy's Largest Root 4.779c
0.007 5.298c 0.000 11.337c 0.000 2.225c 0.079
Pillai's Trace 1.1758426 0.342 5.3426084 0.000 3.6773419 0.001 5.2314195 0.000
Wilks ' Lambda
1.239b 0.307 5.367b 0.000 3.507b 0.002 5.749b 0.000
Hotelling's Trace 1.2884325 0.284 5.3898857 0.000 3.3364932 0.003 6.2599631 0.000
Roy's Largest Root 2.650c
0.063 7.501c 0.000 3.974c 0.011 11.047c 0.000
Pillai's Trace 2.97562 0.009 10.287716 0.000 1.4197196 0.205 5.0173484 0.000
Wilks ' Lambda 2.861b
0.013 10.401b
0.000 1.386b
0.222 8.613b
0.000
Hotelling's Trace 2.7370515 0.017 10.512551 0.000 1.3486933 0.241 13.249964 0.000
Roy's Largest Root 4.110c
0.014 14.411c 0.000 2.126c 0.102 27.817c 0.000
b. Exact s tatistic
Cluster-3 Cluster-4
Multivariate Tests
EDS
c. The s tatistic is an upper bound on F that yields a lower bound on the s ignificance level.
Cluster-1 Cluster-2
Intercept
STEM
Enrollm ent
Stdnt/Tchr Ratio
Minority
3. Cluster 3, with 17.08% of the sample, consisted of Florida public high schools with high mathematics performances on AP and EOC exams and high mathematics performances on SAT and ACT tests. Cluster 3 type schools were statistically significantly more likely to have low enrollments (µ=1152.52), low minority rates (µ=19.62%), low economically disadvantaged student rates (µ=19.00%) and low student-teacher ratios (µ=14.00). Mathematics performances of students in STEM and Non-STEM schools were not statistically different in Cluster 3 type schools.
4. Cluster 4, with 18.18% of the sample, consisted of Florida public high schools with low mathematics performances on AP and EOC exams and low mathematics performances on SAT and ACT tests. Cluster 3 type schools were statistically significantly more likely to have high enrollments (µ=1920.03), high minority rates (µ=60.32%), high economically disadvantaged student rates (µ=45.52%) and high student-teacher ratios (µ=20.32). Mathematics performances of students in STEM and Non-STEM schools were not statistically different in Cluster 4 type schools.
DISCUSSION AND CONCLUSION
The results from statistical analyses indicated that STEM curriculum in Florida public high schools has no effect on students’ mathematics performances on several measures (AP, EOC, MPL, SAT and ACT) used in this study. It could be argued that either Florida public high schools which are claiming that they use STEM curriculum and applications in education are failing to apply STEM enrichment activities in the classrooms to link mathematics to the real-world applications or the exams and tests that are used in schools have no connection to STEM related curriculum in measuring the student’ understanding of the mathematical concepts. Although there are considerable number of studies reported positive effects of STEM education in the field of mathematics, there is one study reporting that STEM activities have made no difference to students’ performances in mathematics exams. Dr Pallavi Amitava Banerjee (2016), from the University of Exeter's Graduate School of Education, England, used the National Pupil Database, government statistics about each school and pupil, to assess the impact of STEM enrichment schemes on how well students performed in mathematics. By looking at five years of data she found that among the 300 schools who participated there was no impact on mathematics section of the GCSE (The General Certificate of Secondary Education) test results. Additionally, STEM high schools are difficult to define because they do not operate under a single umbrella philosophy or organizational structure (Lynch et al., 2013). Most recent studies, (Bicer et al., 2014; Capraro et al., 2013; Capraro et al., 2013; Lynch, Behrend et al., 2013) identify these schools from the use of nonselective admission policies, a school’s self-proclaimed emphasis on the STEM fields, and perhaps a school’s affiliation with an organized STEM education initiative. These schools vary significantly in their educational practices. Furthermore, the analysis of data also revealed that students in high schools that have lower minority rates and low economically disadvantaged student rates perform better in mathematics exams and in mathematics sections of the tests such as SAT and ACT. Clayton (2011) has conducted a research study examining
whether diversity of a school can predict academic performance on state-mandated tests. She found that the higher-poverty and higher-minority schools displayed lower pass rates at both the standard and advanced pass levels. In the current study, similar results have been revealed. Moreover, results of the present study indicated students in high schools that have lower economically disadvantaged student rates perform better in mathematics exams and in mathematics sections of the tests such as SAT and ACT. Numerous research studies (Clayton, 2011; Orfield and Lee, 2006;Rumberger and Palardy, 2005) reported the repeated finding emphasizing that the portion of a school’s students who are live in poverty is by far the greatest predicator of how students will perform academically. Stevenson (2001) conducted a research study investigating the relationship of economically disadvantaged student rates to student outcomes, using SAT scores as the measure of academic performance. As a result of the study it was reported that approximately 60% of the variation in SAT performance across high schools was related to the overall level of student poverty within the schools.
Finally, the analysis of data clearly indicated that total number of enrollments have no significant effect on students’ performances in high schools. Several research studies have investigated the relationship between school size and students’ academic performances. In most of these studies, no significant relationship was found. Similarly, Crenshaw (2003) sought to answer two questions related to high school size. One was, “What are the relationships among school size, student achievement, teacher attendance, teacher stability, teacher perception of school climate, student attendance, dropout grates, and student perception of school climate?” The other asked, “Does school size influence achievement through the effects of nonacademic factors for teachers and students on school achievement?” The sample for her study included 178 public high schools in South Carolina. Crenshaw discovered that poverty was a significant predictor of both performance outcomes and measures of school climate. Though she did find some connection between school size and student achievement, Crenshaw concluded that: The relationship between socio-economic levels and achievement appeared stronger than the relationship between school size and achievement ratings. Schools that obtained higher achievement ratings tended to be larger, but more importantly the more affluent schools tended to be larger.
REFERENCES
Banerjee, P. A. 2016. A systematic review of factors linked to poor academic performance of disadvantaged students in science and math in schools. Cogent Education, 3(1), 1178441.
Bicer, A., Navruz, B., Capraro, R. M. and Capraro, M.M. 2014. STEM schools vs. non-STEM schools: Comparing students’ mathematics state-based test performance.
International Journal of Global Education, 3(3), 8-18.
Blevins, B. M. 2009. Effects of socioeconomic status on academic performance in Missouri public schools. Retrieved from http://gradworks.umi.com/3372318.pdf Bybee, Rodger, W. 2013. The Case for STEM Education:
Challenges and Opportunities. National Science Teachers Association, NSTA Press, Arlington, Virginia.
Capraro, M. M., Capraro, R. M., and Lewis, C. (Eds.) 2013.
STEM education for all students. New York, NY: Information Age.
Capraro, R. M., Capraro, M. M., and Morgan, J. (Eds.) 2013.
Project-based learning: An integrated science, technology,
engineering, and mathematics (STEM) approach (2nd
Edition, pp. 1-214). Rotterdam, The Netherlands: Sense. Clayton, J. K. 2011. Changing diversity in US schools: The
impact on elementary student performance and achievement. Education and urban society, 43(6), 671-695. Crenshaw, M. 2003. The relationships among school size, school climate variables, and achievement ratings in South Carolina high schools: A conceptual model. Unpublished doctoral dissertation, University of South Carolina, Columbia.
Crosnoe, R., Johnson, M. K. and Elder, G. H. 2004. School size and the interpersonal side of education: An examination of race/ethnicity and organizational context. Social Science Quarterly, 85(5), 1259-1274.
Entwisle, D., and Alexander, K. 1992. Race, poverty, school composition, and mathematics achievement in the first two years of school. American Sociological Review, 57, 72-84. Farooq, M.S., Chaudhry, A.H., Shafiq, M., Berhanu G. 2011.
Factors affecting students’ quality of academic performance: a case of secondary school level. Journal of
Quality and Technology Management. Volume VII, Issue
II, Page 01 ‐ 14
Frankenberg, E., and Lee, C. 2002. Race in American public schools: Rapidly resegregating school districts. Cambridge, MA: Civil Rights Project of Harvard University.
Gonzalez, H. B. and Kuenzi, J. J. 2012. Science, technology,
engineering, and mathematics (STEM) education: Aprimer.
Congressional Research Service. Retrieved from http:// www.fas.org/sgp/crs/misc/R42642.pdf
Hom, E. J. 2014. What is STEM? Retrieved from:
https://www.livescience.com/43296-what-is-stem-education.html.
LaForce, M., Noble, E., King, H., Holt, S., Century, J. 2014. The 8 elements of inclusive STM high schools. Chicago, IL: The University of Chicago.
Lynch, S. J., Behrend, T., Burton, E. P., Means, B. 2013. Inclusive STEM-focused high schools: STEM education policy and opportunity structures. Retrieved from http://ospri.research.gwu.edu/conference-presentations National Research Council, 2011. Successful K-12 STEM
education: Identifying effective approaches in science,
technology, engineering, and mathematics. Washington,
DC:NAP.
Orfield, G., and Lee, C. 2006. Racial transformation and the changing nature of segregation. Cambridge, MA: Civil Rights Project of Harvard University.
Parri, J. 2006. Quality in higher education. Vadyba/ Management, 2(11),107-111.
Rumberger, R. and Palardy, G. 2005. Does segregation still matter? The impact of student composition on academic achievement in high school. Teachers College Record, 107, 1999-2045.
Sheldon, E. 2017. Computational Thinking Across the Curriculum. Retrieved from: https://www.edutopia.org/ blog/computational-thinking-across-the-curriculum-eli-sheldon.
Stevenson, K. R. 2001. The relationship of school facilities conditions to selected student academic outcomes: A study of South Carolina public schools. Columbia, SC: University of South Carolina, Department of Educational Leadership and Policies.
Waters, T. J., and Marzano, R. J. 2006. School district leadership that works: The effect of superintendent leadership on student achievement. Mid-Continent Research for Education and Learning. Retrieved from ERIC (ED494270).
Young, V. M., House, A., Wang, H., Singleton, C., and Klopfenstein, K. 2011. Inclusive STEM schools:
Earlypromise in Texas and unanswered questions. National
Research Council Workshop on Successful STEM Education in K-12 Schools. Retrieved from http://www7. nationalacademies.org/bose/STEMSchools_Workshop_Pap er_Young.pdf