1238
LOAD DISTRIBUTION ANALYSIS ON BIPARTITE
TOPOLOGY USING FLOODLIGHT CONTROLLER
1ROHMAT TULLOH, 2HALIMAH TUSSYADIAH, 3RISKI WAHYU HUTABRI, 4RIDHA
MULDINA NEGARA
1School of Applied Science, Telkom University, Indonesia
234School of Electrical Engineering, Telkom University, Indonesia
1 [email protected] , 2[email protected], 3[email protected],
ABSTRACT
First-hop redundancy is a technique used in access layer where multiple gateways is deployed in case of a failure, thus increasing availability and reliability of the Internet. Load balancing is often plays a significant role for this technique to properly utilized every gateway in the network. In this paper, we tested the redundancy and load balancing application of Floodlight controller, in a network with bipartite topology simulated by Mininet. The evaluation is done by measuring QoS while sending various traffics through the network such as UDP Flow, Telnet, DNS and VoIP from which show that further optimization is still needed.
Keywords:Network Redundancy, Load Distribution, Floodlight Controller, Bipartite Topology, Software
Defined Network
1. INTRODUCTION
In 2008, UC Berkeley and Stanford University developed a concept of a centralized control system to manage devices on a network infrastructure known as Software Defined Network [1]. The basic concept of Software Defined Network is by explicitly separating between a forwarding plane, which remains on the network devices to forward data, and a control plane which is in a separate entity called the controller [2]. The controller allows network administrator to program a network infrastructure without direct configuration on each physical network devices. Software Defined Network has the ability to maximize the utilization of network devices, such as bandwidth optimization, load balancing, traffic engineering, and other programmable stuff [3].
In order for the controller to work optimally, it needs an alternative path/multiple gateways to redirect the traffic in case of a link failure to maintain its performance and availability (network redundancy) [4][5]. Load balancing is also needed to maximize the utilization of each available gateway.
Similar work has been done [5], in which the authors used Pox controller in bipartite topology as shown in Figure 1 with random number of gateways (L1) between 1-4 and also random
[image:1.612.348.504.552.709.2]number of host-connected switches (L2) between 1-8 despite the limitation of recursive function in the Pox controller. In this paper, we chose a different controller (Floodlight) as an attempt to get rid of limitation, and to see whether the performance of the network will be affected or not. The same topology is used, but the number of L1 and L2 assigned is selected from 2-4 switches. The evaluation is done by measuring Average Delay, Average Jitter, Average Bit Rate, Average Packet Rate and Packet Success Rate while sending various traffics through the network such as UDP Flow, Telnet, DNS, and VoIP.
1239
2. SOFTWARE DEFINED NETWORK
Software Defined Network is a centralized system that separates the control plane and data plane [1]. The basic concept of Software Defined Network is to explicitly separating between a control plane and forwarding plane. The forwarding plane remains on the network devices, while the control plane is in a separate entity called the controller, differs from a traditional network. [2].
3. OPENFLOW
The first concept of OpenFlow first developed at Stanford University in 2008. OpenFlow is the first standard communication protocol between control plane and forwarding plane/data plane on the SDN network architecture. Version 1.0 of OpenFlow was released in Desember 2009 [7]. OpenFlow is
currently managed by Open Networking
Foundation (ONF), and user-based organization dedicated to open standards of Software Defined Network [8][9]. OpenFlow network consists of one or more OpenFlow switches and one or more controllers with Secure Channel connection between them [10].
4. NETWORK REDUDANCY AND LOAD
BALANCING
Redundancy an alternative path/multiple gateways to redirect the traffic in case of a link failure to maintain its performance and availability [5][11], while load balancing is a technique to distribute traffic on two or more data paths in a balanced way, thus maximize the utility of each gateway [12] [13].
5. FLOODLIGHT CONTROLLER AND
MININET
Floodlight controller is an enterprise-class OpenFlow controller that is apache-based and Java-based, supported by Big Switch Networks [14] [15]. Mininet is a Command Line Interface (CLI) emulator that is used to emulate a network topology on Software Defined Network environment [16].
6. RESEARCH METHODOLOGY
In this paper, we tested a built-in load balancer function of Floodlight controller in a network with bipartite topology. The number of gateways and host-connected switches is randomly selected from 2-4 switches, with different bandwidth assigned on each link. Several types of traffic, including UDP Flow, Telnet, DNS, and VoIP is sent through the network while Average Delay, Average Jitter, Average Bit Rate, Average Packet Rate and Packet Success Rate of each traffic is measured.
For UDP Flow, a traffic is sent to destination host/protocol with UDP protocol, with constant rate: 1000 packet / s for 15000ms.
For VoIP, a traffic is sent to the host/server using Voice Codec G.711.2, VAD: Si, Frame size: 80, and number of packet / s: 20.
For Telnet, a traffic is sent to destination host/protocol with UDP protocol, with constant rate: 1000 packet / s.
For DNS, a traffic is sent to the destination host/server with UDP protocol, with constant rate : 1000 packets / s.
The tools that has been used to run the proposed scheme in this paper are:
1. OS Linux Ubuntu 14.04 LTS
2. VirtualBox
3. Mininet
4. Floodlight Controller
5. D-ITG
7. ARCHITECTURE OF SYSTEM
[image:2.612.325.516.424.522.2]The system is based on Software Defined Network architecture as shown in Figure 2.
Figure 2: Architecture Of System [4][6]
We use programmable switches that support OpenFlow 1.3 as a standard communication protocol with a connected Software Defined Network controller (Floodlight), with Ethernet network facilitate the connection between switches. The IP address of the gateway and other network interfaces outside of the network are stored in the controller, thus each switch does not have IP address on its own.
1240 layer 2 (L2) network broadcast multi-access ethernet with the switches act as a relay between the host and the controller in the discover-offer-request of DHCP process.
[image:3.612.333.515.116.264.2]Finally we propose a scheme to test the load balancer function in various types of bipartite topology, such as:
Figure 3: Topology L1=2 And L2=2
Figure 3 shows a bipartite topology with 2 gateways and 2 host-connected switches running in Mininet.
Figure 4: Topology L1=2 And L2=3
Figure 4 shows a bipartite topology with 2 gateways and 3 host-connected switches running in Mininet.
Figure 5: Topology L1=2 And L2=4
Figure 5 shows a bipartite topology with 2 gateways and 4 host-connected switches running in Mininet.
Figure 6: Topology L1=3 And L2=2
[image:3.612.148.256.183.355.2] [image:3.612.335.515.348.523.2] [image:3.612.133.282.430.592.2]1241 Figure 7: Topology L1=3 And L2=3
Figure 7 shows a bipartite topology with 3 gateways and 3 host-connected switches running in Mininet.
Figure 8: Topology L1=3 And L2=4
Figure 8 shows a bipartite topology with 3 gateways and 4 host-connected switches running in Mininet.
Figure 9: Topology L1=4 And L2=2
Figure 9 shows a bipartite topology with 4 gateways and 2 host-connected switches running in Mininet.
Figure 10: Topology L1=4 And L2=3
Figure 10 shows a bipartite topology with 4 gateways and 3 host-connected switches running in Mininet.
Figure 11: Topology L1=4 And L2=4
1242 8. THE RESULT OF EXPERIMENTS
The evaluation is done by measuring Average Delay, Average Jitter, Average Bit Rate, Average Packet Rate and Packet Success Rate in a bipartite topology with different combination of gateways and host-connected switches assigned while sending various types of traffic, such as:
8.1 UDP Flow
For UDP Flow, a traffic is sent to destination host/protocol with UDP protocol, with constant rate: 1000 packet / s for 15000ms.
[image:5.612.177.454.248.448.2]8.1.1Average Delay
Figure 12: UDP Average Delay
Figure 12 shows a trend where the number of gateways and host-connected switches are proportionate to the increased delay. However, when L1=3, the delay is oddly decreasing in contrast to the increasing number of gateways assigned.
8.1.2Average Jitter
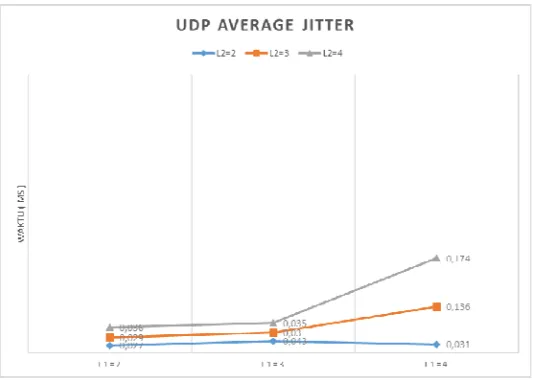
[image:5.612.198.466.514.704.2]1243
Figure 13 shows a trend where the number of gateways and host-connected switches are proportionate to the increased jitter with an exception of fluctuation shown from L1=3, L2=1 to L1=4, L2=1. The jitter decreased from 0.043 to 0.03, increased to 0.035, and decreased again to 0.031.
[image:6.612.199.463.163.352.2]8.1.3Average Bit Rate
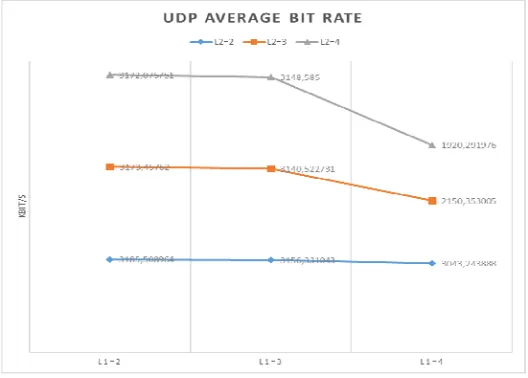
Figure 14: UDP Average Bit Rate
Figure 14 shows a trend where the number of gateways and host-connected switches are proportionate to the decreased bitrate, with an exception of increased value to 3148,595089 Kbit / s at L1 = 3 and L2 = 4.
[image:6.612.154.470.461.655.2]8.1.4Average Packet Rate
Figure 15: UDP Average Packet Rate
1244
[image:7.612.134.471.94.312.2]8.1.5Packet Succes Rate
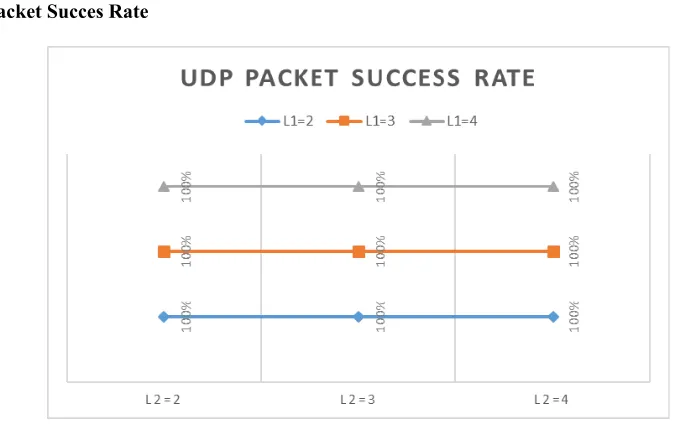
Figure 16: UDP Packet Success Rate
Figure 16 shows that all UDP Flow packets are successfully sent in any topology with different combination of L1 and L2.
8.2 VoIP
For VoIP, a traffic is sent to the host/server with Voice Codec G.711.2, VAD: Si, Frame size: 80, number of packet / s: 20.
[image:7.612.194.470.448.643.2]8.2.1Average Delay
Figure 17: VoIP Average Delay
1245 8.2.2Average Jitter
Figure 18: VoIP Average Jitter
Figure 18 shows a trend where the number of gateways and host-connected switches are proportionate to the increased jitter.
[image:8.612.177.444.400.599.2]8.2.3Average Bit Rate
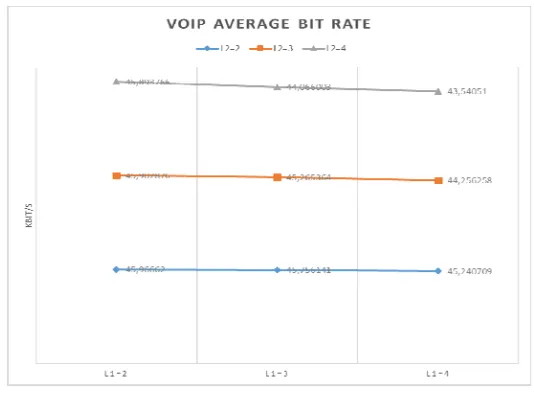
Figure 19: VoIP Average Bit Rate
1246
8.2.4Average Packet Rate
[image:9.612.171.491.115.316.2]Figure 20: VoIP Average Packet Rate
Figure 20 shows a trend where the number of gateways and host-connected switches is proportionate to the decreased packet rate.
[image:9.612.166.494.383.587.2]8.2.5Packet Success Rate
Figure 21: VoIP Packet Success Rate
Figure 21 shows that all VoIP packets are successfully sent in any topology with different combination of L1 and L2.
8.3 Telnet
For Telnet, a traffic is sent to destination host/protocol with UDP protocol, with constant rate: 1000 packet / s.
1247
Figure 22 : Telnet Average Delay
Figure 22 shows a trend where the number of gateways and host-connected switches are proportionate to the increased delay, with an exception of decreasing value from 0.121 ms (L1=3, L2=2) to 0.119 ms (L1=3, L2=3)
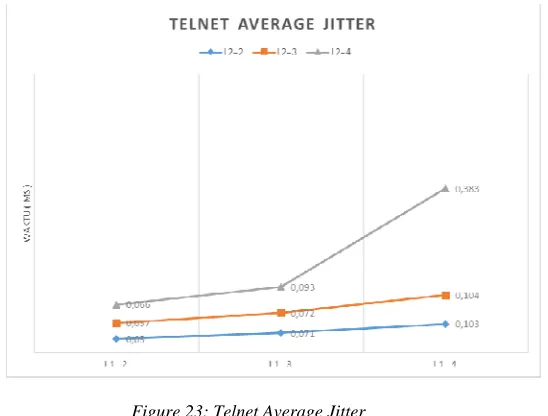
[image:10.612.189.463.381.589.2]8.3.2Average Jitter
Figure 23: Telnet Average Jitter
1248
[image:11.612.198.462.114.311.2]8.3.3Average Bit Rate
Figure 24 : Telnet Average Bit Rate
Figure 24 shows a trend where the number of gateways and host-connected switches are proportionate to the decreased bit rate.
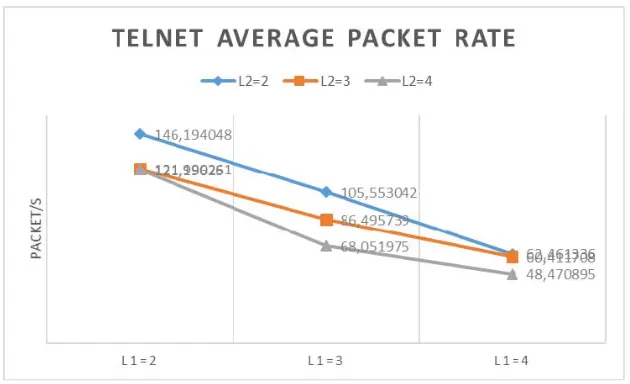
[image:11.612.156.471.393.585.2]8.3.4Average Packet Rate
Figure 25 : Telnet Average Packet Rate
1249
[image:12.612.145.477.106.313.2]8.3.5Packet Success Rate
Figure 26 : Telnet Packet Success Rate
Figure 26 shows that all Telnet packets are successfully sent in any topology with different combination of L1 and L2.
8.4DNS
For DNS, a traffic is sent to the destination host / server with UDP protocol, with constant rate: 1000 packets / s.
[image:12.612.190.471.468.666.2]8.4.1 Average Delay
Figure 27 : DNS Average Delay
1250 8.4.2Average Jitter
Figure 28 : DNS Average Jitter
Figure 28 shows a trend where the number of gateways and host-connected switches are proportionate to the increased jitter.
[image:13.612.183.480.402.647.2]8.4.3Average Bit Rate
Figure 29 : DNS Average Bit Rate
1251
8.4.4Average Packet Rate
[image:14.612.122.460.88.312.2]Figure 30 : DNS Average Packet Rate
Figure 30 shows a trend where the number of gateways and host-connected switches are proportionate to the decreased packet rate, with an exception of oddly increased packet rate at L1=3 and L2=4.
[image:14.612.150.478.400.609.2]8.4.5Packet Success Rate
Figure 31 : DNS Packet Success Rate
Figure 31 shows that all DNS packets are successfully sent in any topology with different combination of L1 and L2.
1252
9. CONCLUSION
The increased number of gateways and host-connected switches are proportionate to the increased value of delay and jitter and to the decreased value of bitrate and packet rate.
Minimum value of delay recorded is at 0.058 ms from UDP flow traffic, while the maximum delay recorded is at 2.474 ms from DNS traffic.
Running mininet and the controller on the same device (AMD A8-7410, 8 GB RAM computer), and the limitation of load balancer application and the Floodlight controller itself are most likely to contribute to an inconsistency in the experiment results.
The built-in load balancer application of Floodlight controller still needs an optimization in order to eliminate the inconsistency of the experiment results in bipartite topology.
REFERENCES:
[1] Ramdhani, M. F. S. N. H. B. D. (2016). Multipath Routing With Load Balancing And Admission Control In Software-Defined
Networking (Sdn), 4(C), 4–9..
Https://Doi.Org/10.1109/Icoict.2015.72314 [2] Negara, Ridha Muldina; Tulloh, Rohmat.
Analisis Simulasi Penerapan Algoritma Ospf Menggunakan Routeflow Pada Jaringan
Software Defined Network (Sdn). Jurnal
Infotel, [S.L.], V. 9, N. 1, P. 75-83, Feb. 2017. Issn 2460-0997. Available At: <Http://Ejournal.St3telkom.Ac.Id/Index.Php/I nfotel/Article/View/172>. Date Accessed: 21 Feb. 2018.
[3] Onf. (N.D.). The Architecture Of
Software-Defined Networks. Retrieved From
Https://Www.Opennetworking.Org
[4] Naqvi, H. A. (2015). Simulasi Dan Analisis Sistem Gateway Terdistribusi Untuk First-Hop Redundancy Dan Load Balancing. Tugas Akhir. Telkom University.
[5] Naqvi, H. A., Hertiana, S. N., & Negara, R. M. (2015). Enabling Multipath Routing For
Unicast Traffic In Ethernet Network. 2015
3rd International Conference On Information
And Communication Technology, Icoict 2015,
245–250.
Https://Doi.Org/10.1109/Icoict.2015.7231430 [6] Cisco. (2010). Cisco Icon Library.
[7] Open Networking Foundation. (2009).
Openflow Switch Specification 1.0.0 (Wire
Protocol 0x01). Current, 0, 1–36.
Https://Doi.Org/10.1002/2014gb005021 [8] Open Networking Foundation. (2013a). Sdn
Architecture Overview. Onf, 1–5.
[9] Open Networking Foundation. (2013b). Sdn In The Campus Environment.
[10] Open Networking Foundation. (2012). Software-Defined Networking: The New
Norm For Networks [White Paper]. Onf
White Paper, 1–12.
[11] Bernat, J. S. (2011). Redundancy And Load Balancing At Ip Layer In Access And Aggregation Networks. Master Thesis. Aalto University.
[12] Ejaz, S. K. (2011). Analysis Of The Trade-Off Between Performance And Energy Consumption Of Existing Load Balancing Algorithms, (November).
[13] Adani, M. F. (2014). Lkp : Simulasi Load Balancing Pada Perusahaan Daerah Air Minum Kota Surabaya. Undergraduated Thesis. Stikom Surabaya, 13–34.
[14] Kartadie, R., & Satya, B. (2015). Uji
Performa Kontroler Floodlight Dan
Opendaylight Sebagai Komponen Utama Arsitektur Software-Defined Network. [15] Pangestu, A. B. (2016). Analisis Uji Performa
Kontroler Jaringan Software Defined
Network (Sdn) Openflow Menggunakan Sistem Operasi Linux Ubuntu. Naskah Publikasi. Amikom Yogyakarta.
![Figure 1: Bipartite Topology [4][6]](https://thumb-us.123doks.com/thumbv2/123dok_us/8904430.956205/1.612.348.504.552.709/figure-bipartite-topology.webp)
![Figure 2: Architecture Of System [4][6]](https://thumb-us.123doks.com/thumbv2/123dok_us/8904430.956205/2.612.325.516.424.522/figure-architecture-of-system.webp)