ISSN: 1992-8645 www.jatit.org E-ISSN: 1817-3195
IMPROVED FAULT DETECTION IN WATER
DESALINATION SYSTEMS USING MACHINE LEARNING
TECHNIQUES
MORCHED DERBALI 1,2, ANAS FATTOUH2, HOUSSEM JERBI3, MOHAMED NACEUR
ABDELKRIM1
1
Unité De Recherché Modelisation, Analyse Et Commande Des Systemes, Enig, 6029 Gabes, Tunisie
2
Faculty Of Computing And IT, King Abdulaziz University, Jeddah, Saudi Arabia
3
University Of Hail, Deanship Of The Scientific Research, Hail, Saudi Arabia
E-mail: mderbali, afattouh{@kau.edu.sa}, [email protected], [email protected]
ABSTRACT
In this paper, the authors have attempted to study the fault detection using the machine learning technique for the water Membrane Distillation Systems (MDS). Initially, an actual system with the MDS, applying nanotechnology was developed which was based on actual measurements. Then, the errors occurring between the outputs of the model (additionally, these outputs serve as MDS inputs) and system outputs were classified for identifying the system faults. This type of classification was carried out by using different approaches and the classification results were further compared. It was noted that the classification accuracy obtained by using the decision trees was the best as compared to the other learning techniques like K-Nearest Neighbours, Neural Networks, and the Support Vector Machines (SVM).
Keywords: learning techniques, water membrane distillation system, desalination systems, fault detection, detection accuracy.
1. INTRODUCTION
1.1
Membrane Distillation SystemMembrane Distillation Systems (MDS) can be defined as an up-and-coming membrane separation technique which contains transporting water through a permeable hydrophobic membrane that could support the vapour-liquid interface. The actual force used in the Membrane Distillation (MD) technique that is provided by the difference in the vapour pressure is realistically generated due to the temperature difference that exists across the membranes, instead of the mass transfer effect which is produced due to the concentration gradient, pressure difference or the electrical potential gradients [1-3]. Though the MD technique was introduced way back in the 1960s [4, 5], it gained popularity as a desalination membrane, only in the 1980s. There were two factors which prevented the commercialisation of the MD technique [5, 6], i.e., a lack of inexpensive membranes having satisfactory features and a higher production cost as compared to the process of Reverse Osmosis (RO) [7]. According to the data collected for the MDS and the RO techniques, it
was seen that the membranes possessed a
low-temperature polarization coefficient of
ISSN: 1992-8645 www.jatit.org E-ISSN: 1817-3195
membranous pores; (C) at the least, one membrane section must be directly in contact with the liquid; (D) the membrane must not be made wet by the liquid; (E) the membrane pores must allow only the passage of vapour; and (F) the operating driving force of each membrane component leads to the occurrence of a fractional pressure gradient in the vapour stage.
The machine learning is one major subsection of the artificial intelligence. Machine learning is very important for building any type of intelligent system that contains features like language, vision, or intelligence. All of these tasks can be very difficult without using learning. Also, any system cannot be considered to be completely intelligent, when it does not involve learning because learning is the sole basis of intelligence. This is because the machine learning algorithms are driven by the data, and they can examine huge data volume. Furthermore, any human expert can examine only a small amount of data or is guided solely by impressions.
This paper was able to develop a learning approach for fault detection detecting in the water MDS. Initially, an actual system with the MDS, applying nanotechnology was developed, which was based on actual measurements. Thereafter, the system faults were identified after comparing this model and the system output errors. It should be noted that the suggested approach was able to distinguish and display a better-enhanced value as compared to the other methods.
This paper has been organized in the following manner: Section 2 described the other related works carried out for detecting in the desalination systems. Section 3 discussed the system’s architecture and the actual methodology used. Section 4 described the Methodology. Section 5 discussed the data Results. Section 6 presented the conclusion of the study while Section 7 presented the acknowledgment.
2. LITERATURE REVIEW
In the case of the Multi-Stage Flash (MSF), the faults are deducted using the neural network, Signed DiGraph (SDG) and fuzzy logics [16, 17]. Instead of using single approaches, a combination of the approaches could help yielding better results. These hybridisation techniques help in overcoming the limitations of single approaches.
In a previously published study in [1], a very simple SDG technique was applied. This technique was able to bypass the different controller-based faults in the simulation method. Also, the controller and all the set point values were similar. The MSF desalination process generally applies the SDG and the Dynamic Partial Least Square (DPLS) methods for deducing faults [4], wherein this hybrid combination applies the simplicity of the SDG technique along with its graphically represented relation between the connected variables. Also, the DPLS regression technique is used for desalination and the resulting data is compared in parallel. In the study, instead of using the fault results, the authors applied the set-point change data for piloting the network. The fault data compilation is very difficult as compared to the SDG construction, but SDG cannot work well for diagnosing several faults. In the case of the SDG, the relationship between the nodes can be denoted by making use of the arc present between the corresponding nodes. For the DPLS method, the faults are diagnosed by using the residuals that are defined to be the changes in the estimated and the measured data values.
i
y
i
y
i
r
=
−
ˆ
(1)In the above equation;
y
i
represents the actualmeasurement while
y
ˆ
i
represents the estimated value. The DPLS technique results are very comparable to the SDG results and range from negative, zero and positive values. If the faults are diagnosed, the resulting values could be negative or positive. Every detected fault is stored and recorded using the fault set. Several factors lead to the occurrence of faults; like faulty sensors or target variable-measured values, which can lead to incorrect results. Any variation in the mean can be detected by applying the CUMulative SUm control chart (CUSUM) process. Consider the value, 3σ, to be the average deviation threshold value. Then, the input variable reduction can be determined by a lack or existence of the faults present for any of the probable input variables. The constant variables are not accepted as input values in the case of the DPLS method. In the study, out of the 30 variables for the SDG technique, 12 were included in the DPLS process.ISSN: 1992-8645 www.jatit.org E-ISSN: 1817-3195
accuracy can be further improved by using qualitative simulation and fuzzy logic. However, these kinds of patterns are also known to lead to faults. The accuracy, ultimately, depends on a detailed knowledge regarding the operational process and the operator’s expertise. It is very difficult to supervise the associated system variables by applying the SDG, neural networks, statistical pattern recognition techniques, etc. The process is simplified by combining the online and the offline techniques. The offline technique can be applied only for the new plants using the one-to-one technique based on the expert system for identifying new rules. Whenever the faults are found, the method for the respective sector can be executed using the online stages. This process can successfully detect the faults by applying the fuzzy qualifiers. The fault diagnosing methods which were based on the true/false conditions were not able to detect these types of faults. Also, a slight deviation detected from the major faulty sequence is easy to detect using a set of rules, which are produced using the databases like the fault pattern, symptom sequence, etc. The SDG technique is seen to work very well when it is combined with the fuzzy logic process because it is a qualitative process which can improve the detection based on the causal information regarding the faults. Additionally, SDG requires a limited amount of information for fault detection. It works on the regular rule that “the causal and effect linkage should link the fault’s origin to the notable symptoms”. Hence, any small difference between the known variables can be difficult for identifying thus resulting in an incorrect identification of the existing faults. Several authors state this to be the SDG drawback [19-22]. The SDG process is more effective if it involves only a single-state transition variable during the fault propagation stage. However, though a combination of many interpretations would simplify the SDG complexity, it could hamper the efficiency of matching SDG’s fault pattern ability. But, a compromise can be possible if these fictitious arcs are avoided.
3. MEMBRANE DISTILLATION SYSTEM
ARCHITECTURE
In this study, we noted that a solar energy-based DCMD pilot plant (thermal plus PV) has been built, designed and tested at the CEDT- KAU, Jeddah, under the natural weather conditions and the results from this plant have been manipulated and used in this study [23].
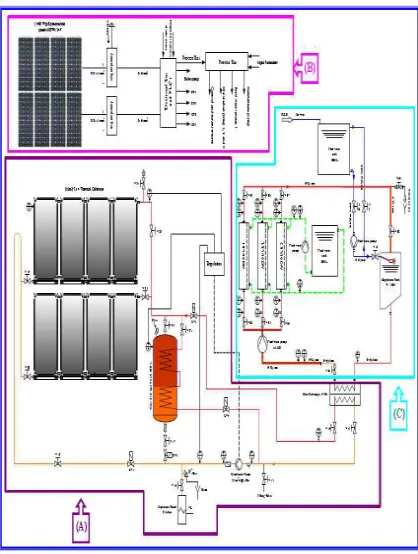
[image:3.612.314.523.242.519.2]As stated previously, MDS is a membrane separation technique which contains transporting water through a permeable hydrophobic membrane that supports the vapour-liquid interface. The main driving potential for this process is due to the difference of the vapour pressure resulting because of the existing difference of the temperature seen across the membranes. Hence, the separation method of the MDS and its resultant performance is due to the vapour-liquid equilibrium [1]. Further details regarding this system are described in Fig.1.
Figure 1: The membrane distillation system (MDS)
The desalination process involves three major parts: (A) The solar thermal system that produces hot water, (B) A necessary power supply for providing power, (C) A desalination system that produces fresh water.
ISSN: 1992-8645 www.jatit.org E-ISSN: 1817-3195
the complete project closure. It should be emphasised here, that only the US module was available, at that time, in the markets.
The DCMD pilot plant based on the solar energy (Thermal plus PV), which was designed at the King Abdulaziz University (KAU) [6, 23] verified that the sea and the brackish waters could be efficiently treated in the following manner. This could be achieved at the price of the temperature source which is provided at the interest zone. Actually, eight parameters are recorded by the system; Tin hot, Tout hot, Tin cold, Tout cold, Pin hot, Pout hot, Pin cold, Pout cold. Thus, the system operations could be controlled using six different parameters like heater, cooler, hot valve, cold valve, hot pump, and cold pump. All these parameters would be used for detecting the faults by considering the normal and the abnormal states.
4. METHODOLOGY
4.1 System Model
In Fig. 2, we have described the reasonable system’s operational flow, originating from the data collection to the system’s output. Several different phases contributed to the system’s development before it became fully operational. Some of these phases include data collection, wherein the data was collected for initial feasibility and studying its performance. The next was the system model and the design phase that involved the system modelling, simulations and prototyping depending on the preliminary data. This was followed by the system testing and the measurement phase; in which this system was checked for validating the performance and then, it was compared to the existing systems in parallel. Finally, based on these observations, we have presented our views in the study’s conclusion.
The Fig. 2 presents the model flowchart while the identification of the differences between the actual and the simulated system have been developed using Simulink, as depicted below:
Real Data Collection
Start
Testing & Measurement System Model & Design
Performance Analysis
Existing System Performance
Comparison
Conclusion & Recommendation
Output
Start
Validating Phase Data Collection
Phase
[image:4.612.307.519.74.312.2]Design Phase
Figure 2: The System Model Flowchart
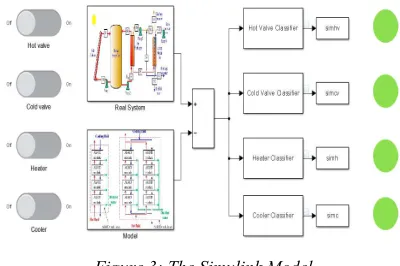
4.2 Simulink Model
The Fig. 3 describes all the types of faults categorised by the classifiers. The faults were deliberately inserted in the systems by switching off one valve. In this study, the system data was gathered by valves, i.e., mainly the pressure and the temperature parameters which are obtained by sensors. For generating faults, six actuators were deployed in the system, while sensors measured the impact. This pattern is a random process sequence, which helps in obtaining complete data. This data collection process is carried out during the normal and the abnormal state. In the case of the abnormal process, the data collection is carried out by using 4 control actuators, i.e., cold valve, hot valve, cooler and heater. All these control actuators are switched to the OFF state one by one, and also the behaviour of every parameter is noted individually during the normal and the abnormal operational process.
Figure 3: The Simulink Model
[image:4.612.316.516.574.707.2]ISSN: 1992-8645 www.jatit.org E-ISSN: 1817-3195
Tout hot (30.0 - 32.0), Tin cold (15.0 - 16.0), Tout cold (45.0 - 47.0), Pin hot (1.3 - 1.5), Pout hot (1.2 - 1.3), Pin cold (1.0 - 1.1), Pout cold (0.9 - 1.0).
Also, the simulation values can be validated using the data results that are gathered from the heater, cooler, cold valve and hot valve for determining the error probability.
In the case of Fig. 4, the researchers introduced some consecutive errors in the heater, cooler, cold valve and hot valve, after which the classifier output was noted and the experiment was repeated in the case of all other classifiers. As per the data results for the classifier output of hot valve, cold valve, cooler and the heater, the researchers noted that the mean Cooling Performance Coefficient (CPC) and the Heating Performance Coefficient (HPC) for the errors noted in the case of the heater, cooler, cold valve and hot valve, could be estimated accurately for an interval of approximately 10s. As noted, the exact amount of error for the hot valves could be noted accurately and presented in the hot valve classifier. Here, the value of 1 indicated the error existence for the hot valves. Similar results can be noted for the cold valve, which displayed its respective error value in the cold valve classier.
Figure 4: Introduction of successive errors
Figs. 5 and 6 indicate that an existing error in the hot valve is displayed in the hot valve classifier while the cool classifier displayed the errors in the cool valve. The performance of the system is observed and estimated for various system parameters displaying different errors. For instance; if there is an error noted in the cold valves, then the cold valve classifier displayed an accurate error. Lastly according to the authors’ best understanding, this study is the first of its kind which utilises Machine learning techniques for determining faults in the water desalination process.
Figure 5: Error analysis using Classifiers
ISSN: 1992-8645 www.jatit.org E-ISSN: 1817-3195
5. RESULTS AND DISCUSSION
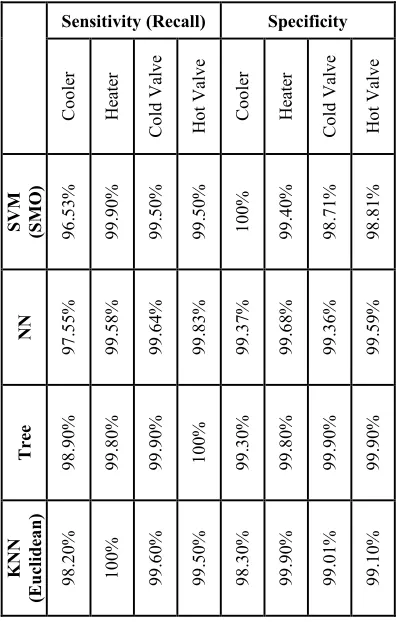
We observed that obtaining an estimation difference (an error) between the actual and the simulated models was quite normal, as the error could be independently distributed. The different class behaviours could be examined using various classifiers, sensitivity, accuracy, specificity, using different processes. The process efficiency is further improved by using the F-measure described below. Table 1 displays different values for different parameters when they are tested with various different classification techniques. Since the F-measure also considers precision, we have considered this to be an appropriate process, as our assessment depends on the precision. After combining the classification of the heater, cooler, cold and hot valve, we conclude that the Decision Tree is better than other approaches as it achieves an F-measure of 99.6875%. This approach is followed by the Neural Network approach having 99.3225%, K-Nearest Neighbour with 99.2% and the Linear Discriminant with 99.0325%. After comparing these techniques with the Quadratic Discriminant Linear Discriminant, and the Naïve Bayes classification technique described in the earlier report at [7], we note that the techniques discussed in this report have a better performance. Furthermore, it can be seen that the sensitivity was considerable improved when the Decision Tree method was compared to all other existing techniques.
[image:6.612.330.528.145.456.2]Despite observing that the Decision Tree classification technique is better than other techniques, it does not display a very significant difference. As per the results described in Tables 1 and 2, the Decision Trees were seen to be a better classification technique for detecting faults in the desalination process. They are very accurate and also help in a speedy data processing and use less memory space. They are very easily interpreted and are able to handle the predictors in a proper manner. The Discriminant analysis which displayed a similar speed and memory use performance as the Decision Trees was not able to perform well for the F-measure and for other parameters.
Table 1: Classification results using different parameters
Sensitivity (Recall) Specificity
ISSN: 1992-8645 www.jatit.org E-ISSN: 1817-3195
Precision Accuracy
[image:7.612.86.520.82.655.2]C o o le r H ea te r C o ld V al v e H o t V al v e C o o le r H ea te r C o ld V al v e H o t V al v e S V M (S M O ) 1 0 0 % 9 9 .4 0 % 9 8 .7 0 % 9 8 .8 0 % 9 8 .2 0 % 9 9 .6 5 % 9 9 .1 0 % 9 9 .1 5 % N N 9 9 .3 8 % 9 9 .6 8 % 9 9 .3 6 % 9 9 .5 9 % 9 8 .4 4 % 9 9 .6 3 % 9 9 .5 0 % 9 9 .7 1 % T re e 9 9 .3 0 % 9 9 .8 0 % 9 9 .9 0 % 9 9 .9 0 % 9 9 .1 0 % 9 9 .8 0 % 9 9 .9 0 % 9 9 .9 5 % K N N ( E u cl id ea n ) 9 8 .3 0 % 9 9 .9 0 % 9 9 .0 0 % 9 9 .1 0 % 9 8 .2 5 % 9 9 .9 5 % 9 9 .3 0 % 9 9 .3 0 % F-Measure C o o le r H ea te r C o ld V al u e H o t V al v e S V M (S M O ) 9 8 .2 3 % 9 9 .6 5 % 9 9 .1 0 % 9 9 .1 5 % N N 9 8 .4 5 % 9 9 .6 3 % 9 9 .5 0 % 9 9 .7 1 % T re e 9 9 .1 0 % 9 9 .8 0 % 9 9 .9 0 % 9 9 .9 5 % K N N (E u cl id ea n ) 9 8 .2 5 % 9 9 .9 5 % 9 9 .3 0 % 9 9 .3 0 %
Table 2: Generic comparison of various algorithms [9]
Based on the conclusions of our earlier study, we have demonstrated that the SVM speed and the memory usage were better for some support vectors; which were difficult to interpret though the linear kernel was used. On the other hand, the speed and memory usage for the Naïve Bayes were better for simple distributions. The Nearest Neighbour technique was better for predicting the lower dimensions; while Fitting could be carried out for the kd-trees but could not be used in the case of the linear searches. Also, the predictors could be either categorical or are continuous in nature, but never both. Furthermore, the Discriminant analysis was seen to be accurate when the modelling assumptions like the multivariate normal by class could be satisfied, or the prediction accuracy varied.
6. CONCLUSIONS
In this study, we have carried out the simulation of an actual desalination process and the results obtained were measured using the recorded
A lg o ri th m P re d ic a ti v e A cc u ra cy F it ti n g S p ee d P re d ic ti o n S p ee d M em o ry U sa g e E a sy t o I n te rp re t H a n d le s C a te g o ri ca l P re d ic to rs T re es M ed iu m F as t F as t L o w Y es Y es S V M H ig h M ed iu m
* * * No
ISSN: 1992-8645 www.jatit.org E-ISSN: 1817-3195
parameters. These parameters were collected for the normal and the abnormal states of the operation. The results were further classified using several classifiers like the SVM, Decision Trees, Naïve Bayes and the KNN approaches. According to the results obtained, it could be seen that the decision tree was a better classification method as compared to others. Additionally, it was seen that the actual difference between all the approaches used was not very significant. However, based on the speed and the memory use, it was seen that the Decision Trees was a better approach for these type of classifications, as it performed better than the other techniques by obtaining an F-measure value is equal to 99.6875%. This approach is followed by the Neural Network approach having 99.3225%, K-Nearest Neighbour with 99.2% and the Linear Discriminant with 99.0325%. Moreover, it could be seen that the fault trees possessed some additional benefits. The fault tree was able to generate a visual record of any system which displayed the logical relationship between the actions and the reasons which caused system failure. This helped others to observe the analysis results and recognize the design weaknesses and to identify errors. Also, a fault tree would help in ranking the issues which contributed to failure and that needed fixing. The fault tree diagram formed a basis for additional analysis and assessment. For instance; when the system underwent any type of change or upgrades, the steps for potential effects and further variations were already established.
7. LIMITATION AND FUTURE WORK
The main objective of the proposed method is to study fault detection in water desalination systems. The difficulties in the collection of data where the data is used in this research is real data that was recorded from an existing model. The data acquired at normal conditions and wait until all the parameters of the system settle on the nominal values, and then made a breakdown in the system and recording data, and then the two types of data is acquired, we applied on the Matlab and then tested a number of case studies. As a future work, different types of faulty are going to be investigated and proposed a model to solve the chain of fault detection at once.
8. ACKNOWLEDGEMENTS
The authors would like to acknowledge the help of the following people for allowing them to use the CEDT research data which was related to the
operational parameters of the membrane distillation project for analysis and simulation. Salah T. Bouguecha, Samir E. Aly, Mohammad H. Al-Beirutty, Mohamed M. Hamdi.
Centre of Excellence in Desalination
Technology, King Abdulaziz University, PO Box 80200, Jeddah, 21589, Saudi Arabia.
REFRENCES:
[1] E. E. Tarifa and N. J. Scenna, “Fault diagnosis for a MSF using a SDG and fuzzy logic,”
Desalination, vol. 152, pp. 207-214, 2003. [2] E. E. Tarifa, D. Humana, S. Franco, S. L.
Martínez, A. F. Núñez, and N. J. Scenna, "Fault diagnosis for MSF dynamic states using neural networks," Desalination, vol. 166, pp. 103-111, 2004.
[3] E. E. Tarifa, D. Humana, S. Franco, S. L. Martínez, A. F. Núñez, and N. J. Scenna, "Fault diagnosis for a MSF using neural networks,"
Desalination, vol. 152, pp. 215-222, 2003. [4] S. J. Ahn, C. J. Lee, Y. Jung, C. Han, E. S.
Yoon, and G. Lee, "Fault diagnosis of the multi-stage flash desalination process based on signed digraph and dynamic partial least square,"
Desalination, vol. 228, pp. 68-83, 2008.
[5] E. E. Tarifa and N. J. Scenna, "A methodology for fault diagnosis in large chemical processes and an application to a multistage flash desalination process: Part I," Reliability Engineering & System Safety, vol. 60, pp. 29-40, 1998.
[6] E. E. Tarifa and N. J. Scenna, "A methodology for fault diagnosis in large chemical processes and an application to a multistage flash desalination process: Part II," Reliability Engineering & System Safety, vol. 60, pp. 41-51, 1998.
[7] V. Venkatasubramanian, R. Rengaswamy, S. N. Kavuri, and K. Yin, "A review of process fault detection and diagnosis: Part III: Process history based methods," Computers & chemical engineering, vol. 27, pp. 327-346, 2003.
[8] M. Sokolova, N. Japkowicz, and S.
Szpakowicz, "Beyond accuracy, F-score and ROC: a family of discriminant measures for performance evaluation," in AI 2006: Advances in Artificial Intelligence, ed: Springer, 2006, pp. 1015-1021.
ISSN: 1992-8645 www.jatit.org E-ISSN: 1817-3195 3rd International Conference on Mathematical
Sciences & Computer Engineering,2016. [10] B. Baharudin, L. H. Lee, and K. Khan, "A
review of machine learning algorithms for text-documents classification," Journal of advances in information technology, vol. 1, pp. 4-20, 2010.
[11] Y. Zeng, L. Wang, X. Deng, X. Cao, and N. Khundker, "Secure collaboration in global design and supply chain environment: Problem analysis and literature review," Computers in Industry, vol. 63, pp. 545-556, 2012.
[12] A. M. Sarhan, H. I. Elbehery, and G. M. Hamisa, "Advanced Vertical Search Engine Idea for HTML Pages," Artificial Intelligent Systems and Machine Learning, vol. 7, pp. 69-73, 2015.
[13] G. Rao, S. R. Hiibel, A. Achilli, and A. E. Childress, "Factors contributing to flux
improvement in vacuum-enhanced direct
contact membrane distillation," Desalination, vol. 367, pp. 197-205, 2015.
[14] H. C. Duong, S. Gray, M. Duke, T. Y. Cath, and L. D. Nghiem, "Scaling control during membrane distillation of coal seam gas reverse osmosis brine," Journal of Membrane Science, vol. 493, pp. 673-682, 2015.
[15] K. W. Lawson and D. R. Lloyd, "Membrane distillation," Journal of membrane Science, vol. 124, pp. 1-25, 1997.
[16] H. El-Dessouky, H. I. Shaban, and H. Al-Ramadan, "Steady-state analysis of multi-stage flash desalination process," Desalination, vol. 103, pp. 271-287, 1995.
[17] A. Woldai, Multi-Stage Flash Desalination: Modeling, Simulation, and Adaptive Control
CRC Press, vol. 1, 2015.
[18] A. Lindhe, L. Rosén, T. Norberg, and O. Bergstedt, "Fault tree analysis for integrated and probabilistic risk analysis of drinking water systems," Water research, vol. 43, pp. 1641-1653, 2009.
[19] M. Gandhi and O. Gandhi, "Identification and Assessment of Factors Influencing Human Reliability in Maintenance Using Fuzzy Cognitive Maps," Quality and Reliability Engineering International, vol. 31, pp. 169-181, 2015.
[20] D. Peng, Z. Geng, and Q. Zhu, "A Multilogic Probabilistic Signed Directed Graph Fault Diagnosis Approach Based on Bayesian Inference," Industrial & Engineering Chemistry Research, vol. 53, pp. 9792-9804, 2014.
[21] S. Rajakarunakaran, "Design and development of intelligent decision support system for safety management in process industries," a reservoir of Indian theses,2014.
[22] D. Otoo, "Multi objective node routing problem with time windows: an alternate approach to solid waste collection and disposal in developing countries," Kwame Nkrumah University of Science and Technology Kumasi, Ghana, 2014.
![Table 2: Generic comparison of various algorithms [9]](https://thumb-us.123doks.com/thumbv2/123dok_us/8908146.957840/7.612.86.520.82.655/table-generic-comparison-various-algorithms.webp)
