Full Length Research Article
FLEXIBILITY AND EFFECTIVENESS IN REVERSE LOGISTICS OF PRODUCT RETURNS IN
THE FORM OF PARTS AND SUB-ASSEMBLIES
*,1
Sanjay Bokade and
2Raut, D. N.
1
Department of Mechanical Engineering, Rajiv Gandhi Institute of Technology, Andheri-West, Mumbai, India
2
Department of Production Engineering, Veermata Jijabai Technological Institute, Matunga, Mumbai, India
ARTICLE INFO ABSTRACT
Reverse logistics has become a major component of extended producer’s responsibility. The dynamic nature of reverse logistics and the uncertainties within it demands more investigations on its variables. This paper elaborates the findings of a survey using factor analysis in investigations of factors influencing return handling of products in the form of parts and subassemblies. The Statistical Package for Social Sciences version 17 was used to analyze the effect of independent variables on key dependent variables. A survey was carried out over the firms experiencing product returns in terms of parts and sub-assemblies in the vicinity of Mumbai, India. It revealed product design, retrieval centers, information technology, return policies; organizational role and forecasting have significant effect on the flexibility and effectiveness of reverse logistics of parts and sub-assemblies. Implementing reverse logistics with adequate consideration to these factors could bring enterprises a competitive advantage and many business opportunities. This research contributes to theory of reverse logistics with an anticipation of providing guidelines to the enterprises taking up the reverse logistics program.
Copyright © 2014. Sanjay Bokade and Raut, D. N. This is an open access article distributed under the Creative Commons Attribution License, which permits unrestricted use, distribution, and reproduction in any medium, provided the original work is properly cited.
INTRODUCTION
Supply chain management is undoubtedly a primary concern for any enterprise of today for being competitive. The forward logistics in the supply chain had been studied so well and various models for an efficient handling of the same have been worked out by different researcher, practitioners and academicians. The need of reverse logistics has been realized as a result of environmental safety and the regulations pertaining to it in different nations. The companies involved in manufacturing are incorporating reverse logistics in their supply chain management activities also many business enterprises look at reverse logistics as gaining business advantage on product returns (Das and Chaudhury, 2012). Many studies have given different insights on this topic. Moore (2006) in his investigations mentions, “It is estimated that reverse logistics costs account for almost one percent of the total United States gross domestic product and is rapidly becoming an integral component of retailers and manufacturers profitability and competitive position”.
*Corresponding author: Sanjay Bokade
Department of Mechanical Engineering, Rajiv Gandhi Institute of Technology, Andheri-West, Mumbai, India
“The Center for Logistics Management at the University of Nevada conservatively estimates that 6 percent of all goods may be returned, but concedes that the true number may be closer to 8 percent” (Roger & Tibben-Lembke, 1999). The literature on reverse logistics is often seen in form of descriptive nature exploring the area of reverse logistics and its implementation. However, the literature on the service improvement and effectiveness of reverse logistics is surprisingly less. We set our objectives with respect to these research gaps as to identify the factors influencing the flexibility and effectiveness of reverse logistics. For the present study, the product returns taken into consideration are the returns in the form of part and subassemblies.
LITERATURE REVIEW
Reverse logistics was seen as an important concern by the various enterprises in 90’s. (Pohlen & Farris, 1992) defined reverse logistics as,“ The movement of goods from customer towards a producer in a channel of distribution”. Roger & Tibben-Lembke,(1999), Dowlatsahi, (2000), Dowlatsahi, (2005), Brito and Dekker, (2003) also defined reverse logistics in their own words however the definations reflect similar concept. The concept is moving of the product back into the
ISSN:
2230-9926
International Journal of Development Research
Vol. 4, Issue, 3, pp. 491-495, March,2014
DEVELOPMENT RESEARCH
Article History:
Received 30th December, 2013
Received in revised form 13th January, 2014
Accepted 11th February, 2014
Published online 05th March, 2014
Key words:
supply chain for the purpose of capturing value or otherwise disposal.Reverse logistics activities begins after the sale of the product. These activities are multilple in nature which include customer support, product warranties, maintaenance and repair, product upgrades, sales of complementary products and the product disposal (Aminia et al., 2005). Legistations of different nations are making it mandetory for the proper disposal of the product in order to protect the environment and reduce the issues of land fill.European legislation is believed to be more advanced in the regulations on recycling and disposal of by-product (Lambert et al., 2011). The concern of enviroment motivated reverse flows and thus reverse logistics become the subject of research (Fleischmann et al., 1997).
Adenso-Dıaz et al. (2012) carried an analysis of the main factors affecting bullwhip effect in reverse supply chains and identified demand variance, forecasting technique, demand variability, the delays between the chain’s links and shared information being available are the accalerators for bull-whip effect in reverse supply chain. The two main componants of any successful reverse logistics system are information management and disposal system (Lambert et al., 2011). Thierry et al. (1995) gives five categories of product recovery as remanufaturing, repairing, refurbishing, cannibalization and recycling. Mukhopadhyay & setuputro, (2005) proposed a planning approach of reverse logistics based on modular product design..The importance of reverse logistics is extremly difficult to evaluate due to its existence within the logistics infrastructure of the company (Stock, 2001). A good reverse logistics program should have flexibility and effectiveness. These variables were taken as performance indicators for reverse logistics.
THEORY DEVELOPMENT
Development of Constructs
Any product design is appreciable if it is avoiding undesired aspects in the particular product (Chitale & Gupta, 2008). Most of the reverse logistics activities mainly focus on remanufacturing & recycling (Dowlatsahi, 2000). Thus, it is clear that product design influence remanufacturing flexibility. Use of information technology refers to supplement the reverse logistics activities with its modern compatibility. Govindan et al. (2012) proposed information technology as an attributes to reverse logistics. Thus information technology will exhibit important role in flexibility and effectiveness of reverse logistics. Return policies can be seen as major drivers for sales and customer satisfaction. Liberal or restrictive return policies make a significant effect on product return handling (Richey et al., 2005). Return policies play an important role in effective reverse logistics program and is thus considered as an important independent variable. The construct of organizational role refers to decision making on the arrival of product return. Decision makers must be aware of the relative importance of the various drivers and the techniques for implementing them. Reverse logistics is an activity within the organization that intends towards customer satisfaction (Meade and Sarkis, 2002). Strategic planning in supply chain management considers the issues such as organizational structure, top management support and the all other activities focusing to develop an effective supply chain (Gunasekaran et
al, 2004). Thus, organizational role governs the flexibility in
reverse logistics. Forecasting refers estimates on product returns and can be treated as preplanning for handling of returns. Toktay et al., (2003) finds that future returns are the function of past sales. Thus, forecasting can make significant effect on improving effectiveness of reverse logistics program of any enterprise. Flexibility can be defined as “the capacity of manufacturing system to adapt successfully to changing environmental condition as well as changing product and process requirement” Swamidass,(2000). Returns may vary largely on the condition and the severity as well. The remanufacturing systems need to be adaptable as to this variation. Flexible remanufacturing systems can make it easy for the reverse logistics for the parts and subassemblies. Effectiveness refers to the level of performance exhibited by the program and hence is taken as an important performance indicators. The organization, which observes higher rate of returns, tends to develop a reverse logistics program more effectively (Johnson, 1998). The study on the challenge of reverse logistics in catalog retailing by Autry et al.,(2001) reached to the conclusion that smaller volume firms are performing well in terms of reverse logistics.
Conceptual Framework
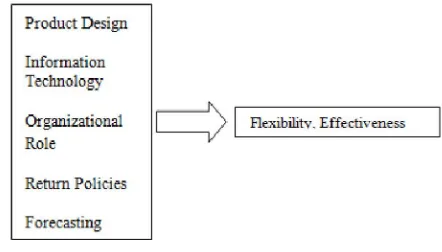
[image:2.595.323.544.369.495.2]The scope of this research is within the conceptual framework presented in the figure 1 with the returns as parts and subassemblies
Figure 1. Conceptual Framework
RESEARCH METHODOLOGY
Hypotheses
H1 Product design strategies for environment will make a significant effect on flexibility of reverse logistics system H2 Use of information technology as an enabler for return processing will makes a significant effect on the flexibility reverse logistics
H3 Organizational role in decision making on the returns will make a significant effect of flexibility of reverse logistics
H4 Use of information technology as an enabler for return processing will make a significant effect on the effectiveness of reverse logistics
H5 Liberal return policies will have a significant effect on the effectiveness of the reverse logistics.
H6 Forecasting the expected returns will have a significant effect on the effectiveness of reverse logistics.
Data Collection
researcher to obtain observations five times greater than the number of variables to be analyzed. Thus 383 were adequate to take up the analysis.
Measurement Scales
Measurement scales used in this analysis were all matured scales from previous research. Respondents were asked to mark their response on a 0- 5 Point scale [0= not at all, 1 = to very little extent, 2 = to some extent, 3 = to reasonable extent, 4 = to reasonably high extent, 5 = to very high extent].
Validity and Reliability
[image:3.595.327.543.366.769.2]We made an initial test of KMO and Bartlett’s test of sphericity to check sampling adequacy for factor analysis. The test resulted in the values greater than 0.5 indicating the sample being adequate for factor analysis Kaizer, (1974). Barttlet’s test was favorable representing the existence of correlation amongst the variables selected. The factors loading values were always greater than 0.40 indicating significant convergent validity Narkhede et al., (2012). Matrix had no cross loading which ensured significant discriminant validity. Constructs had significant nomological validity, as the scales used were all matured scales Hair et al., (2012). Reliability of the data was ensured using reliability coefficient. Cronbach alpha assesses the consistency of the entire scales, the suggested Cronbach alpha is a minimum of 0.60 Hair et al., (2012), Hulland, (1999). The reliability test resulted in Cronbach alpha above 0.60 indicating significant reliability of measures. Table 1 shows correlation matrix Table 2 gives complete statistics of constructs.
Table 1. Correlation Matrix
PD IT RP OR F FX ERL
PD 1 IT .181** 1
RP .021 .539** 1 OR -.131* .266** .462** 1
F -.033 .382** .412** .395** 1
FX .393** .280** .129* .148** .274** 1
ERL -.124* .416** .432** .337** .572** .104* 1
*. Correlation is significant at the 0.05 level (2-tailed). **. Correlation is significant at the 0.01 level (2-tailed)
RESULTS AND DISCUSSION
To test the effect of product design, use of IT, return policies, organizational role and forecasting on the Flexibility and Effectiveness of reverse logistics following equations were made.
Flexibility= α + β1* PD + β2*IT + β3*OR
Effectiveness= α + β1* RC + β2*IT + β3*RP + β4*F
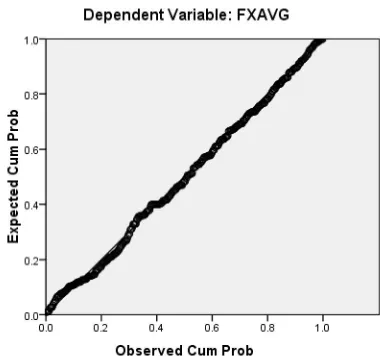
We tested (H1, H2, H3) effect of product design, information technology and organizational role on the flexibility of reverse logistics. The test resulted in the R2 value of .220 representing a good model fit. This value is significant to define a high strength of association of the variables. H1 is supported with β value of .382 and P value .000. H2 is supported with β value of .170 and P value of .000. H3 is supported with β value of .152 and P value of .002. Normality of the error terms were tested by examining Histogram and Normal Probability plot. Histogram being the simplest diagnostic tool for normality checks (Hair et al, 2012). The visual check of histogram indicates an approximately normal distribution. If the distribution is normal, the residual line closely follows the diagonal (Hair et al, 2012). The examination of normal probability plot indicates the normal distribution. Multicollinearity test was carried to examine the existence of any multicollinearity affecting the analysis. The tolerance values and Variance inflation factors were checked. There was no multicollinearity within the variables observed. Accepted level of tolerance upto 0.10 corresponding to VIF of 10 (Hair
et al, 2012) was considered.
[image:3.595.47.278.433.520.2]Figure 1. Histogram for normality check
[image:3.595.42.283.569.700.2]Figure 2. Normal Probability Plot for normality check Table 2. Statistics of construct
Constructs KMO values
Cronbach Alpha
Eigen Values
% Variance explained
No. of Factors Indicated
PD .819 .943 5.866 15.933 04
IT .845 3.764 29.787 05
RP .823 2.180 42.626 04
OR .823 1.561 52.954 03
F .672 1.100 71.713 03
FX .740 .817 3.752 20.251 04
[image:3.595.336.526.587.767.2]Figure 4. Histogram for normality check
Figure 5. Normal Probability Plot for normality check
We tested H4, H5and H6 for effect of information technology, return policies and forecasting on the
effectiveness of reverse logistics. The test resulted in the R2 value of .392 representing a very good model fit. H4 is supported with β value of .170 and P value of .001. H5 is supported with a β value of .164 and the P value of .001. H6 is supported with β value of .443 and P value of .000.
The resulting equations after analysis.
Flexibility = 0.382 PD + 0.170 IT + 0.152 OR Effectiveness = 0.170 IT + 0.164 RP +0.443 F
CONCLUSIONS
This study has the limitation of product return in the form of parts and subassemblies and the only performance measure considered for the study are the flexibility and effectiveness of reverse logistics. In this study, we have empirically studied the role of product design, use of information technology, return policies, importance of organizational decision making and forecasting. The analysis of data was from small to large-scale. The present research offers a scope of study on a very similar ground where the returns could be categorized in terms of the degree to which the cause of return may be estimated.
REFERENCES
Adenso-Dıaz, B., Moreno, P., Gutierrez, E. and Lozano S. 2012. “An analysis of the main factors affecting bullwhip in reverse supply chains”, International Journal of
Production Economics, Vol. 135, pp.917–28.
Amini, A., Retzlaff-Roberts, B. and Bienstock, C. C. 2005. “Designing a reverse logistics operation for short cycle time”, International Journal of Production Economics, Vol. 96, pp.367–80.
Autry, C. W., Daughetry, P. J., R. Glen Richey. 2001. “The challenges of reverse logistics in catlog retailing”,
International Journal of Physical Distribution and Logistics Management, Vol. 31 No1, pp.26-37.
Donald, S.B. 2005. Reverse Logistics and close loop supply chain process, CRC press, Boca Raton London.
Brito, M. P. and Rommet Dekker. 2003. “A Framework for
Reverse Logistics”, ERIM report series reference no
ERC-2003-045-LIS Erasmus University Rotterdam. Chitale, A. K. and Gupta, R. C. 2008. Product Design and
Manufacturing, Prentice hall of India.
Das, K. and Chaudhury, A. 2012. “Designing a reverse logistics network for optimal collection, recovery and quality based product mix planning”, International
Journal Production Economics, Vol. 135, pp.209-21.
Dowlatsahi Sahad. 2000. “Developing a Theory of Reverse Logistics”, Interfaces Vol.30, pp.143-55.
Dowlatsahi Sahad. 2005. “A strategic framework for the design and implementation of remanufaturing operations in reverse logistics”, International Journal of Production
Research. Vol. 43 (16), pp.3455-80.
Fleischmann, M. R., Dekker, R., E. Van der Lann and Van Wassenhove. 1997. “Quantitative models for reverse logistics:A review”, European Journal of Operational
Research, Vol. 103, pp.1-17.
Gunasekaran, A., Patel, C. and Ronald, E. M. 2004. “A framework for supply chainperformance measurement”,
International Journal Production Economics, Vol. (87),
[image:4.595.68.260.264.478.2]pp.333-47.
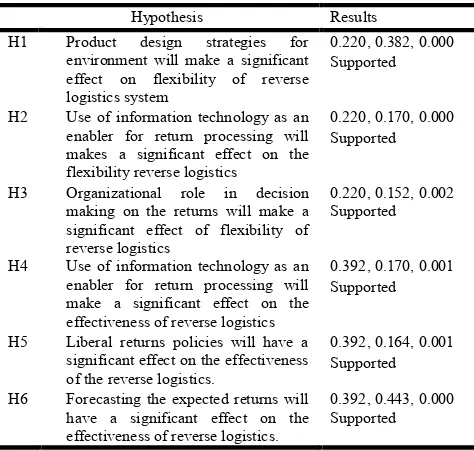
Table 3. Hypothesis Test Results
Hypothesis Results
H1 Product design strategies for environment will make a significant effect on flexibility of reverse logistics system
0.220, 0.382, 0.000 Supported
H2 Use of information technology as an enabler for return processing will makes a significant effect on the flexibility reverse logistics
0.220, 0.170, 0.000 Supported
H3 Organizational role in decision making on the returns will make a significant effect of flexibility of reverse logistics
0.220, 0.152, 0.002 Supported
H4 Use of information technology as an enabler for return processing will make a significant effect on the effectiveness of reverse logistics
0.392, 0.170, 0.001 Supported
H5 Liberal returns policies will have a significant effect on the effectiveness of the reverse logistics.
0.392, 0.164, 0.001 Supported
H6 Forecasting the expected returns will have a significant effect on the effectiveness of reverse logistics.
[image:4.595.44.281.524.749.2]Govindan, K., Palaniappan, M., Zhu Q. and Devika, K. 2012. “Analysis of third party reverse logistics provider using interpretive structural modeling”, International Journal of
Production Economics, pp.Article in press.
Hair, J.F., Black, W.C., Babin, B.J., Anderson, R.E. and Tatham R.L. 2012. Multivariate Data Analysis. Pearson
Publication , Dorling Kindersley (India) Pvt Ltd.
Hulland, J. 1999. “Use of partial least squares (PLS )in strategic management research: A review of four recent studies”, Strategic Management Journal, Vol. 20(2), pp.195–204.
Johnson, P. F. 1998. “Managing Value in reverse Logistics system”, Transportation Research- Part E (Logistics and
Transportation Review) , Vol. 34 No. 3, pp.217-27.
Kaizer, Henry, F. 1974. “An Index of Factorial Simplicity”,
Psychometrika, Vol. 39, pp.31-36.
Lambert, S., Riopel, D. and Abdul-Kader, W. 2011. “A reverse logistics decisions conceptual framework”,
Computer and Industrial Engineering, Vol. 61(3),
pp.561-81.
Meade, L. and Joseph, S. 2002. “A conceptual model for selecting and evalauating third party logistics”, Inform
Global. Supply Chain Management, Vol. 7(5), pp.283-95.
Moore, R. 2006. “Reverse Logistics: The Least Used Differentiator”, Reverse Logistics Magazine.pp. 10-13. Mukhopadhyay, S. K. and Setuputro, R. 2005. “Optimal return
policy and modular design for build to order products”,
Journal of Operations Management, Vol. 23, pp.496-506.
Narkhede, B. E., Nehete, R. S. and Mahajan, S. K. 2012. “Exploring linkages between manufacturing Functions, operations priorities and plant Performance in manufacturing SMEs in mumbai” , International Journal
for Quality research, Vol.6(1), pp.9-22.
Pohlen, T. L. and Farris, M. T. 1992. “Reverse Logistics in Plastic Recycling”, International Journal of Physical
Distribution and Logistics Management, Vol. 22(7), pp.
35-37.
Richey, R. G., Chen, H., Stefan, G. and Daugherty, P. 2005. “Developing effective reverse logistics program”, Indian
Marketing Management, Vol. 34, pp.830-40.
Roger, D. and Tibben-Lembke. 1999. Going Backwards: Reverse Logistics Trends and Practices, Reverse logistics
Executive Council. University of Nevada, Reno.
Stock, J. R. 2001. “The 7 deadly sins of reverse logistics”,
Material Handling Management Vol. 56(3), pp.5-11.
Swamidass, P. 2000. Encyclopedia of Production and Manufacturing Management, Bosten: Kulwer. USA. Thierry, M., Salmon, M., Van, Nunen and Van, Wassehove,
1995. “Strategic production and operation management issues in product recovery management”. California
Management Review, Vol. 37, pp.114-35.
Toktay, B., Erwin, A. and Brito, D. 2003. Managing Product Returns: The Role of Forecasting. Rotterdam,
Netherlands: Erim Report Series Research In
Management.