ISSN: 1992-8645 www.jatit.org E-ISSN: 1817-3195
5126
IDENTIFICATION OF GUAVA FRUIT MATURITY USING
DEEP LEARNING WITH CONVOLUTIONAL NEURAL
NETWORK METHOD
1P.A. SUNARYA, 2A.B. MUTIARA, 3R. REFIANTI, 4M. HUDA
1Department of Informatics Engineering, STMIK Raharja, Indonesia
2Faculty of Computer Science and Information Technology, Gunadarma University, Indonesia
3Faculty of Computer Science and Information Technology, Gunadarma University, Indonesia
4Faculty of Computer Science and Information Technology, Gunadarma University, Indonesia
E-mail: 1[email protected], 2,3{amutiara,rina}@staff.gunadarma.ac.id
ABSTRACT
Guava is one of the most popular agricultural commodities. Guava is not only rich in vitamin C but also contains several types of minerals that can counteract various types of degenerative diseases, and maintain body fitness. One type of guava is Red Guava Getas. Identifying the maturity of guava fruit by farmers is still done manually by doing direct visual observations on the fruit to be classified. Weaknesses in performing visual observations are directly influenced by human consistency in the identification process, so that in certain conditions will occur inaccurately. Therefore, a technology is needed to use computer assistance to help identify the results of the examination and conclude the identification results more accurately. This application uses deep learning with the Convolutional Neural Network (CNN) method
with LeNet architecture. Making this application uses the Python programming language and Keras as a back-end Tensorflow. From the tests carried out, it is obtained a percentage of 50% for 100 training data and 10 epochs, a percentage of 85% for 100 training data and 20 epochs, a percentage of 92% for 140 training data and 10 epochs, and the last percentage of 100% for 140 training data and 20 epochs.
Keywords: Convolutional Neural Network, Deep Learning, Image Classification, LeNet, Guava Fruit, Python
1. INTRODUCTION
Guava is one of the most popular agricultural commodities. Guava is not only rich in vitamin C but also contains several types of minerals that can counteract various types of degenerative diseases, and maintain body fitness. One type of guava is red guava getas. Guava (Psidium guava) or commonly called guava, guava, or guava actually comes from Brazil. Distributed to Indonesia through Thailand. The fruit is round, green, has a lot of seeds, and lots of flesh is white or pink. The leaves are oval round and leaf fibers meet each other [1].
Identifying the maturity of guava fruit by farmers is still done manually by doing direct visual observations on the fruit to be classified. There is a lack of direct visual observation which is influenced by human consistency in the identification process, so that in certain conditions it will occur inaccurately. By using computer technology it is possible to recognize objects in the
form of images taken using information technology, namely deep learning.
Deep learning is one of the fields of Machine learning. In recent years deep learning has shown extraordinary performance. This is largely influenced by stronger computational factors, large datasets and techniques for training deeper networks [2]. One method of deep learning is Convolutional Neural Network (CNN). CNN is a deep learning method that can be used to detect and recognize an object in an image.
Based on the background above, an application is developed to identify the limits of Guava Fruit using Deep Learning with the Convolutional Neural Network Method". This application is expected to provide information about the accurate classification of the level of guava fruit.
ISSN: 1992-8645 www.jatit.org E-ISSN: 1817-3195
5127 The implementation and results related to our research are also shown in section 4. The last section is conlusion and future work of our research.
2. THEORY
2.1 Guava Fruit
Guava (Psidium guava) or commonly called guava. Guava actually comes from Brazil and was distributed to Indonesia through Thailand. The fruit is round, green, has a lot of seeds, and lots of flesh is white or pink. The leaves are oval round and leaf fibers meet each other. Here are some types that are well known on the market [1]:
1) Jambu Getas Merah (Red Guava ‘Getas’). The
color of the flesh is green to yellow. The shape of the fruit is rather oval and tastes less sweet. The specialty of this type of guava is to always bear fruit at any time and not know the season
2) Australian Guava. The leaves are purplish red.
Most hobbies plant this type of guava as an ornamental plant. Although the fruit can be eaten and tastes sweet when cooked.
3) Taiwan Crystal Guava. Is a mutation from the
residue of Thailand, and entered Indonesia since 1991. This type is a type of guava that is almost seedless.
4) Jambu Pasar Minggu (Pasar Minggu Guava).
This type has two variants, namely white and red fruit flesh. Guava which has white fruit is better known as the white milk guava. The taste is sweet, the texture of the fruit is soft and the flesh is rather thick. Meanwhile, guava which has red fruit flesh has a less sweet and decaying taste, so it is less preferred.
5) Bangkok Guava. The shape is perfectly round,
large enough. Uniquely, this guava type is bigger when ripe.
6) Sukun Guava. This guava species does not
have seeds and is a superior variety. Fruit texture is rather hard, but crispy when chewed, yellowish white flesh. The aroma is fragrant, sweet and slightly sour.
2.2 Machine Learning
Machine learning is an algorithm that teaches computers to learn from experience. The machine learning algorithm uses computational methods to study information directly from data without specifying the previous calculation model. This
algorithm develops every amount of data that increases [3].
Machine learning uses a machine (computer and software) to get the meaning of a data. It can also mean giving the machine the ability to learn from the environment.
Apart from the learning algorithm there are four types of learning methods on Machine Learning, namely:
1) Supervised Learning. Learning data includes predetermined output.
2) Unsupervised Learning. Learning data does not include the specified output.
3) Semi-supervised Learning. Learning data includes several specified outputs.
4) Reinforcement Learning. Giving gifts from each set of actions taken.
There are 5 basic steps used to do Machine Learning tasks and this task is very important in preparing solutions for all types of problems in Machine Learning and Deep Learning:
1) Collect data. Formed from several files that contain a row of data that can be learned and after that separated between the input and output features.
2) Preparing data. Determining data quality and pre-process data so that the results are also good.
3) Train a model. This step involves selecting the right algorithm and data representation in the form of a model.
4) Evaluate the model. To test accuracy based on the test set section in the dataset.
5) Improve performance. This step involves choosing a hyper-parameter to increase efficiency and usually use cross-validation. 2.3 Deep Learning
ISSN: 1992-8645 www.jatit.org E-ISSN: 1817-3195
5128 The application of the concept of deep artificial neural networks (many layers) can be suspended on existing Machine Learning algorithms so that computers can now learn with large speed, accuracy, and scale. This principle continues to grow until Deep Learning is increasingly used in research and industry communities to help solve many big data problems such as Computer vision, Speech recognition, and Natural Language Processing. Feature Engineering is one of the main features of Deep Learning to extract useful patterns from data that will facilitate the model to differentiate classes. Feature Engineering is also the most important technique for achieving good results on prediction tasks. However, it is difficult to learn and master because different data sets and data types require different technical approaches.
Algorithms used in Feature Engineering can find general patterns that are important to differentiate between classes in Deep Learning, the CNN method or Convolutional Neural Network is very good in finding good features in the image to the next layer to form a non-linear hypothesis that can improve complexity of a model . Complex models will certainly require a long training time so that in the world of Deep Learning the use of GPU is very commonly used [4].
2.4 CNN
Convolutional Neural Network (CNN) is one of deep learning’s algorithms that is claimed to be the best model for solving problems in object recognition. CNN is the development of Multilayer Perceptron (MLP) which is designed to process two-dimensional data. CNN is included in the type of Deep Neural Network because of the high network depth and many applied to image data. In the case of image classification in research on virtual cortex on cat's visual sense, MLP is less suitable for use because it does not store spatial information from image data and considers each pixel to be an independent feature that results in unfavorable results.
[image:3.612.312.531.43.222.2]CNN was first developed by Kunihiki Fukushima under the name NeoCognitron. This concept was later developed by Yann LeChun for numerical recognition and handwriting. In 2012, Alex Krizhevsky successfully won the 2012 ImageNet Large Scale Visual Recognition Challenge competition with his CNN application. This is the moment of proof that the Deep Learning method with CNN method has proven to be successful in overcoming other Machine Learning methods such as SVM in the case of object classification in images [5-7].
Figure 1. Example of CNN with Many Layers [5-7]
In general, the layer type on CNN is divided into two, namely:
Feature extraction layer. Located at the beginning of the architecture is composed of several layers and each layer is composed of neurons connected to the local area (local region) of the previous layer. The first type layer is the convolutional layer and the second layer is the pooling layer. Each layer applies the activation function with its intermittent position between the first type and the second type. This layer accepts image input directly and processes it until it produces an output in the form of a vector to be processed in the next layer.
The classfication layer. Composed of several layers and each layer is composed of fully connected neurons with other layers. This layer accepts input from the output feature image extraction layer in the form of a vector then transformed like Multi Neural Networks with the addition of several hidden layers. The output is class accuracy for classification.
CNN is thus a method for transforming the original image layer per layer from the image pixel value into the class scoring value for classification, where each layer has a hyper-parameter and some do not have parameters (weight and bias on neurons).
On CNN there are four types of layers used, namely:
A. Convolutional Layer. The Convolution Layer
performs convolution operations at the output of the previous layer. Convolution operations are operations on two functions of real value arguments. This operation uses image input to produce the output function as a Feature Map. These inputs and outputs are two real-value arguments. Convolution operations in general can be written with the formula below:
ISSN: 1992-8645 www.jatit.org E-ISSN: 1817-3195
5129 The equation s (t) gives results in the form of a Feature Map as a single output with the first argument used is the input expressed as x and the second argument used is the kernel or filter which is stated as ω. Because the input used is an image that has two dimensions, it can be expressed as t as a pixel and replace it with the arguments i and j. Therefore, convolution operations with more than one dimension input can be written as follows:
𝑠 𝑖, 𝑗 𝐾 ∗ 𝐼 𝑖, 𝑗 ∑ ∑ 𝐼 𝑖 𝑚, 𝑗
𝑛 𝐾 𝑚, 𝑛 (2) The above equation is the basic calculation for convolution operations where the pixels of the image are expressed as i and j. The calculation is commutative and appears when K as a kernel can be reversed relative to I as input. Convolution operation can be seen as matrix multiplication between image input and kernel where the results can be calculated with dot products.
In addition, the output volume of each layer can be adjusted using hyperparameters. Hyperparameter is used to calculate how many activation neurons in one output are stated in the equation below:
(3)
[image:4.612.319.518.295.396.2]From the equation above, the spatial size of the output volume can be calculated by the hyperparameter used is the volume size (W), filter (F), Stride applied (S), and the number of zero padding used (P). Stride is the value used to shift filters through image input and Zero Padding is the value to place zeros around the image border. In image processing, convolution means applying a kernel (yellow box) to the image in all possible offsets as shown in Fig 2.
Figure 2. Convolutional Operation
The green box as a whole is the image that will be convoluted. The kernel moves from the upper left corner to the lower right. So that the convolution of the image can be seen in the picture on the right. The purpose of convolution on image data is to extract features from the input image.
B. Pooling Layer. Pooling Layer is a layer that uses
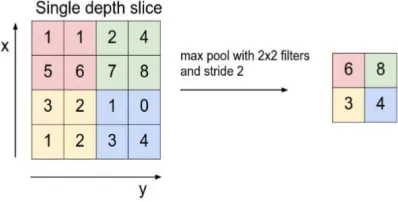
functions with Feature Map as input and processes it with various statistical operations based on the nearest pixel value. Pooling layer on the CNN model is usually inserted regularly after several convolution layers. The Pooling layer in the CNN model architecture that is inserted between the convolution layers can progressively reduce the size of the output volume in the Feature Map, so as to reduce the number of parameters used and calculations on the network, and to control Overfitting. In most CNNs, the pooling method used is max pooling. Max pooling divides the output of the convolution layer into several small grids and then takes the maximum value from each grid to compile a reduced image matrix as shown in Fig. 3.
Figure 3. Max Pooling Operation [5]
Grids that are red, green, yellow and blue are the grid groups whose maximum values will be selected. So that the results of the process can be seen in the grid collection on the right. The process ensures that the features obtained will be the same even though the image object experiences translation (shift). Using the CNN pooling layer aims to reduce the size of the image so that it can be easily replaced with a convolution layer with the same stride as the corresponding pooling layer. This form of pooling will reduce the Feature Map up to 75% of its original size.
C. Fully Connected Layer. Fully Connected Layer
[image:4.612.140.253.541.625.2]ISSN: 1992-8645 www.jatit.org E-ISSN: 1817-3195
5130 while the fully connected layer has neurons that are completely connected. However, the two layers still operate dot products, so the function is not so different.
D. Activation Function. In this paper the activation
functions used are ReLu (Rectified Linear Units) and Softmax Classifier. ReLu activation increases the non-linear nature of decision making functions and all networks without affecting the receptive fields of Convolutional Layer. ReLu is also widely used because it can train neural networks faster. Softmax activation for this layer is another form of Logistic Regression algorithm that can be used to classify more than two classes. The usual classification used by the Logistic Regression algorithm is the classification of binary classes. Softmax provides more intuitive results and has a better probabilistic interpretation than other classification algorithms. Softmax makes it possible to calculate the probability for all labels. From the existing label, a real value vector is taken and converts it to a vector with a value between zero and one which, if all are added, will be worth one.
2.5 LeNet
[image:5.612.92.301.589.667.2]LeNet Architecture was first introduced by LeChun et al. in their 1998 paper, the Gradient-Based Learning Applied to Document Recognition. These input are sized at 28×28, which correlates to the input size of LeNet. The LeNet architecture is simple and was originally created for digit classification [5]. The architecture can be seen in Fig. 4, with the inputs consisting of image guava fruit mature and guava fruit immature. The inputs are fed into the first convolution layer and max pooling layer, which is repeated once and finalised with two fully connected layers. The final number of outputs are 2 neurons, which are the activations generated for the two classes: mature and immature.
Figure. 4. LeNet Architecture [5]
2.6 Keras
Keras is a high-level neural network library written in python and able to run on TensorFlow, CNTK, or Theano. This library provides features
that are used with a focus on facilitating deeper development of deep learning.
2.7 Tensorflow
TensorFlow is a basic programming algorithm released by Google in 2015. TensorFlow for public consumption of the opensource community. TensorFlow is a set of algorithms that allow computers to quickly do "deep learning" with large data sets to perform tasks better than the human brain [8].
3. RELATED WORK
The research has related with the works of: first, Adrian Rosebrock 2017 [9], i.e. “Image Classification with Keras and deep learning” ; and second, R. Refianti et.al. 2018 [10], i.e. “Classification of Melanoma Skin Cancer Using Convolutional Neural Network”. Both researches are about general image classification, but our research is more specific for maturity identification Guava Fruit.
The novelty of this paper lies in data augmentation, before it is entered into CNN with LeNet architecture to train the network (see fig. 7). Data augmentation means to multiply the variation of images from the dataset by rotating the image, increasing or decreasing the image’s length and width, zooming in the image, and also flipping the image horizontally (see fig.6).
The contribution of this paper is to show that Deep Learning using CNN with LeNet could be used to indentify the Guava Fruit maturity more precisely.
4. RESEARCH METHODOLOGY
3.1 Data Collection
Data collection was carried out by taking 200 guava guava fruit images. 140 image data is used for training and 60 image data is used for the validation process. Image retrieval is carried out with the following conditions:
Guava fruit is placed on the floor.
Distance of objects with a mobile camera as far as 15 cm.
Don't use a mobile camera flash..
ISSN: 1992-8645 www.jatit.org E-ISSN: 1817-3195
5131 3.2 Data Acquisition
[image:6.612.316.530.57.265.2]Data acquisition is the first stage carried out in research for raw materials. The aim is to determine which will be the object of research. In this case, image retrieval is done using a Samsung Galaxy S5 mobile camera with a 16 MP camera resolution. The resulting image has a resolution of 5312 x 2988 pixels with the format * .jpg. Retrieval of image data using the original image without the process cutting(cropping).
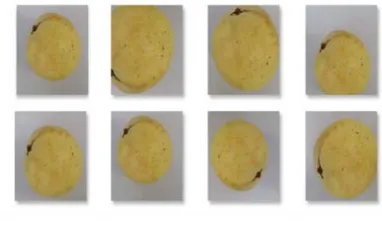
Figure 5. Image of Guava Fruit
3.3 Pre-Processing
Rescale all the images to 28 x 28 pixels for this deep learning network.
3.4 Data Augmentation
[image:6.612.104.272.221.326.2]Data augmentation is used to multiply the variation of images from the dataset by rotating the image, increasing or decreasing the image’s length and width, zooming in the image, and also flipping the image horizontally. This data augmentation can be seen in Fig. 6.
Figure 6. Data Augmentation of Guava Fruit Image
3.5 Training Data Process
Fig. 7 shows the process flow in conducting training on the dataset using CNN with LeNet architecture.
Figure 7. Training Data Process Flow
The training process starts by reading epoch number, learning rate, and batch size. Then the system read the address of the dataset. Then all the images from the dataset are resized into 28x28 pixel and the dataset augmentation will be generated. The system initializes LeNet architecture and start to train the network. After completing the training, the system will save the model and plot from the results of the training.
5. EXPERIMENT AND RESULT
The experiment was carried out by determining a different number of training data and epoch to get the best accuracy result. There were two parts of training data, the first one used 100 images and the second one used 140 images. Each of the training data section was trained with 10 epochs and 20 epochs. Then, all the model resulted from the training were tested against 60 images of test data and calculated the percentage of accuracy from the results of the testing using the following equation:
Percentage of Success= 𝑥 100% (4)
where
TP (True Positive) = True mature image FP (False Positive) = Wrong mature image TN (True Negative) = True immature image FN (False Negative) = Incorrect immature image
4.1 First Experiment
[image:6.612.99.290.466.582.2]ISSN: 1992-8645 www.jatit.org E-ISSN: 1817-3195
[image:7.612.92.517.160.735.2]5132
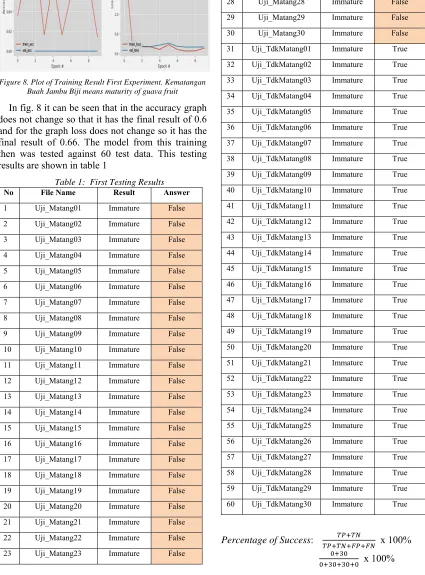
Figure 8. Plot of Training Result First Experiment. Kematangan Buah Jambu Biji means maturity of guava fruit
In fig. 8 it can be seen that in the accuracy graph does not change so that it has the final result of 0.6 and for the graph loss does not change so it has the final result of 0.66. The model from this training then was tested against 60 test data. This testing results are shown in table 1
Table 1: First Testing Results
No File Name Result Answer
1 Uji_Matang01 Immature False
2 Uji_Matang02 Immature False
3 Uji_Matang03 Immature False
4 Uji_Matang04 Immature False
5 Uji_Matang05 Immature False
6 Uji_Matang06 Immature False
7 Uji_Matang07 Immature False
8 Uji_Matang08 Immature False
9 Uji_Matang09 Immature False
10 Uji_Matang10 Immature False
11 Uji_Matang11 Immature False
12 Uji_Matang12 Immature False
13 Uji_Matang13 Immature False
14 Uji_Matang14 Immature False
15 Uji_Matang15 Immature False
16 Uji_Matang16 Immature False
17 Uji_Matang17 Immature False
18 Uji_Matang18 Immature False
19 Uji_Matang19 Immature False
20 Uji_Matang20 Immature False
21 Uji_Matang21 Immature False
22 Uji_Matang22 Immature False
23 Uji_Matang23 Immature False
24 Uji_Matang24 Immature False
25 Uji_Matang25 Immature False
26 Uji_Matang26 Immature False
27 Uji_Matang27 Immature False
28 Uji_Matang28 Immature False
29 Uji_Matang29 Immature False
30 Uji_Matang30 Immature False
31 Uji_TdkMatang01 Immature True
32 Uji_TdkMatang02 Immature True
33 Uji_TdkMatang03 Immature True
34 Uji_TdkMatang04 Immature True
35 Uji_TdkMatang05 Immature True
36 Uji_TdkMatang06 Immature True
37 Uji_TdkMatang07 Immature True
38 Uji_TdkMatang08 Immature True
39 Uji_TdkMatang09 Immature True
40 Uji_TdkMatang10 Immature True
41 Uji_TdkMatang11 Immature True
42 Uji_TdkMatang12 Immature True
43 Uji_TdkMatang13 Immature True
44 Uji_TdkMatang14 Immature True
45 Uji_TdkMatang15 Immature True
46 Uji_TdkMatang16 Immature True
47 Uji_TdkMatang17 Immature True
48 Uji_TdkMatang18 Immature True
49 Uji_TdkMatang19 Immature True
50 Uji_TdkMatang20 Immature True
51 Uji_TdkMatang21 Immature True
52 Uji_TdkMatang22 Immature True
53 Uji_TdkMatang23 Immature True
54 Uji_TdkMatang24 Immature True
55 Uji_TdkMatang25 Immature True
56 Uji_TdkMatang26 Immature True
57 Uji_TdkMatang27 Immature True
58 Uji_TdkMatang28 Immature True
59 Uji_TdkMatang29 Immature True
60 Uji_TdkMatang30 Immature True
Percentage of Success: x 100%
ISSN: 1992-8645 www.jatit.org E-ISSN: 1817-3195
5133
= x 100% = 50%
From 60 images of guava fruit tested using CNN with LeNet architecture, the results obtained were 30 suitable images and 30 inappropriate images, so that the accuracy of the success percentage is 50%. 4.2 Second Experiment
[image:8.612.116.527.56.742.2]The training process of this experiment was carried out using 20 epochs on 100 train data which consist of 50 images of guava fruit mature and 50 images of guava fruit immature. The plot result from this training can be seen in Fig. 9.
Figure 9. Plot of Training Result Second Experiment. Kematangan Buah Jambu Biji means maturity of guava fruit
In fig. 9 it can be seen that in the accuracy graph a rise and fall so that the final results obtained for 0.91 and for the graph loss experienced a decrease which obtained the final result of 0.46. The model from this training then was tested against 60 test data. This testing results are shown in table 2
Table 2: Second Testing Results
No File Name Result Answer
1 Uji_Matang01 Immature False
2 Uji_Matang02 Mature True
3 Uji_Matang03 Mature True
4 Uji_Matang04 Mature True
5 Uji_Matang05 Mature True
6 Uji_Matang06 Mature True
7 Uji_Matang07 Mature True
8 Uji_Matang08 Mature True
9 Uji_Matang09 Mature True
10 Uji_Matang10 Mature True
11 Uji_Matang11 Mature True
12 Uji_Matang12 Mature True
13 Uji_Matang13 Mature True
14 Uji_Matang14 Mature True
15 Uji_Matang15 Mature True
16 Uji_Matang16 Immature False
17 Uji_Matang17 Mature True
18 Uji_Matang18 Immature False
19 Uji_Matang19 Mature True
20 Uji_Matang20 Immature False
21 Uji_Matang21 Mature True
22 Uji_Matang22 Immature False
23 Uji_Matang23 Immature False
24 Uji_Matang24 Immature False
25 Uji_Matang25 Mature True
26 Uji_Matang26 Mature True
27 Uji_Matang27 Immature False
28 Uji_Matang28 Mature True
29 Uji_Matang29 Immature False
30 Uji_Matang30 Mature True
31 Uji_TdkMatang01 Immature True
32 Uji_TdkMatang02 Immature True
33 Uji_TdkMatang03 Immature True
34 Uji_TdkMatang04 Immature True
35 Uji_TdkMatang05 Immature True
36 Uji_TdkMatang06 Immature True
37 Uji_TdkMatang07 Immature True
38 Uji_TdkMatang08 Immature True
39 Uji_TdkMatang09 Immature True
40 Uji_TdkMatang10 Immature True
41 Uji_TdkMatang11 Immature True
42 Uji_TdkMatang12 Immature True
43 Uji_TdkMatang13 Immature True
44 Uji_TdkMatang14 Immature True
45 Uji_TdkMatang15 Immature True
46 Uji_TdkMatang16 Immature True
47 Uji_TdkMatang17 Immature True
48 Uji_TdkMatang18 Immature True
49 Uji_TdkMatang19 Immature True
50 Uji_TdkMatang20 Immature True
[image:8.612.92.299.259.430.2]ISSN: 1992-8645 www.jatit.org E-ISSN: 1817-3195
5134
52 Uji_TdkMatang22 Immature True
53 Uji_TdkMatang23 Immature True
54 Uji_TdkMatang24 Immature True
55 Uji_TdkMatang25 Immature True
56 Uji_TdkMatang26 Immature True
57 Uji_TdkMatang27 Immature True
58 Uji_TdkMatang28 Immature True
59 Uji_TdkMatang29 Immature True
60 Uji_TdkMatang30 Immature True
Percentage of Success: x 100%
x 100%
From 60 images of guava fruit tested using CNN with LeNet architecture, there were 51 suitable images and 9 inappropriate images, so that the accuracy of the success percentage is 85%.
4.3 Third Experiment
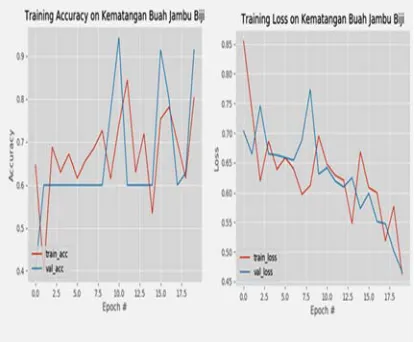
[image:9.612.302.520.86.736.2]The training process of this experiment was carried out using 10 epochs on 140 train data which consist of 70 images of guava fruit mature and 70 images of guava fruit immature. The plot result from this training can be seen in Fig. 10.
Figure 10. Plot of Training Result Third Experiment. Kematangan Buah Jambu Biji means maturity of guava fruit.
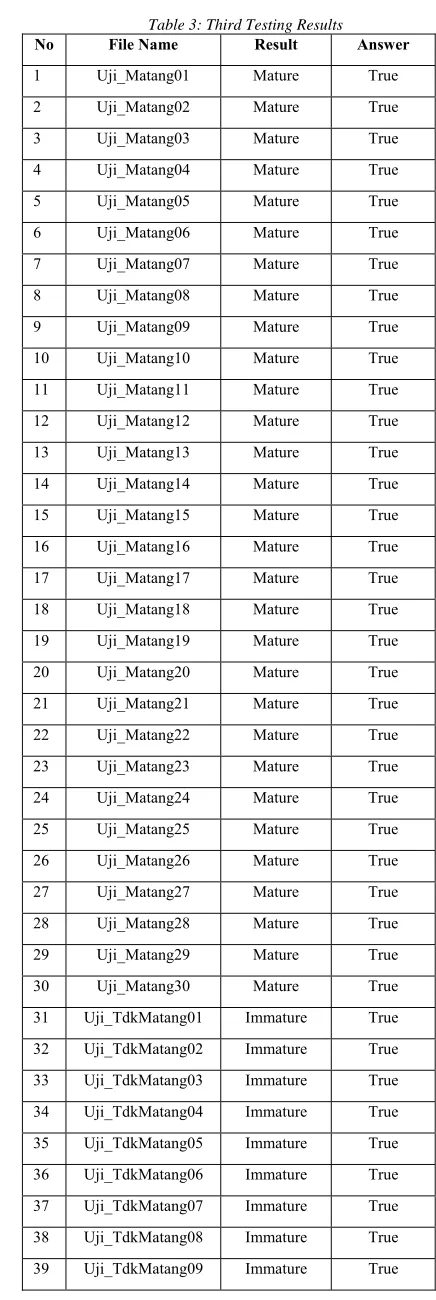
[image:9.612.91.294.432.587.2]In fig. 10 it can be seen that in the accuracy graph increases during the 6th to 10th epoch so that the final result obtained is 0.74 and for the loss graph experienced a decrease which obtained the final result of 0.54. The model from this training then was tested against 60 test data. This testing results are shown in table 3
Table 3: Third Testing Results
No File Name Result Answer
1 Uji_Matang01 Mature True
2 Uji_Matang02 Mature True
3 Uji_Matang03 Mature True
4 Uji_Matang04 Mature True
5 Uji_Matang05 Mature True
6 Uji_Matang06 Mature True
7 Uji_Matang07 Mature True
8 Uji_Matang08 Mature True
9 Uji_Matang09 Mature True
10 Uji_Matang10 Mature True
11 Uji_Matang11 Mature True
12 Uji_Matang12 Mature True
13 Uji_Matang13 Mature True
14 Uji_Matang14 Mature True
15 Uji_Matang15 Mature True
16 Uji_Matang16 Mature True
17 Uji_Matang17 Mature True
18 Uji_Matang18 Mature True
19 Uji_Matang19 Mature True
20 Uji_Matang20 Mature True
21 Uji_Matang21 Mature True
22 Uji_Matang22 Mature True
23 Uji_Matang23 Mature True
24 Uji_Matang24 Mature True
25 Uji_Matang25 Mature True
26 Uji_Matang26 Mature True
27 Uji_Matang27 Mature True
28 Uji_Matang28 Mature True
29 Uji_Matang29 Mature True
30 Uji_Matang30 Mature True
31 Uji_TdkMatang01 Immature True
32 Uji_TdkMatang02 Immature True
33 Uji_TdkMatang03 Immature True
34 Uji_TdkMatang04 Immature True
35 Uji_TdkMatang05 Immature True
36 Uji_TdkMatang06 Immature True
37 Uji_TdkMatang07 Immature True
38 Uji_TdkMatang08 Immature True
ISSN: 1992-8645 www.jatit.org E-ISSN: 1817-3195
5135
40 Uji_TdkMatang10 Immature True
41 Uji_TdkMatang11 Immature True
42 Uji_TdkMatang12 Immature True
43 Uji_TdkMatang13 Immature True
44 Uji_TdkMatang14 Immature True
45 Uji_TdkMatang15 Immature True
46 Uji_TdkMatang16 Mature False
47 Uji_TdkMatang17 Immature True
48 Uji_TdkMatang18 Immature True
49 Uji_TdkMatang19 Immature True
50 Uji_TdkMatang20 Immature True
51 Uji_TdkMatang21 Immature True
52 Uji_TdkMatang22 Immature True
53 Uji_TdkMatang23 Mature False
54 Uji_TdkMatang24 Mature False
55 Uji_TdkMatang25 Immature True
56 Uji_TdkMatang26 Immature True
57 Uji_TdkMatang27 Immature True
58 Uji_TdkMatang28 Immature True
59 Uji_TdkMatang29 Mature False
60 Uji_TdkMatang30 Mature False
Percentage of Success: x 100%
x 100%
= x 100% = 92%
From 60 images of guava fruit tested using CNN with the LeNet architecture, there were 55 suitable images and 5 inappropriate images, so that the accuracy of the success percentage is 92%.
A. Fourth Experiment
[image:10.612.307.529.65.257.2]The training process of this experiment was carried out using 20 epochs on 140 train data which consist of 70 images of guava fruit mature and 70 images of guava fruit immature. The plot result from this training can be seen in Fig. 11.
Figure 11. Plot of Training Result Fourth Experiment.
Kematangan Buah Jambu Biji means maturity of guava fruit
[image:10.612.313.519.371.743.2]In fig. 11 can be seen that in the accuracy graph has increased so that the final result obtained for 1 and for the graph loss experienced a decrease which obtained the final result of 0.0037. The model from this training then was tested against 60 test data. This testing result.
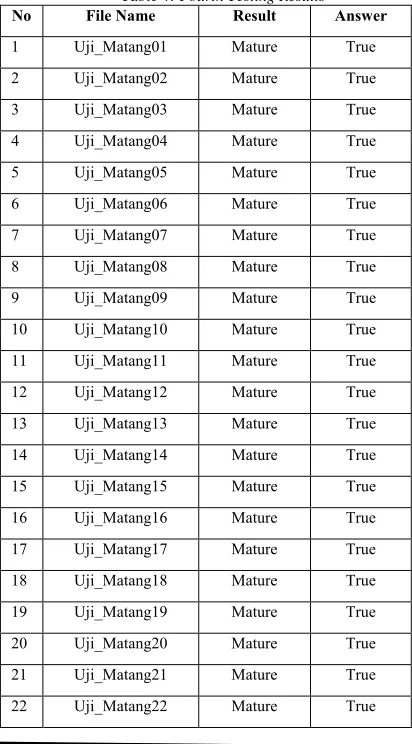
Table 4: Fourth Testing Results
No File Name Result Answer
1 Uji_Matang01 Mature True
2 Uji_Matang02 Mature True
3 Uji_Matang03 Mature True
4 Uji_Matang04 Mature True
5 Uji_Matang05 Mature True
6 Uji_Matang06 Mature True
7 Uji_Matang07 Mature True
8 Uji_Matang08 Mature True
9 Uji_Matang09 Mature True
10 Uji_Matang10 Mature True
11 Uji_Matang11 Mature True
12 Uji_Matang12 Mature True
13 Uji_Matang13 Mature True
14 Uji_Matang14 Mature True
15 Uji_Matang15 Mature True
16 Uji_Matang16 Mature True
17 Uji_Matang17 Mature True
18 Uji_Matang18 Mature True
19 Uji_Matang19 Mature True
20 Uji_Matang20 Mature True
21 Uji_Matang21 Mature True
ISSN: 1992-8645 www.jatit.org E-ISSN: 1817-3195
5136
23 Uji_Matang23 Mature True
24 Uji_Matang24 Mature True
25 Uji_Matang25 Mature True
26 Uji_Matang26 Mature True
27 Uji_Matang27 Mature True
28 Uji_Matang28 Mature True
29 Uji_Matang29 Mature True
30 Uji_Matang30 Mature True
31 Uji_TdkMatang01 Immature True
32 Uji_TdkMatang02 Immature True
33 Uji_TdkMatang03 Immature True
34 Uji_TdkMatang04 Immature True
35 Uji_TdkMatang05 Immature True
36 Uji_TdkMatang06 Immature True
37 Uji_TdkMatang07 Immature True
38 Uji_TdkMatang08 Immature True
39 Uji_TdkMatang09 Immature True
40 Uji_TdkMatang10 Immature True
41 Uji_TdkMatang11 Immature True
42 Uji_TdkMatang12 Immature True
43 Uji_TdkMatang13 Immature True
44 Uji_TdkMatang14 Immature True
45 Uji_TdkMatang15 Immature True
46 Uji_TdkMatang16 Immature True
47 Uji_TdkMatang17 Immature True
48 Uji_TdkMatang18 Immature True
49 Uji_TdkMatang19 Immature True
50 Uji_TdkMatang20 Immature True
51 Uji_TdkMatang21 Immature True
52 Uji_TdkMatang22 Immature True
53 Uji_TdkMatang23 Immature True
54 Uji_TdkMatang24 Immature True
55 Uji_TdkMatang25 Immature True
56 Uji_TdkMatang26 Immature True
57 Uji_TdkMatang27 Immature True
58 Uji_TdkMatang28 Immature True
59 Uji_TdkMatang29 Immature True
60 Uji_TdkMatang30 Immature True
Percentage of Success: x 100%
x 100%
= x 100% = 100%
From 60 images of guava fruit tested using CNN with LeNet architecture, the results obtained 60 images that are suitable and 0 images that are not suitable, so that the accuracy of the success percentage is 100%.
B. Summary of Testing Results
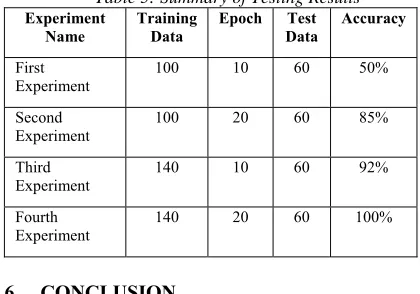
[image:11.612.311.521.266.413.2]From the results of the tests that have been carried out, a summary of the test results is shown in table 5.
Table 5: Summary of Testing Results
Experiment Name
Training Data
Epoch Test
Data
Accuracy
First Experiment
100 10 60 50%
Second Experiment
100 20 60 85%
Third
Experiment 140 10 60 92%
Fourth Experiment
140 20 60 100%
6. CONCLUSION
The research is success to identify the maturity of guava fruit using the Convolutional Neural Network (CNN) method with LeNet architecture.
The test results carried out using 60 test data for different training data and different epoch numbers, are obtained accuracies as following: 50% accuracy for 100 training data and 10 epochs, a 85% accuracy for 100 training data and 20 epochs, 92 % accuracy for 140 training data and 10 epochs, and the last percentage is 100% accuracy for 140 training data and 20 epochs. This is due to the factors that influence the testing of guava fruit images including the amount of training data and the number of epoch used in training. The more data that is trained, the better the test results will be produced. And 20 epochs is an epoch that produces the best accuracy.
REFERENCES
[1] Rahmat P., 21 Jenis Tabulampot Populer,
Jakarta: Agro Media, 2010
ISSN: 1992-8645 www.jatit.org E-ISSN: 1817-3195
5137 [3] Paluszek, Michael, and Stephanie Thomas,
MATLAB Machine Learning. New Jersey:
Apress, 2017
[4] Danukusumo, Kefin Pudi, Implementasi Deep Learning Menggunakan Convolutional Neural Network Untuk Klasifikasi Citra Candi
Berbasis GPU. Yogyakarta: Fakultas
Teknologi Industri Universitas Atma Jaya, 2017
[5] Y. LeCun, B. Boser, J.S. Denker, R.E. Howard, W. Habbard, L.D. Jackel and D. Henderson, “Handwritten digit recognition with a back-propagation network”, in Advances
in neural information processing systems 2, pp.
396-404, Morgan Kaufmann Publishers Inc. San Francisco, CA, USA, 1990
[6] Chen-Y. Lee, P. W. Gallagher, and Z. Tu, “Generalizing Pooling Functions in Convolutional Neural Networks”, 2015, https://arxiv.org/abs/1509.08985.
[7] Y. LeCun, Y., Y. Bengio, dan G. Hinton, 2015. "Deep Learning", Nature, Vol 521, pp. 436–
444, 2015, doi:10.1038/nature14539
[8] Thomas L. Friedman, Thank You For Being Late, Jakarta: Gramedia Pustaka Utama, 2018.
[9] Adrian Rosebrock, [Online] “Image Classification with Keras and Deep Learning.”
Available: https://www.
pyimagesearch.com/2017/12/11/ image-classification-with-keras-and-deep-learning/., 2017
[10]Rina Refianti, Achmad Benny Mutiara, and Rachmadinna Poetri Priyandini, “Classification
of Melanoma Skin Cancer Using
Convolutional Neural Network,” International Journal of Advanced Computer Science and
![Figure 1. Example of CNN with Many Layers [5-7]](https://thumb-us.123doks.com/thumbv2/123dok_us/8898306.953920/3.612.312.531.43.222/figure-example-cnn-layers.webp)
![Figure. 4. LeNet Architecture [5]](https://thumb-us.123doks.com/thumbv2/123dok_us/8898306.953920/5.612.92.301.589.667/figure-lenet-architecture.webp)