RESEARCH ARTICLE STEM CELLS AND REGENERATION
Stochastic NANOG fluctuations allow mouse embryonic stem
cells to explore pluripotency
Elsa Abranches1,2,*, Ana M. V. Guedes1,2, Martin Moravec3, Hedia Maamar4, Petr Svoboda3, Arjun Raj4and Domingos Henrique1,2,*
ABSTRACT
Heterogeneous expression of the transcription factor NANOG has been linked to the existence of various functional states in pluripotent stem cells. This heterogeneity seems to arise from fluctuations of Nanogexpression in individual cells, but a thorough characterization of these fluctuations and their impact on the pluripotent state is still lacking. Here, we have used a novel fluorescent reporter to investigate the temporal dynamics of NANOG expression in mouse embryonic stem cells (mESCs), and to dissect the lineage potential of mESCs at different NANOG states. Our results show that stochastic NANOG fluctuations are widespread in mESCs, with essentially all expressing cells showing fluctuations in NANOG levels, even when cultured in ground-state conditions (2i media). We further show that fluctuations have similar kinetics when mESCs are cultured in standard conditions (serum plus leukemia inhibitory factor) or ground-state conditions, implying that NANOG fluctuations are inherent to the pluripotent state. We have then compared the developmental potential of low-NANOG and high-NANOG mESCs, grown in different conditions, and confirm that mESCs are more susceptible to enter differentiation at the low-NANOG state. Further analysis by gene expression profiling reveals that low-NANOG cells have marked expression of lineage-affiliated genes, with variable profiles according to the signalling environment. By contrast, high-NANOG cells show a more stable expression profile in different environments, with minimal expression of lineage markers. Altogether, our data support a model in which stochastic NANOG fluctuations provide opportunities for mESCs to explore multiple lineage options, modulating their probability to change functional state.
KEY WORDS: Gene expression heterogeneity, Pluripotency, Lineage priming,Nanog, Stem cells
INTRODUCTION
Pluripotent stem cells manifest the unique capacity to commit to any of the lineages that generate the vast diversity of cell types in the body. This capacity relies on a gene regulatory network that must allow access to multiple lineage differentiation programmes, while at the same time ensuring that the pluripotent state is maintained.
The transcription factors (TFs) OCT4 (also known as OCT3/4 or POU5F1), SOX2 and NANOG have been shown to form the core of such network, coordinating the activity of a plethora of other genes that function together to implement the pluripotent state (Young, 2011). However, although NANOG is essential to reach this state in cells of the inner-cell mass of the mouse embryo, pluripotency can be maintained in the absence of NANOG, for instance in mouse embryonic stem cells (mESCs) in which bothNanogalleles have been inactivated (Chambers et al., 2007). This finding suggests that the pluripotency network can operate efficiently with variable amounts of NANOG, also indicated by the consistent observation that mESCs express heterogeneous levels of this protein, as revealed by immunodetection (Singh et al., 2007; Toyooka et al., 2008). The use of fluorescent reporters to monitor NANOG expression in mESCs corroborates the existence of such heterogeneity (Chambers et al., 2007; Miyanari and Torres-Padilla, 2012; Abranches et al., 2013; Filipczyk et al., 2013), and reveals in addition that isolated subpopulations of mESCs with high or low reporter activity re-establish a heterogeneous distribution, when cultured for several days (Chambers et al., 2007; Kalmar et al., 2009; Abranches et al., 2013). This implies that NANOG levels dynamically fluctuate in individual mESCs; however, whether these fluctuations have a functional impact on the pluripotent state is still an open question. The observation that Nanog−/− mESCs have an increased tendency to spontaneously differentiate (Chambers et al., 2007) led to the hypothesis that the‘low-NANOG’state is permissive for differentiation, whereas ‘high-NANOG’ mESCs would be in a pristine state of pluripotency, unresponsive to differentiation cues. This permissiveness of‘low-NANOG’mESCs to enter differentiation has been associated with the phenomenon of ‘lineage priming’, during which pluripotent cells display sporadic and reversible expression of lineage-affiliated genes, reflecting their increased predisposition to exit the pluripotent state. Thus, besides being a
‘maker’of pluripotency, NANOG might be also a‘marker’of the mESC differentiation potential. However, little is known on how Nanog and the pluripotency gene regulatory network operate in mESCs to ensure proper access to lineage differentiation programmes. It is therefore important to understand how NANOG heterogenous expression arises in mESCs, and what functional implications this heterogeneity might have for pluripotency and lineage commitment.
In the early mouse embryo [embryonic day (E) 3.5], fluctuations of Nanog expression seem to occur stochastically (Dietrich and Hiiragi, 2008; Ohnishi et al., 2014), and it has been proposed that mESCs in culture do also switch from oneNanogexpression state to the other in a stochastic manner, in a process driven by transcriptional noise (Kalmar et al., 2009). This hypothesis led to the development of various mathematical models that incorporate a contribution of stochastic mechanisms in gene expression (Chickarmane et al., 2006; Guantes and Poyatos, 2008; Macarthur
Received 10 February 2014; Accepted 13 May 2014
1
Instituto de Medicina Molecular and Instituto de Histologia e Biologia do Desenvolvimento, Faculdade de Medicina da Universidade de Lisboa, Avenida Prof. Egas Moniz, Lisboa 1649-028, Portugal.2Champalimaud Neuroscience Programme, Champalimaud Centre for the Unknown, Avenida Brasilia–Doca de Pedrouços, Lisboa 1400-038, Portugal.3Institute of Molecular Genetics, Academy of Sciences of the Czech Republic, Videnska 1083, 142 20 Prague 4, Czech Republic.4Department of Bioengineering, University of Pennsylvania, 210 South 33rd Street, Philadelphia, PA 19104, USA.
*Authors for correspondence (elsa.abranches@gmail.com; henrique@fm.ul.pt)
DEVEL
O
et al., 2008; Kalmar et al., 2009; Glauche et al., 2010), aimed at explaining how Nanog fluctuations might emerge in mESCs. However, quantitative data to analyse the dynamic Nanog expression and support such models are still scarce in the literature (Kalmar et al., 2009; Miyanari and Torres-Padilla, 2012; Trott et al., 2012; Munoz Descalzo et al., 2013). Other mechanisms to justify the observed NANOG heterogeneity in mESCs have been proposed, coinciding in the view that fluctuations are controlled at the transcriptional level and emerge from particular configurations of the pluripotency gene regulatory network, involving various types of feedback loops (Niwa et al., 2009; Lanner and Rossant, 2010; MacArthur et al., 2012). For instance, transcriptional auto-repression has been proposed to generate fluctuations in Nanog expression (Navarro et al., 2012), whereas other authors propose that these fluctuations result from complex network interactions involving feedback and crosstalk between various signalling pathways and pluripotency TFs (Adachi and Niwa, 2013; Posfai et al., 2014). An intriguing mechanism based on dynamic allele-switching ofNanogin mESCs has also been proposed to underlie its fluctuations (Miyanari and Torres-Padilla, 2012), although recent evidence does not support a contribution of this mechanism to the observed heterogeneity of NANOG expression in mESCs (Faddah et al., 2013; Filipczyk et al., 2013).
Contrary to mESCs maintained in standard culture conditions (serum plus leukemia inhibitory factor/LIF), it has been argued that mESCs cultured in fully defined media containing inhibitors of the fibroblast growth factor (FGF)/mitogen-activated protein kinase pathway and glycogen synthase kinase 3 (GSK3) (2i media; Ying et al., 2008; Nichols et al., 2009) reach a stable and homogeneous state of NANOG expression, unperturbed by intrinsic noise (Silva et al., 2009). This has been defined as a ground state of pluripotency (Silva and Smith, 2008; Nichols and Smith, 2009), in which gene expression heterogeneities would be abolished, and all mESCs would contain homogenously high levels of NANOG expression (Wray et al., 2010). However, we have previously reported that mESCs grown in 2i conditions do also show heterogeneity in NANOG expression, and contain a minor subpopulation of cells with low NANOG levels (using immunodetection or a Nanog-fluorescent reporter), leaving open the hypothesis that NANOG expression also fluctuates in ground-state mESCs. In this paper, we have analysed by real-time confocal microscopy the dynamic expression of a Nanog:VNP reporter in mESCs cultured in 2i/LIF and standard serum/LIF conditions. Our results show that NANOG fluctuations occur similarly in mESCs grown in either condition, with the main difference being the higher percentage of NANOG fluctuating cells that are present in 2i/LIF media. We have also analysed the functional implications of these fluctuations and characterized in detail the potential of mESCs with low- and high-NANOG levels, using clonal assays and molecular profiling. Our results confirm that mESCs with low NANOG levels have less self-renewal capacity and higher tendency to differentiate than cells with high NANOG, revealing in addition different expression profiles of lineage-affiliated genes. The observed correlation between the degree of lineage-specific gene expression and propensity to differentiate support a model in which low NANOG defines a primed state that occurs in transition towards differentiation. Fluctuations in NANOG expression are therefore important for mESCs to manifest their pluripotency, creating a window of opportunity during which mESCs can respond to the signalling environment and explore multiple lineage differentiation programmes before definitive commitment.
RESULTS
NANOG fluctuations are a cell-autonomous property of pluripotent mESCs
We have previously reported (Abranches et al., 2013) the generation of a novel mESC line (‘Nd’) derived from the E14tg2a line, containing a fluorescent reporter to monitorNanogexpression. The Nd reporter line uses a short-lived fluorescent protein (VenusNuclearPEST-VNP) with similar decay time to NANOG, and shows a good correlation between the temporal expression of both proteins. In addition, the two endogenousNanogalleles are intact and functional in Nd mESCs, as the reporter construct is inserted into an additional copy ofNanog included in a bacterial artificial chromosome (BAC) transgene. These two unique features allow the use of the VNP reporter in Nd cells as an adequate proxy for NANOG dynamic expression in mESCs, in contrast to other reporter cell lines that rely on the use of stable eGFP proteins (Chambers et al., 2007; Faddah et al., 2013). We therefore employed the Nd reporter to monitor temporal variations in NANOG expression, by time-lapse confocal imaging of VNP fluorescence, in order to investigate whether the observed NANOG heterogeneity results from intrinsic fluctuations in its expression, in individual mESCs. Furthermore, this analysis was done both in standard culture media (serum/LIF) and in 2i/LIF media, to evaluate whether fluctuations occur similarly in these conditions.
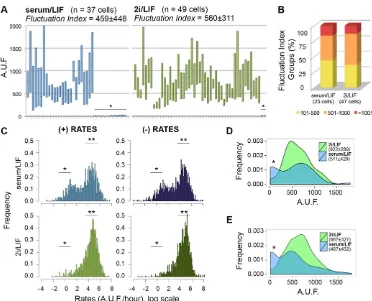
VNP fluorescence was monitored in individual mESCs at 15 min intervals (supplementary material Movies 1 and 2), and we focused our analysis on the variations that occur during the interphase of a single cell cycle (around 10-16 h, supplementary material Fig. S1A). In total, 37 mESCs grown in serum/LIF and 49 in 2i/LIF were tracked. The results (Fig. 1A) show that fluctuations in Nanog:VNP expression can be detected in mESCs grown in both conditions, with the major difference being the number of cells that do not display expression of Nanog:VNP at any time point, which is higher in serum/LIF (12/37 cells) than in 2i/LIF (2/49 cells). In either media, all other cells show marked variations in Nanog:VNP over time.
To compare the dynamic range of these fluctuations in the two media, we calculated a ‘fluctuation index’ (FIn) for each cell, defined as the amplitude between the maximum and minimum fluorescence levels detected along an interphase. When the distribution of FIn values is plotted for cells showing fluctuations (Fig. 1B), no significant differences can be detected between mESCs cultured in serum/LIF and 2i/LIF, implying that the amplitude of Nanog:VNP fluctuations is independent of the signalling environment. To evaluate if these fluctuations also occur with similar pace in the two media, we calculated the rates of fluorescence increase and decrease ( per hour) for all cells, and plotted these values in a histogram (Fig. 1C). The graph shows a peak around zero for mESCs in serum/LIF (both for negative and positive rates), denoting those cells that show no Nanog:VNP fluctuations. A second peak contains fluctuating mESCs, and no significant difference in the positive or negative rates of Nanog: VNP variation can be detected when these cells are cultured in serum/LIF or 2i/LIF, indicating that fluctuation rates of Nanog:VNP in mESCs are also independent of culture conditions.
Analysis of fluctuation paces (Table 1) reveals in addition that Nanog:VNP levels can change very fast in mESCs, either increasing or decreasing. As a result, mESCs can transit between high and low Nanog:VNP states in periods as short as 4 h, implying that NANOG fluctuations can occur in the range of hours and not days, as has been previously suggested (Macarthur et al., 2008; Kalmar et al., 2009). Although statistically significant differences are not observed between serum/LIF and 2i/LIF conditions, consistently higher rates of Nanog:VNP variation are observed in 2i/LIF (Table 1).
DEVEL
O
We have also plotted Nanog:VNP levels when mESCs enter mitosis (Fig. 1D), aiming to establish possible correlations with the cell cycle. Our findings reveal that mESCs can initiate mitosis with a large range of Nanog:VNP levels, with a similar distribution to that observed for all measured time points along the cell cycle (compare histograms in Fig. 1D and 1E), thereby indicating that entry into mitosis is not correlated with NANOG expression. The main difference between mESCs grown in serum/LIF or 2i/LIF conditions is the higher number of mESCs that enter mitosis
without Nanog:VNP expression in serum/LIF (asterisk in Fig. 1D), reflecting the higher percentage of cells that do not express NANOG in these conditions.
Finally, we have analysed Nanog:VNP levels in sister cells along a single cell cycle, starting when they emerge from mitosis, both in serum/LIF and 2i/LIF conditions (supplementary material Fig. S4). Using the empirical cumulative distribution function and Kolmogorov–Smirnov (K–S) test, our analysis indicates that sister cells considerably diverge in their Nanog:VNP levels after mitosis, with only two pairs (out of 16) showing significant similarity in their Nanog:VNP profiles along the whole cell cycle. These data support the hypothesis that NANOG fluctuations in mESCs are regulated in a stochastic manner (Kalmar et al., 2009; MacArthur and Lemischka, 2013). Altogether, our analysis of Nanog:VNP dynamic expression indicates that NANOG fluctuations are a cell-autonomous property of pluripotent mESCs that occur with very similar dynamics in different signalling environments, underlying the observed heterogeneity in NANOG expression in mESCs.
Nanogtranscription is a noisy process in mESCs
[image:3.612.120.492.53.354.2]We next asked whether the heterogeneous NANOG expression is accompanied by similar variability inNanogmRNA expression, at Fig. 1. Time-lapse imaging of Nd cells grown in serum/LIF or 2i/LIF conditions.(A) Kinetics of Nanog:VNP expression in 37 mESCs grown in serum/LIF and 49 mESCs grown in 2i/LIF. For each individual cell, the range of fluorescence values detected along an interphase is depicted (from minimum to maximum values), as well as the mean value (line). Plots of individual cells throughout time are shown in supplementary material Figs S2 and S3. The average values of the FIn for all mESCs in each condition is calculated, and is not significantly different between serum/LIF and 2i/LIF. Non-fluctuating cells are marked with an asterisk. Fluorescence values are depicted as arbitrary units of fluorescence (A.U.F.). (B) Bar charts representing fluctuating mESCs (25 cells in serum/LIF and 47 cells in 2i/LIF) grouped according to FIn values. (C) Global analysis of the kinetics of Nanog:VNP gain (+) and decay (−) rates in all tracked mESCs. Rates around zero reflect the periods in which fluorescence levels do not vary (*). In 2i/LIF conditions, the majority of the mESCs are continuously fluctuating and only rarely slow down to zero rates. Fast variations in fluorescence are detected in both conditions, with peaks (**) at similar paces. Global mean, maximum, minimum and median values are shown in Table 1. (D) Histograms for Nanog:VNP fluorescence levels at division time. The frequency of cells that enter division with low or no Nanog: VNP in serum/LIF (*) is higher in serum/LIF and reflects the higher percentage of non-expressing cells in these conditions. Average values for Nanog:VNP fluorescence at the time of mitosis tend to be higher in 2i/LIF conditions, although not statistically different. (E) Histograms for Nanog:VNP fluorescence levels at all time points, for all mESCs in serum/LIF and 2i/LIF.
Table 1. Kinetics of Nanog:VNP gain (+) and decay (−) in all fluctuating mESCs
(+) Rates (−) Rates
Global rates
(fluctuating cells) Serum/LIF 2i/LIF Serum/LIF 2i/LIF
Mean 138±83 144±60 −144±70 −166±109 Max 523±430 543±318 −716±696 −779±792 Minimum 7.6±7.7 7.9±7.5 −5.5±6.8 −9.4±12.9 Median 103±60 111±49 −101±46 −112±46
Mean, maximum, minimum and median values (in A.U.F./h) for all analysed
cells in each condition are depicted.
DEVEL
O
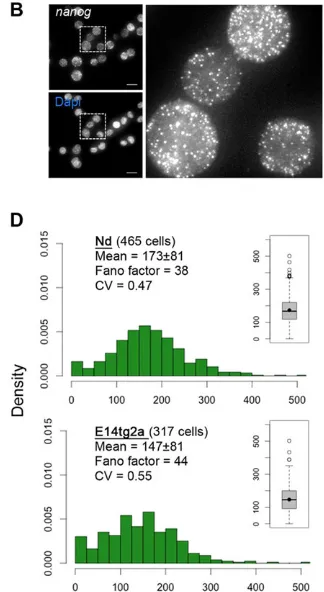
[image:3.612.47.301.638.719.2]the single-cell level. To quantify this variability, we have used single-molecule fluorescent in situ hybridization (smFISH), a modified mRNA FISH method that allows a quantitative measurement of the number of mRNA molecules per cell (Raj et al., 2008). This method was used to detectNanogmRNA in both Nd and E14tg2a mESCs, cultured in serum/LIF or 2i/LIF media (Fig. 2). A striking variability in the number of Nanog mRNA molecules per individual mESC is detected in both culture conditions, ranging from 0 to 500 mRNAs/cell, with no marked differences in the distributions between the original E14tg2a line and the Nd reporter line (Fig. 2). When these mESCs are cultured in serum/LIF, we observe a substantial number of cells with none or very few Nanogtranscripts (0-25), resulting in a non-Poissonian mRNA distribution (Fano factor≫1) that shows a long exponential tail (Fig. 2C). In 2i/LIF conditions, the mean number of Nanog mRNA molecules per cell is higher, but there is still a significant proportion of cells with a very low number (0-25) ofNanogmRNA transcripts (3.9-7.6% in 2i/LIF versus 29-34% in serum/LIF, for Nd and E14tg2a mESCS, respectively) (Fig. 2D). These observations, when associated with the decay time of Nanog mRNA (∼4 h) (Abranches et al., 2013), imply that each mESC spends a considerable fraction of time with Nanog in a transcriptionally inactive state, revealing that its transcription in mESCs is pulsatile and occurs in bursts. This is supported by recently published evidence (Hansen and van Oudenaarden, 2013) of transcriptional bursts inNanogmRNA production in mESCs, using intronic probes to detect nascent transcripts. In these experiments, the authors show that a small percentage (around 5%) of mESCs in 2i/LIF do not showNanogtranscriptional activity, a percentage that is higher in serum/LIF conditions (around 25%). These results are in agreement with the percentage of E14tg2a and Nd mESCs in which we detect very fewNanogtranscripts, using the same culture conditions, and
support the conclusion thatNanogtranscription is a noisy process in mESCs, even in‘ground-state’conditions, in which transcriptional bursting also results in stochasticNanogmRNA production. Thus, the observed heterogeneity in NANOG expression in pluripotent mESCs is associated with an underlying heterogeneity at the level of NanogmRNA transcription.
NANOG fluctuations create‘primed’states without lineage bias
Fluctuations in NANOG levels have been suggested to create the opportunity for mESCs to explore their multi-lineage differentiation potential in response to environmental signals (Silva and Smith, 2008), with the low-NANOG state correlating with a higher propensity to enter differentiation (Chambers et al., 2007; Kalmar et al., 2009). Low-NANOG mESCs have been proposed to be in a
‘primed’ state associated with a particular configuration of the pluripotency network, in which low-level transcription of lineage-affiliated genes is allowed, anticipating the transition into differentiation. Although there are various reports supporting this hypothesis, a detailed evaluation of the NANOG states that result from the observed fluctuations in mESCs has never been described. We therefore used the Nd reporter to assess the differentiation potential of the low- and high-NANOG states, in both serum/LIF and 2i/LIF media, and complemented this analysis with a detailed molecular characterization of these states in serum/LIF, 2i/LIF and BMP4/LIF media.
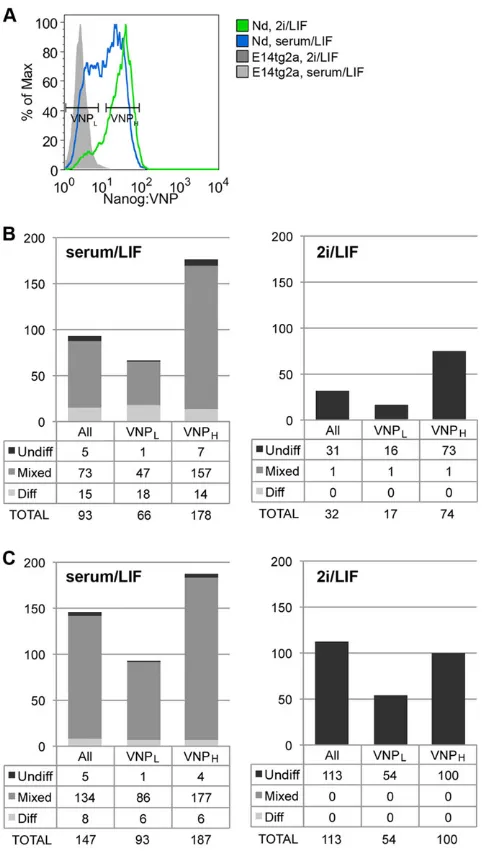
[image:4.612.226.388.427.723.2]Clonogenic assays were used to evaluate the potential of Nd mESCs according to their levels of Nanog:VNP expression. Cells with low (VNPL) and high (VNPH) levels of Nanog:VNP were sorted by fluorescence-activated cell sorting (FACS) (Fig. 3A) and plated at clonal density (60 cells/cm2) in either serum/LIF or 2i/LIF, followed by culture for 6 days, after which colonies were stained for
Fig. 2.Nanogheterogeneity at the mRNA level, in different culture conditions (serum/LIF and 2i/LIF).(A) Representative field from Nd mESCs grown in serum/LIF, showing individual mRNA
‘spots’in different cells. Quantifications are depicted in C. (B) Same as A for Nd cells grown in 2i/LIF medium, with quantifications depicted in D. (C) Histograms showing the distribution ofNanog
mRNA molecules per cell, for Nd and E14tg2a mESCs. The number of analysed cells in each condition is shown in brackets. Population mean, Fano factor (defined as the ratio of the variance to the mean) (Raj and van Oudenaarden, 2009) and coefficient of variation (CV, defined as the ratio of the standard deviation to the mean) are also shown for each cell population. For both conditions, the calculated Fano factor and CV values are similar between Nd and E14tg2a mESC lines. The Fano factor allows an estimation of noise strength and is much higher than predicted for a normal Poissonian distribution (equal to 1). Insets show respective boxplots, with median values depicted as solid black lines within the box, and mean values as full black circles. The edges of the box indicate the 25th and 75th percentiles and the whiskers indicate the range of non-outlier data points. Outliers are plotted individually (open circles). (D) Same as C for mESCs grown in 2i/LIF medium. Scale bars: 10 µm.
DEVEL
O
alkaline phosphatase (AP) and counted. Our results reveal that VNPL mESCs consistently show less clonogenic capacity than VNPH cells, independently of the culture media (Fig. 3B,C). In addition, replating of any subpopulation in 2i/LIF conditions generates almost only pure mESC colonies, confirming the selectivity of 2i/LIF media for ground-state mESCs. These results
add strong evidence to the hypothesis that fluctuations in NANOG expression produce functionally heterogeneous subsets of mESCs, with low-NANOG mESCs being more susceptible to enter differentiation, whereas mESC with high NANOG expression are in a more pristine pluripotent state.
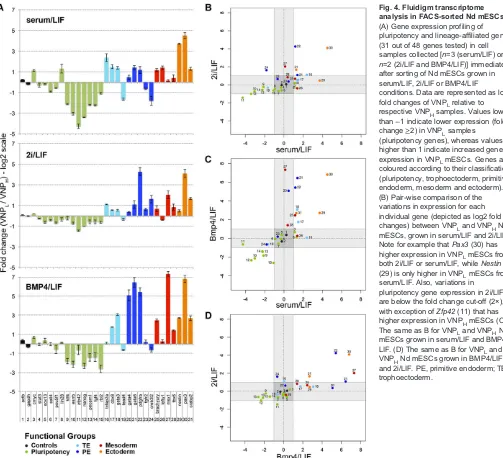
At the molecular level, recent work (MacArthur et al., 2012) showed that transientNanogknockdown (for 36 h) in mESCs leads to increased expression of several lineage-affiliated genes, providing further support for the current hypothesis that the low-NANOG state is permissive for lineage priming. To explore further this hypothesis, we took advantage of the Nd reporter line and generated a comprehensive gene expression profiling of FACS-purified subsets of mESCs with either VNPL or VNPH levels, employing a microfluidic qPCR approach (Fluidigm BioMark system). Purified subpopulations were collected from mESCs grown in three different conditions [serum/LIF, 2i/LIF and BMP4/ LIF (Ying et al., 2003)], in which distinct proportions of low- and high-Nanog:VNP-expressing cells are present (Fig. 3A, supplementary material Fig. S6A). In addition, mESCs initially grown in serum/LIF were differentiated for 48 h in serum only (no LIF), and were analysed as a ‘differentiation control’ (‘Diff’). A panel of 48 genes was profiled, including diagnostic markers for pluripotency and for lineage commitment.
The results (Fig. 4) confirm that VNPL mESCs have increased expression of several lineage-affiliated genes, in all culture conditions, when compared with VNPHmESCs. By contrast, pluripotency genes show lower variations in expression between VNPL and VNPH mESCs, with the lowest differences being observed in 2i/LIF conditions (Fig. 4A). We note that the pluripotency genes showing higher variations in VNPL cells (Klf4, Esrrb, Zfp42) are those known to be heterogeneously expressed in mESCs. Their expression is thus likely to correlate stronger with Nanog fluctuations. However, these variations are expected to have little impact on the overall activity of the pluripotency network (MacArthur et al., 2012), and are not expected to affect the pluripotent status of VNPL and VNPHmESCs.
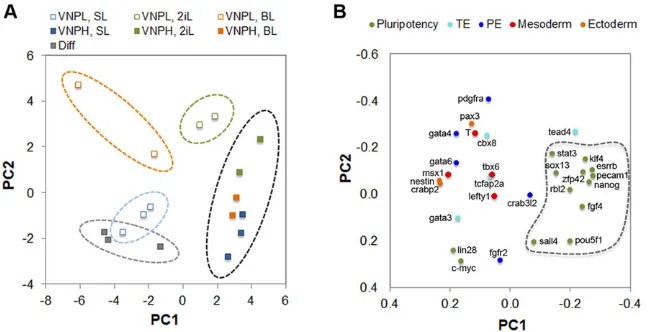
[image:5.612.54.295.55.481.2]By comparing the changes in expression of all lineage-affiliated genes between the VNPL and VNPH stages, in the three culture conditions (Fig. 4B-D), marked variations in the expression of particular genes can be observed (for instance,Pax3,Pdgfra,Gata6 and Msx1), but a coherent pattern in lineage priming cannot be detected. In fact, the various lineage-specific genes show uncorrelated variations in all three culture conditions, making it difficult to establish whether priming for particular lineages is occurring in different culture media. We therefore applied principal component analysis (PCA) to perform a global and unbiased evaluation of the expression profiling data for each subpopulation, independently of single-gene incoherent variations and of the correctness of selected lineage markers (Fig. 5). This global analysis reveals that subpopulations of mESCs with high Nanog:VNP cluster together in the multidimensional transcript profile space, independently of culture conditions, indicating that they are more similar at the molecular level than the corresponding VNPL subpopulations (Fig. 5A). These, by contrast, occupy unique profile spaces, with VNPL subpopulations from each culture condition showing more unrelated expression profiles between them than the corresponding VNPHsubpopulations. This finding reflects both the higher variability and higher expression of lineage markers in VNPL mESCs. Altogether, our analysis offers further support to the hypothesis that the low-NANOG state is more permissive for lineage priming and, furthermore, indicates that this priming is strongly modulated by the signalling environment in which mESCs are maintained. However, PCA analysis of individual gene expression Fig. 3. Clonogenic potential of Nanog:VNP subpopulations, under
different culture conditions (serum/LIF and 2i/LIF).(A) Representative histograms of FACS-sorted Nd subpopulations, grown in serum/LIF or 2i/LIF. VNPLand VNPHpopulations, as well as non-sorted bulk populations (All), were collected for posterior analysis. (B) Number and type of colonies (undifferentiated–AP positive, mixed or differentiated–AP negative; illustrative images in supplementary material Fig. S5) obtained from each mESC subpopulation (All, VNPL, VNPH) initially grown in serum/LIF (n=2). Subpopulations were plated at clonal density in serum/LIF or 2i/LIF media (600 cells per well of a six-well dish) and colony types analysed after 6 days. (C) Same as B for cells initially grown in 2i/LIF media (n=2), and replated in either serum/LIF or 2i/LIF. VNPLcells replated in serum/LIF generate predominantly mixed (71% and 92%) and differentiated colonies (27% and 6%), whereas VNPHcells generate fewer differentiated colonies and higher percentages of mixed and pure mESC colonies (more than 93% of total formed colonies). In addition, VNPHcells reveal higher clonogenic capacity than VNPL cells in 2i/LIF, although this difference is more attenuated when cells have been previously grown in 2i/LIF.
DEVEL
O
profiles across the various subpopulations from different media (Fig. 5B) does not show any preferential gene clustering along specific lineages, with only two discernible profile spaces: a more constrained space occupied by pluripotency genes, and a more scattered space where lineage-affiliated genes are distributed. This suggests that priming at the low-NANOG state is not biased for specific lineages, and that modulation by the signalling environment of mESCs does not impose definitive constraints on the initial steps of lineage specification.
DISCUSSION
Heterogeneity in NANOG expression is a hallmark of mESCs maintained in standard culture conditions (serum/LIF), and has been attributed to the existence of dynamic fluctuations in its expression in individual mESCs. It has also been speculated that such fluctuations might be an important property of pluripotent stem cells, creating windows of opportunity during which these cells can initiate lineage commitment (Silva and Smith, 2008). However,
NANOG fluctuations in mESCs have not been characterized in detail, and the lineage potential of mESCs with variable levels of fluctuating NANOG remains to be fully assessed.
In this paper, we have used a novel fluorescent reporter to appropriately monitor the dynamic expression of NANOG in mESCs cultured in various conditions. We also took advantage of this reporter to obtain purified populations of mESCs with low or high NANOG levels, and evaluated the differentiation potential of these cells. Altogether, our data suggest that NANOG fluctuations are an intrinsic property of the pluripotent state, providing a potential mechanism for mESCs to explore the available differentiation options before definitive lineage commitment.
NANOG fluctuations are an inherent feature of pluripotent mESCs
[image:6.612.52.555.56.514.2]Confirming our previous report (Abranches et al., 2013) that a subpopulation of low-NANOG mESCs is present in 2i/LIF culture conditions (see also Morgani et al., 2013), our time-lapse analysis of
Fig. 4. Fluidigm transcriptome analysis in FACS-sorted Nd mESCs.
(A) Gene expression profiling of pluripotency and lineage-affiliated genes (31 out of 48 genes tested) in cell samples collected [n=3 (serum/LIF) or
n=2 (2i/LIF and BMP4/LIF)] immediately after sorting of Nd mESCs grown in serum/LIF, 2i/LIF or BMP4/LIF
conditions. Data are represented as log2 fold changes of VNPLrelative to respective VNPHsamples. Values lower than−1 indicate lower expression (fold change≥2) in VNPLsamples ( pluripotency genes), whereas values higher than 1 indicate increased gene expression in VNPLmESCs. Genes are coloured according to their classification ( pluripotency, trophoectoderm, primitive endoderm, mesoderm and ectoderm). (B) Pair-wise comparison of the variations in expression for each individual gene (depicted as log2 fold changes) between VNPLand VNPHNd mESCs, grown in serum/LIF and 2i/LIF. Note for example thatPax3(30) has higher expression in VNPLmESCs from both 2i/LIF or serum/LIF, whileNestin
(29) is only higher in VNPLmESCs from serum/LIF. Also, variations in
pluripotency gene expression in 2i/LIF are below the fold change cut-off (2×), with exception ofZfp42(11) that has higher expression in VNPHmESCs (C) The same as B for VNPLand VNPHNd mESCs grown in serum/LIF and BMP4/ LIF. (D) The same as B for VNPLand VNPHNd mESCs grown in BMP4/LIF and 2i/LIF. PE, primitive endoderm; TE, trophoectoderm.
DEVEL
O
Nanog:VNP levels in mESCs reveals that NANOG fluctuations do also occur in 2i/LIF conditions, and with very similar dynamics to those observed in serum/LIF. Although the percentage of mESCs with NANOG expression is higher in 2i/LIF, the levels are not static and all expressing cells show Nanog:VNP fluctuations. Thus, in all tested culture conditions, fluctuations in NANOG levels seem to be an inherent feature of pluripotent mESCs.
We noticed also that mESCs grown in 2i/LIF show increased Nanog:VNP levels, when compared with serum/LIF (Fig. 3A). As our results indicate that fluctuations have similar dynamics in either media, this raises the question of how mESCs reach higher Nanog: VNP levels in 2i/LIF. This can be explained by the fact that mESCs grown in 2i/LIF have higher levels of Nanog and VnpmRNAs (Fig. 2 and data not shown), which must result in increased levels of VNP and NANOG per cell. As fluctuation rates are calculated as relative values, these are independent of the absolute number of reporter molecules per cell; hence, two individual mESCs can show similar fluctuation rates while having different VNP concentrations. In addition, our analysis points to a small increase in fluctuation rates of mESCs in 2i/LIF, together with a higher frequency of fluctuating cells. Altogether, these differences must underlie the observed higher levels of Nanog:VNP in 2i/LIF mESCs, when compared with serum/LIF conditions.
We further show that transitions from low- to high-NANOG expression (and vice versa) are much faster (in the range of hours) than previously predicted from population reversibility experiments that used long-lived GFP reporters (Chambers et al., 2007; Kalmar et al., 2009), occurring within the interphase of a single cell cycle. This finding challenges the hypothesis that NANOG heterogeneity in mESCs results from slow and global transcriptome fluctuations, over long timescales (one week or more) (Huang, 2009), and highlights the highly dynamic nature ofNanogexpression.
Our analysis shows also that mESCs can enter mitosis with very different levels of Nanog:VNP expression, and that sister cells that emerge from cytokinesis with similar levels might then diverge during the ensuing interphase. Thus, despite the finding that NANOG can regulate expression of cell cycle-associated genes (Choi et al., 2012), our work reveals that NANOG fluctuations are not correlated with the cell cycle. In addition, mESCs do not seem to
retain a ‘memory’of NANOG expression during successive cell divisions, highlighting the intrinsic stochasticity of NANOG fluctuations. Also, no periodicity in Nanog:VNP expression can be detected within a cell cycle. Altogether, these findings offer strong evidence for the stochastic nature of NANOG fluctuations in pluripotent mESCs, independently of the culture conditions. Actually, our finding that fluctuations are widespread in 2i/LIF conditions implies that NANOG fluctuations are not dependent on autocrine ERK signalling mediated by FGF4, as previously proposed (Silva et al., 2008; Nichols et al., 2009; Yamanaka et al., 2010; Herberg et al., 2014), although ERK signalling might modulate some dynamical aspects of these fluctuations.
Our analysis ofNanogmRNA distribution, using smFISH in Nd and E14tg2a mESCs, offers further evidence for the stochastic nature ofNanogexpression, revealing that NANOG heterogeneity is accompanied by an underlying variability at the level of mRNA transcription. In addition, the observed non-Poissonian Nanog mRNA distributions hint at a burst-like stochastic production of Nanogtranscripts, even when mESCs are at the pristine‘ground state’ (2i/LIF conditions). This is in agreement with recently published data, which show thatNanogburst-like transcription in mESCs may occur from both alleles in a non-coordinated manner (Hansen and van Oudenaarden, 2013; Deng et al., 2014). Strikingly, Nanog transcription from each allele seems to be even less correlated in mESCs grown in 2i/LIF conditions than in serum/ LIF conditions (as shown in figure 2C of Hansen and van Oudenaarden, 2013), further demonstrating the stochastic nature ofNanogexpression in pluripotent mESCs.
[image:7.612.145.469.57.223.2]A marked heterogeneity in NanogmRNA expression has also been reported in a recent paper (Faddah et al., 2013), in a different set of mESC lines. However, the authors also report a significant heterogeneity in mRNA expression for the pluripotency genesOct4 andSox2, although the coefficient of variation is about half of that reported forNanogmRNA. This finding is in agreement with the hypothesis that mRNA transcription in mESCs is a noisy process, probably as a result of the uniquely permissive chromatin environment found in mESCs (Gaspar-Maia et al., 2011). However, as both SOX2 and OCT4 proteins are more stable than NANOG in mESCs, the observed transcriptional noise is buffered at Fig. 5. Principal component analysis (PCA) of pluripotency and lineage-affiliated genes in VNPLand VNPHpurified-subpopulations of Nd mESCs.
(A) Distribution of subpopulations on scores plot. Each point corresponds to a biological sample and is coloured according to cell culture media, as indicated (serum/LIF: SL; 2i/LIF: 2iL; BMP4/LIF: BL). Empty marks refer to VNPLsubpopulations, whereas full marks refer to VNPHsubpopulations. Dashed circles highlight groups of samples occupying similar state spaces, reflecting higher similarity in their gene expression profiles. (B) Distribution of variables (genes) on loadings plot. Each point corresponds to a gene and is coloured according to its functional role, as indicated. Pluripotency genes are concentrated in the same state space highlighted by a dashed line. The variances associated with each principal component and corresponding eigenvalues are indicated in
supplementary material Fig. S6B. PE, primitive endoderm; TE, trophoectoderm.
DEVEL
O
the protein level for SOX2 and OCT4, leading to almost homogenous expression.
The analysis of different NANOG reporter cell lines performed by Faddah et al. (2013) also raised important questions about their reliability, which seems to be affected by the insertion of reporter cassettes, and emphasizes the need for designing adequate reporter constructs. In the case of the Nd reporter mESC line used in our studies, we show in this paper that it reproduces the variability in Nanog mRNA distributions found in the parental E14tg2a line. Together with the previous demonstration (Abranches et al., 2013) that NANOG heterogeneity is also similar in Nd and E14tg2a mESCs, these findings validate the Nd line as an adequate NANOG reporter, without the pitfalls found for other reporter lines due to interference with endogenous Nanog expression and/or use long-lived fluorescent reporters.
Functional relevance of NANOG fluctuations in the pluripotent state
Our evaluation of the lineage potential of mESCs with fluctuating levels of Nanog:VNP confirms that the low-NANOG state is molecularly and functionally distinct from the high-NANOG state. Actually, low-NANOG mESCs consistently show less clonogenic capacity than cells with high-NANOG, independently of the cell culture environment, and are also more predisposed to originate differentiated cell colonies. In addition, gene expression profiling of low- and high-NANOG mESCs reveals that lineage-priming at the low-NANOG state is a generalized phenomenon, as shown by the marked increase in expression of known lineage-affiliated regulators of all germ layers, including trophoblast. This increase occurs in any of the three different culture conditions used in our studies, although there is no obvious trend in the specific lineages that low-NANOG mESCs seem to be primed: in each of the tested conditions, the combination of lineage-affiliated genes with increased expression is qualitatively and quantitatively different, suggesting that lineage commitment does not occur through fixed and hierarchically organized pathways. Our results are more compatible with stochastic models of lineage decision (Pina et al., 2012; Teles et al., 2013), in which the initial events that bias cells to specific lineages are not predetermined, and mESCs can follow multiple trajectories into commitment, exploring the whole pluripotent decision space. These initial exploratory events are still revertible and occur when mESCs reach low NANOG levels; when fluctuating NANOG levels increase and mESCs move to a high-NANOG state, active lineage-specific genes are silenced and cells return to a naïve state. This model of an initially stochastic commitment is also supported by the single-cell profiling analysis ofNanogknockdown mESCs (MacArthur et al., 2012), which revealed random patterns of lineage-affiliated gene expression after 24 h ofNanogsilencing. We note, however, that NANOG fluctuations occur at a faster timescale, implying that the stochastic gene expression profiles reported for mESCs after 24 h of NANOG knockdown might reflect a more advanced stage towards differentiation, as indicated by the finding that approximately 50% of these cells have lostSox2andOct4expression (MacArthur et al., 2012).
Altogether, these results are consistent with a model in which the existence of stochastically generated states of low- and high-NANOG expression in individual mESCs allows the mESC population to simultaneously explore the available commitment options (‘lineage priming’) and maintain a pool of pristine pluripotent cells (‘self-renewal’). We also propose that NANOG fluctuations might serve in addition to ‘buffer’the conspicuous molecular heterogeneity observed in mESC populations, defining time-restricted windows of opportunity during which mESCs can
initiate lineage commitment, thereby contributing to the robustness of gene regulation in these cells. In summary, our work provides new insights into the role of Nanogin regulating the pluripotent state, and supports a model in which Nanog operates as an autonomous component of the pluripotency gene regulatory network, functioning as a noise modulator device to control cellular decision-making in mESCs.
MATERIALS AND METHODS
Maintenance and differentiation of mESCs
The mESC lines used for this study were Nd (Abranches et al., 2013) and E14tg2a (a kind gift from Austin Smith’s lab, University of Cambridge, UK). Nd mESCs were derived from E14tg2a mESCs and are a BAC-transgenic line for VNP-taggedNanoggene (Abranches et al., 2013).
mESCs were grown as described in Abranches et al. (2013). Different mESC culture media were used: Glasgow minimum essential medium (Invitrogen) supplemented with ES-qualified serum (Invitrogen) and LIF (serum/LIF conditions); 2i (iStem medium, Stem Cells Inc.) (Ying et al., 2008) supplemented with LIF (2i/LIF conditions); and ESGRO Complete Clonal Grade medium (Millipore Inc.) (Ying et al., 2003) supplemented with LIF (BMP4/LIF conditions). Additionally, mESCs were grown in Glasgow minimum essential medium supplemented with serum but in the absence of LIF for 48 h, as a‘differentiation control’(‘Diff’).
Single-cell live imaging
Cells were plated on poly-L-ornithine- (Sigma) and laminin- (Sigma) coated dishes and time-lapse images were acquired with an Andor spinning disk confocal microscope. Az-stack of seven images was acquired for each chosen field with slice intervals of 3.5 µm. The time interval between image acquisitions was set to 15 min and the duration of the experiment ranged from 18 to 39 h. Fluorescence quantification was performed using ImageJ software and subsequent mathematical analyses were carried out using R packages.
The kinetics of Nanog:VNP for mESCs grown in serum/LIF or 2i/LIF are shown in supplementary material Figs S2 and S3, respectively. Histograms deduced using the global data of all measured time points and all analysed cells are shown in supplementary material Fig. S1B. For each analysed cell during interphase, the amplitude of Nanog:VNP fluctuations was also calculated and represented in the form of a‘fluctuation index’(FIn). The rates of fluorescence increase (gain, +) or decrease (loss,−) were calculated for each time interval (15 min), and histograms were plotted for the obtained values in arbitrary units of fluorescence (A.U.F.) per hour (Fig. 1C). Finally, the kinetics of eight mother cells and respective progeny were analysed for mESCs grown in either serum/LIF or 2i/LIF (supplementary material Fig. S4).
Single-molecule fluorescentin situhybridization (smFISH)
smFISH using StellarisTM FISH probes (Biosearch Technologies) (Raj et al., 2008) was performed for mESCs grown in serum/LIF and in 2i/LIF conditions. TMR-labelledNanogprobes (supplementary material Table S1) were designed, prepared and used as published in Raj et al. (2008). Cells were imaged within 24 to 48 h on an inverted fluorescence Zeiss Axiovert 200M microscope, using a 100×1.4 oil-immersion objective and a cooled CCD camera (Roper Scientific Coolsnap HQ CCD), and data were processed using MATLAB (Raj et al., 2008).
Flow cytometry (FC) analysis
Live cell FC analysis and sorting experiments were performed as described in Abranches et al. (2013), on a FACS Calibur cytometer (Becton Dickinson) or a FACS Aria cell sorter (Becton Dickinson). For sorting, VNPLand VNPHNd mESC populations were collected and processed for clonal assays or RNA extraction. Representative histogram of FACS-sorted Nd subpopulations, grown in serum/LIF, 2i/LIF or BMP4/LIF are shown in Fig. 3A and supplementary material Fig. S6A. Bulk populations of mESCs (All) and‘Diff’ samples were also collected from the sorter and analysed.
Clonal assays
To assess the clonogenic potential of different mESC subpopulations (All, VNPLand VNPH) grown in serum/LIF or 2i/LIF, cells were plated at a
DEVEL
O
concentration of 60 cells/cm2, in six-well dishes. After 6 days in culture, cells were fixed, stained with AP and manually counted for the number of undifferentiated (AP positive), mixed and differentiated colonies (AP negative) (supplementary material Fig. S5).
RNA extraction and Fluidigm analysis
Total RNA was extracted from 106mESCs of each analysed subpopulation
using the High Pure RNA Isolation kit (Roche Diagnostics), with the inclusion of DNAseI treatment. The first strand cDNA was synthesized from 0.5 µg of total RNA using SuperscriptII Reverse Transcriptase (Invitrogen) and random hexamers. The absence of contaminating genomic DNA was confirmed by PCR amplification from RT negative samples. Converted RNA was subjected to preamplification PCR reaction to increase the number of template molecules. The preamplification was carried out in total volume of 20 µl and consisted of 2 µl of cDNA, 2 µl of primer mix (0.5 µM each), 10 µl of 2X SYBR GREEN (ThermoScientific) and 6 µl of water. The original cDNA template was amplified by 14 cycles according to the following conditions: 95°C for 10 min, denaturation of DNA strands was performed at 95°C for 15 s followed by annealing at 57°C for 4 min and strand synthesis phase at 72°C for 20 s. Two microlitres of ten-fold diluted preamplification mix was used for Fluidigm array and the experiment was carried out according to the manufacturer’s protocol.
Real-time PCR Ct values were normalized to the mean of control genes
(β-Actin and Gapdh) and the corresponding ΔCt values were used for
analysis (supplementary material Table S2). All data points below the limit of detection were excluded from further analysis, which resulted in 31 genes with reliable expression values.
Mathematical analysis was performed using R, which provided a set of principal component values for each sample and gene. The first two principal components explain more than 50% of the observed variability (supplementary material Fig. S6C) and were used to generate the PCA plots, both for the studied populations (Fig. 5A, score plot) and in terms of gene distribution (Fig. 5B, loading plot).
Acknowledgements
We thank Austin Smith and Meng Li (Cambridge, UK) for mESC lines, Gianluca Selvaggio for help with imaging, Ana Luisa Caetano for FACS sorting and JoséRino and António Temudo for Microscopy support.
Competing interests
The authors declare no competing financial interests.
Author contributions
E.A. and D.H. conceived and designed the experiments. E.A., A.M.V.G. and M.M. performed the experiments. E.A. and D.H. analysed the data. A.R., H.M. and P.S. contributed reagents/materials/analysis tools. E.A. and D.H. wrote the paper.
Funding
This work was supported by Fundação para a Ciência e Tecnologia, Portugal [SFRH/ BPD/78313/2011 to E.A., SFRH/BD/80191/2011 to A.M.V.G. and PTDC/SAUOBD/ 100664/2008]. M.M. and P.S. were supported by The Academy of Sciences of the Czech Republic [ project M200521202]. P.S. is a member of the Centre for RNA Biology funded by the Czech Science Foundation [GACR P305/12/G034].
Supplementary material
Supplementary material available online at
http://dev.biologists.org/lookup/suppl/doi:10.1242/dev.108910/-/DC1
References
Abranches, E., Bekman, E. and Henrique, D. (2013). Generation and
characterization of a novel mouse embryonic stem cell line with a dynamic reporter of nanog expression.PLoS ONE8, e59928.
Adachi, K. and Niwa, H.(2013). A liaison between intrinsic and extrinsic regulators
of pluripotency.EMBO J.32, 2531-2532.
Chambers, I., Silva, J., Colby, D., Nichols, J., Nijmeijer, B., Robertson, M.,
Vrana, J., Jones, K., Grotewold, L. and Smith, A.(2007). Nanog safeguards
pluripotency and mediates germline development.Nature450, 1230-1234.
Chickarmane, V., Troein, C., Nuber, U. A., Sauro, H. M. and Peterson, C.(2006).
Transcriptional dynamics of the embryonic stem cell switch.PLoS Comput. Biol.2, e123.
Choi, S.-C., Choi, J.-H., Park, C.-Y., Ahn, C.-M., Hong, S.-J. and Lim, D.-S.
(2012). Nanog regulates molecules involved in stemness and cell cycle-signaling
pathway for maintenance of pluripotency of P19 embryonal carcinoma stem cells. J. Cell Physiol.227, 3678-3692.
Deng, Q., Ramskold, D., Reinius, B. and Sandberg, R.(2014). Single-cell
RNA-seq reveals dynamic, random monoallelic gene expression in mammalian cells. Science343, 193-196.
Dietrich, J. E. and Hiiragi, T.(2008). Stochastic processes during mouse blastocyst
patterning.Cells Tissues Organs188, 46-51.
Faddah, D. A., Wang, H., Cheng, A. W., Katz, Y., Buganim, Y. and Jaenisch, R.
(2013). Single-cell analysis reveals that expression of nanog is biallelic and equally variable as that of other pluripotency factors in mouse ESCs.Cell Stem Cell13, 23-29.
Filipczyk, A., Gkatzis, K., Fu, J., Hoppe, P. S., Lickert, H., Anastassiadis, K. and
Schroeder, T.(2013). Biallelic expression of nanog protein in mouse embryonic
stem cells.Cell Stem Cell13, 12-13.
Gaspar-Maia, A., Alajem, A., Meshorer, E. and Ramalho-Santos, M.(2011).
Open chromatin in pluripotency and reprogramming.Nat. Rev. Mol. Cell Biol.12, 36-47.
Glauche, I., Herberg, M. and Roeder, I.(2010). Nanog variability and pluripotency
regulation of embryonic stem cells–insights from a mathematical model analysis. PLoS ONE5, e11238.
Guantes, R. and Poyatos, J. F.(2008). Multistable decision switches for flexible
control of epigenetic differentiation.PLoS Comput. Biol.4, e1000235.
Hansen, C. H. and van Oudenaarden, A.(2013). Allele-specific detection of single
mRNA molecules in situ.Nat. Methods10, 869-871.
Herberg, M., Kalkan, T., Glauche, I., Smith, A. and Roeder, I.(2014). A
model-based analysis of culture-dependent phenotypes of mESCs. PLoS ONE9, e92496.
Huang, S.(2009). Non-genetic heterogeneity of cells in development: more than just
noise.Development136, 3853-3862.
Kalmar, T., Lim, C., Hayward, P., Munoz-Descalzo, S., Nichols, J., Garcia-Ojalvo, J.̃
and Martinez Arias, A.(2009). Regulated fluctuations in nanog expression mediate
cell fate decisions in embryonic stem cells.PLoS Biol.7, e1000149.
Lanner, F. and Rossant, J.(2010). The role of FGF/Erk signaling in pluripotent
cells.Development137, 3351-3360.
MacArthur, B. D. and Lemischka, I. R. (2013). Statistical mechanics of
pluripotency.Cell154, 484-489.
MacArthur, B. D., Please, C. P. and Oreffo, R. O. C.(2008). Stochasticity and the
molecular mechanisms of induced pluripotency.PLoS ONE3, e3086.
MacArthur, B. D., Sevilla, A., Lenz, M., Müller, F.-J., Schuldt, B. M., Schuppert,
A. A., Ridden, S. J., Stumpf, P. S., Fidalgo, M., Ma’ayan, A. et al.(2012).
Nanog-dependent feedback loops regulate murine embryonic stem cell heterogeneity.Nat. Cell Biol.14, 1139-1147.
Miyanari, Y. and Torres-Padilla, M.-E.(2012). Control of ground-state pluripotency
by allelic regulation of Nanog.Nature483, 470-473.
Morgani, S. M., Canham, M. A., Nichols, J., Sharov, A. A., Migueles, R. P., Ko,
M. S. H. and Brickman, J. M.(2013). Totipotent embryonic stem cells arise in
ground-state culture conditions.Cell Rep.3, 1945-1957.
Muñoz Descalzo, S., Rué, P., Faunes, F., Hayward, P., Jakt, L. M., Balayo, T.,
Garcia-Ojalvo, J. and Martinez Arias, A.(2013). A competitive protein interaction
network buffers Oct4-mediated differentiation to promote pluripotency in embryonic stem cells.Mol. Syst. Biol.9, 694.
Navarro, P., Festuccia, N., Colby, D., Gagliardi, A., Mullin, N. P., Zhang, W.,
Karwacki-Neisius, V., Osorno, R., Kelly, D., Robertson, M. et al.(2012).
OCT4/SOX2-independent Nanog autorepression modulates heterogeneous Nanog gene expression in mouse ES cells.EMBO J.31, 4547-4562.
Nichols, J. and Smith, A.(2009). Naive and primed pluripotent states.Cell Stem
Cell4, 487-492.
Nichols, J., Silva, J., Roode, M. and Smith, A. (2009). Suppression of Erk
signalling promotes ground state pluripotency in the mouse embryo.Development
136, 3215-3222.
Niwa, H., Ogawa, K., Shimosato, D. and Adachi, K.(2009). A parallel circuit of LIF
signalling pathways maintains pluripotency of mouse ES cells.Nature 460, 118-122.
Ohnishi, Y., Huber, W., Tsumura, A., Kang, M., Xenopoulos, P., Kurimoto, K.,
Oleś, A. K., Araúzo-Bravo, M. J., Saitou, M., Hadjantonakis, A.-K. et al.
(2014). Cell-to-cell expression variability followed by signal reinforcement progressively segregates early mouse lineages.Nat. Cell Biol.16, 27-37.
Pina, C., Fugazza, C., Tipping, A. J., Brown, J., Soneji, S., Teles, J., Peterson, C.
and Enver, T.(2012). Inferring rules of lineage commitment in haematopoiesis.
Nat. Cell Biol.14, 287-294.
Posfai, E., Tam, O. H. and Rossant, J.(2014). Mechanisms of pluripotency in vivo
and in vitro.Curr. Top. Dev. Biol.107, 1-37.
Raj, A. and van Oudenaarden, A. (2009). Single-molecule approaches to
stochastic gene expression.Annu. Rev. Biophys.38, 255-270.
Raj, A., van den Bogaard, P., Rifkin, S. A., van Oudenaarden, A. and Tyagi, S.
(2008). Imaging individual mRNA molecules using multiple singly labeled probes. Nat. Methods5, 877-879.
Silva, J. and Smith, A.(2008). Capturing pluripotency.Cell132, 532-536.
DEVEL
O
Silva, J., Barrandon, O., Nichols, J., Kawaguchi, J., Theunissen, T. W. and
Smith, A.(2008). Promotion of reprogramming to ground state pluripotency by
signal inhibition.PLoS Biol.6, e253.
Silva, J., Nichols, J., Theunissen, T. W., Guo, G., van Oosten, A. L., Barrandon,
O., Wray, J., Yamanaka, S., Chambers, I. and Smith, A.(2009). Nanog is the
gateway to the pluripotent ground state.Cell138, 722-737.
Singh, A. M., Hamazaki, T., Hankowski, K. E. and Terada, N. (2007).
A heterogeneous expression pattern for nanog in embryonic stem cells.Stem Cells25, 2534-2542.
Teles, J., Pina, C., Edén, P., Ohlsson, M., Enver, T. and Peterson, C.(2013).
Transcriptional regulation of lineage commitment–a stochastic model of cell fate decisions.PLoS Comput. Biol.9, e1003197.
Toyooka, Y., Shimosato, D., Murakami, K., Takahashi, K. and Niwa, H.(2008).
Identification and characterization of subpopulations in undifferentiated ES cell culture.Development135, 909-918.
Trott, J., Hayashi, K., Surani, A., Babu, M. M. and Martinez-Arias, A.(2012).
Dissecting ensemble networks in ES cell populations reveals micro-heterogeneity underlying pluripotency.Mol. Biosyst.8, 744-752.
Wray, J., Kalkan, T. and Smith, A. G.(2010). The ground state of pluripotency.
Biochem. Soc. Trans.38, 1027-1032.
Yamanaka, Y., Lanner, F. and Rossant, J. (2010). FGF signal-dependent
segregation of primitive endoderm and epiblast in the mouse blastocyst. Development137, 715-724.
Ying, Q.-L., Nichols, J., Chambers, I. and Smith, A.(2003). BMP induction of Id
proteins suppresses differentiation and sustains embryonic stem cell self-renewal in collaboration with STAT3.Cell115, 281-292.
Ying, Q.-L., Wray, J., Nichols, J., Batlle-Morera, L., Doble, B., Woodgett, J.,
Cohen, P. and Smith, A.(2008). The ground state of embryonic stem cell
self-renewal.Nature453, 519-523.
Young, R. A.(2011). Control of the embryonic stem cell state.Cell144, 940-954.