Full Length Research Article
GLOBALIZATION AND EXPENDITURE INEQUALITY IN INDONESIA: A PANEL DATA APPROACH
*Rayner Tabetando
103-0064, Aomi Koto-ku Tokyo, Japan
ARTICLE INFO ABSTRACT
This study uses provincial export and import data and household consumption expenditure data (Susenas) to analyze the impact of globalization on inequality in Indonesia for the period 2000-2010. In a fixed effect panel regression framework, the relationship between globalization and inequality is estimated. The main results show that globalization has an inequality enhancing effect on inequality for provinces with globalization rate beyond a certain critical threshold. While it had a decreasing effect on inequality for provinces below the critical rate of globalization. Wage differentials between skill and unskilled labor as well as between sectors appears to be the main channel through which accelerated globalization enhances inequality in some provinces in Indonesia. Consequently human resource capacity building appears to be a condition sine qua non in rolling back inequality in Indonesia.
Copyright © 2014 Rayner Tabetando.This is an open access article distributed under the Creative Commons Attribution License, which permits unrestricted use, distribution, and reproduction in any medium, provided the original work is properly cited.
INTRODUCTION
Globalization generally refers to how connected or open a country is to the rest of the world. FDI and trade to GDP ratio appears to be the most widely used proxies for globalization. The potential impact of globalization on economic and social wellbeing has been of interest to researchers for many decades. The advent of export driven emerging economies in Asia, Latin America, Africa and parts of Europe as well as global concern on poverty reduction has led a to a renewed interest in the nexus: globalization-inequality. The Hecksher-Ohlin model (1919) is one of the earliest theories to postulate that international trade (globalization) has an inequality decreasing effect notably in labor abundant economies. They argue that with trade liberalization, countries will specialize in the production of those goods in which the required inputs are in abundant supply. Consequently labor abundant countries will tend to export labor intensive products while capital (skill) abundant countries will export products that are capital and skill intensive. Given this scenario, labor abundant countries in Africa, Asia and Latin America will see a rise in returns to unskilled labor, this will ultimately lead to a convergence in earnings between skilled and unskilled labor thus closing wage
*Corresponding author: Rayner Tabetando 103-0064, Aomi Koto-ku Tokyo, Japan
differential inequality. However widening inequality in labor earnings in most emerging and developing economies in
today’s globalized world brings to the lime light the
weaknesses of the Hecksher-Ohlin model. The Norwegian Institute of International Affairs, NUPI (2000) in a report concludes that on a whole, inequality between countries decreased during the period 1960-1998. The report argues that
UNDP’s estimates pointing to an increase in between
countries inequality for the same period are not tenable. The report indicates that UNDP’s estimates are based on income
figures that have not been adjusted for differences in prices.
NUPI’s report however identifies significant variation in
between country inequality among regions. The report indicates that East and South East Asian countries have experienced strong growth in income and living standards and reduced their gap vis a vis richer nations. Contrarily, Sub Saharan Africa and Eastern Europe experienced weaker growth and thus widening gap between them and the richer western countries. As Ravaillon (2009) points out, the relationship between globalization and inequality is ambivalent. Several studies have found different and contradictory results giving rise to different policy implications. Giovanni Cornea and Julius Court (2001), Xiaobo (2003) all finds an inequality decreasing impact of globalization. Rourke (2001), Suryahadi (2001) on their part finds both an inequality enhancing effect of globalization as
ISSN: 2230-9926
International Journal of Development Research
Vol. 4, Issue, 12, pp. 2816-2820, December, 2014
International Journal of
DEVELOPMENT RESEARCH
Article History:
Received 30thSeptember, 2014
Received in revised form 01stOctober, 2014
Accepted 29thNovember, 2014 Published online 27thDecember, 2014
Key words:
well some mixed effect. The main distinctive feature of our study is that, unlike previous studies our study focusses on a single country, Indonesia. Our study makes use of a rich provincial panel data set covering 33 provinces from the year 2000 to 2010. This data set is constructed from the National Socio-economic Survey (Susenas)1. We construct several inequality measures based on provincial household expenditure. Expenditure base inequality measures are less prone to changes in price level especially in an inflationary economy like Indonesia. These inequality measures are used successively as dependent variables in our panel data regression. Equally unlike previous studies on Indonesia, this study is unique in that it uses a composite indicator for globalization i.e. trade to gdp ratio. Provincial export and import data are collated from annual trade bulletins and then expressed as a percentage of provincial gdp. This measure was
proposed by the UN Commission on Trade
(UN-COMTRADE) as it takes into consideration the economic size of each observation as well its level of commercial activity. Indonesia is the largest archipelagic country in the world with more than 17,500 Islands, has grown at an average annual
GDP growth rate of around 5.5 %. It’s trade to gdp ratio
attained 44% in 2012. Trade expansion has been a major engine for growth. This study sets out to evaluate the distributional effect of globalization on the wellbeing of Indonesians
MATERIALS AND METHODS
Data
This study uses Susenas data set covering more than 200,000 households with a fair coverage of both rural and urban households. The Susenas is collected annually by the Indonesian bureau of statistics known as Bapenas. Household level data is collected every year on several variables such as health, education, income, expenditure etc. This study conducts a panel regression using household level expenditure data aggregated into 33 provinces. 302 observations are used. Provincial import and export data are collated from several annual trade bulletins in other to construct a measure of globalization. It is worth mentioning that provinces like Aceh, Papua and Maluku have not been covered in some rounds of data collection. This gives rise to missing observations
Methodology
This study employs a wide range of inequality measures notably Gini, Theil L, Theil T and Coefficient of Variation (CV). These different measures are used to gauge the evolution of inequality between the years 2000-2010. The above measures satisfy the key properties of an effective measure of inequality; Anonymity, mean independence, population homogeneity and Pigou-Dalton transfer principle
Theil Indices and their Decomposition
Theil T and Theil L indices have the advantage of been decomposable into population sub groups. Suppose there are n
1The National Socioeconomic Survey (Susenas) is an annual
large scale household data collection exercise launched in 1963. It covers more than 200,000 households with focus on health, education, income and expenditure.
households in a population which are classified into m mutually exclusive and collectively exhaustive groups in compliance with a given classification criteria such as gender, provinces, regions, age etc. let: , is themean per capita expenditure of all households, ,mean per capita expenditure of households in group i, ,the number of households in group
i, , per capita expenditure of household j in group i
From the above and in compliance with Akita (2012) the Theil indices can be measured as follows:
=1 log 1
=1 2
As earlier on mentioned, Theil L and Theil T are decomposable into within group ( and ) between group components ( and ). Going by Shorrocks (1980) we can derive the following
= + log
= + 3
and
= +
= + 4
Where , and are the within group theil indices T and L
This study equally makes use of the Gini coefficient. Observations (households) are arranged in a non-descending other of per capita income or per capita expenditure. i.e. .,
y1≤ y2≤ y3…≤ yn. Given the above non descending classification of per capita income or expenditure, the Gini is expressed as:
= ( ( ), ) 5
Where ( ),is the rank of households in the distribution of per capita income or per capita expenditure.
This study uses fixed effect identification strategy to estimate the impact of globalization on inequality. Fixed effect controls for possible time invariant unobserved province specific factors or characteristics. Possible unobserved time invariant factors include natural resource endowment, climate as well as other factors. Fixed effect identification strategy enables us to decompose our composite error term into a random term and a time unvarying term. The specification is as follows
= + + +
− = ( − ) + ( − ) +
( − )+ ( − ) + ( − ) +
( − ) ... (7)
After taking simple difference we obtain;
∆ = ∆ ( ) + ∆ ( ) + ∆ ( ) + ∆ …….(8)
Where is any of our three inequality measures (Theil indices or Gini) for province in year is our globalization index for province in year . It is provincial trade to Gdp ratio. Finally, is a row vector which includes year dummies, interaction terms, and regional dummies. Equation (8) is the final fixed effect specification. It is free from any time unvarying unobserved factors as well as it does not have an intercept term
RESULTS AND DISCUSSION
Evolution in Overall Inequality [image:3.595.311.558.126.223.2]As can be seen from Table 1, inequality has been on a rising trend throughout the decade 2000-2010, except in 2010 where in there was a marginal decrease in overall inequality. All inequality measures except the Coefficient of Variation confirms this general upward trend in inequality in Indonesia between the years 2000-2010. BPS2and a host of other studies such as Akita and Sagala (2013) have equally identified a similar trend for the period 2000-2010.
Table 1. Trend in Inequality
It would appear that the year 2008 was marked by very high inequality as measured by the Gini, Theil L and Theil T which stands at 0.354, 0.21039 and 0.24155 respectively. These estimates are very reliable given that the official Gini index for 2008 as published by BPS stood at 0.35 while the World Bank Gini (income) estimates for 2010 stood at 0.35, which is quite identical to our estimates for the same period.
Evolution in Provincial Inequality
As can be seen from Table 2, throughout the period of this study, Di Yogyarkata records very high levels of inequality with the peak being a Gini of 0.42 recorded in 2006.
2BPS (Badan Pusat Statistik) is the Indonesian National
Bureau of Statistics
In terms of group of provinces with the highest inequality, there were little changes between the period 2000-2010. A limited number of provinces were consistently present among the five most unequal provinces. In the year 2000 Maluku Utara had the highest inequality estimated at a Gini of 0.377.
Source: Authors calculation using Susenas data Fig. 1. Evolution of Provincial Inequality
In terms of contribution to overall inequality measured by Theil T, it appears that the provinces within the Java area contributed the most to overall inequality between 2000-2010. This outcome of our analysis is in line with our intuition as well as with the results of previous studies such as Akita (2003) and Akita and Sagala (2013). It appears that Java Timur and Java Barat are the leading provinces with an average contribution to overall inequality as measured by Theil T of close to 10% and 9% respectively throughout the period 2000-2010.
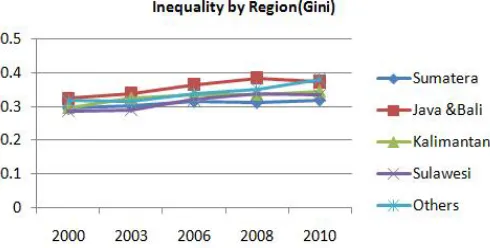
Evolution in Regional Inequality
All indicators point to the fact that Java-Bali is the leading region in terms of inequality. The Gini coefficient for Java-Bali has never gone below 0.3 throughout the study period. Inequality in Java-Bali attained its peak in 2008 when its gini attained a record 0.384.
Source:Authors’ calculation Using susenas expenditure data
Fig. 2. Evolution in region inequality
Year Gini TheilT TheilL CV
2000 0.31 0.19 0.16 0.32
2003 0.33 0.21 0.17 0.47
2006 0.34 0.24 0.19 0.58
2008 0.35 0.24 0.21 0.42
[image:3.595.311.556.487.611.2]2010 0.35 0.24 0.20 0.43
Table 2. Provinces with Highest Inequality
Rank 2000 2003 2006 2008 2010
1 Maluku .U Diyorgyarkata DiYogyarkata DiYogyarkata DiYogyarkata
2 DiYogyarkata Papua N.T.T kal.Ti N.T.T
3 Riau Kalimantan.Ti kalimantan.T DKI DKI
4 Silawesi Tengah DKI DKI Java.Ti Banten
5 Kalimantan.B Banten K.Riau Java.B Sul.Tengah
Its Theil T, Theil L and CV are equally very high throughout the study period. This high inequality registered in the Java-Bali region is not surprising given that Java-Java-Bali region accounts for at least 35 per cent of both income and population share at all times throughout the years 2000-2010. It thus appear that it has the highest level of economic activity in Indonesia.
Trends in Urban-Rural Inequality
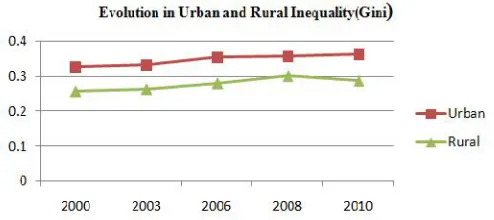
Evolution in urban and rural inequalities has been quite similar to the trend in overall inequality in Indonesia. Urban and rural inequality rose throughout the period 2000-2010. In line with our expectation, urban inequality is far above rural inequality. The relative homogenous nature of the rural economy compared to the urban economy accounts for this rural-urban difference in inequality rates.
Source: Authors’ calculation Using Susenas expenditure data
Fig. 3. Trend in Urban and Rural Inequality
Globalization and Inequality
From the above estimation, it appears that provinces with relatively lower level of globalization have lower inequality, while provinces with higher levels of globalization are associated with greater inequality.
Thus on a whole higher globalization is associated with higher inequality. At a certain critical value of globalization ( ∗), inequality is at it minimum, beyond this critical point, globalization has an inequality enhancing effect. Assuming that globalization (g) ranges between 0 and 1 i.e0 ≤ ≥ 1,
∗is given as;
= + +
Where I is inequality (gini) and is globalization (openness)
= + 2
∗= > 0,
Precisely from table 5, we can compute ∗as 0.55
It appears that the most industrial and globally connected provinces notably those of the Java-bali region have the highest level of inequality. This is most likely due to their heavy connection to the global economy. In terms of the mechanism, it appears that globalization leads to significant wage differentials. Rural provinces with a relatively low rate of globalization ( < ∗) are characterized by a relatively homogenous expenditure distribution. On the other hand the highly industrialized and globalized ( > ∗) provinces are associated with relatively high disparities in income and expenditure distribution. This disparity in expenditure distribution is rooted in huge wage differentials between skilled and unskilled labor as well as between sectors.
DISCUSSION
In this study we have identified an increasing trend in inequality between the years 2000-2010. This trend is in line with estimates of the Indonesian statistics bureau, Bapenas. As well as estimates obtained in a host of previous studies. Our results equally indicates that globalization has an inequality decreasing impact for provinces with globalization rate below the critical threshold of 0.55. Above this threshold, globalization has an inequality enhancing effect. Wage differentials between skilled and unskilled labor appear as a major channel through which globalization enhances inequality in highly globalized and industrialized provinces. Consequently human resource capacity building is a condition sine qua non in rolling back inequality in these provinces of Indonesia. Stepping up investment in formal education as well as rapid vocational training is crucial.
Acknowledgment
The authors wish to acknowledge the guidance of Prof Akita Takahiro
REFERENCES
Akita, Takahiro and Rizal A. Lukman, 1995. Interregional Inequalities in Indonesia: A sectoral decomposition Analysis for 1975-92. Bulletin of Indonesia n Economic
Studies, 31(2), 61-81
[image:4.595.40.287.262.372.2]Akita, Sagala and Yusuf, 2013. Urbanization and Expenditure Inequality In Indonesia: Testing Kuznets Hypothesis with Table 5. Panel data regression analysis fixed effects model (main variables)
Gini Theil L Theil T
Ind Variable Coef Se Coef Se Coef Se
Glob -0.10 0.05* -0.06 -1.23 -0.09 -1.44
Sq_Glob 0.09 0.03*** 0.06 0.03*** 0.07 0.04*
Urban 0.11 0.01*** 0.07 0.01*** 0.08 0.02***
Sq_Urban -0.29 0.07*** -0.24 0.07*** -0.26 0.09***
Grdp 2.41 0.08* 2.41 0.01*** 3.27 0.01**
Sq_Grdp -1.98 1.20 -2.32 1.21* -3.50 1.54**
Provincial Panel Data. Letters in Spatial and Resource Sciences
Central Bureau of Statistics, Various issues, Gross Regional
Domestic Product of Provinces in Indonesia, Central
Bureau of Statistics, Jakarta, Indonesia
Central Bureau of Statistics, Various issues, Gross Regional
Domestic Product of Provinces in Indonesia by Expenditure, Central Bureau of Statistics, Jakarta, Indonesia
Central Bureau of Statistics, Various issues, Export and
Import volumes by major sea ports, Central Bureau of
Statistics, Jakarta, Indonesia
Deaton, Angus 1997. The Analysis of Household Surveys: a Microeconomic Approach to Development Policy. Johns
Hopkins University Press
Giovanni Cornia and Julius Court, 2001. “Inequality, growth
and poverty in the era of liberalization and globalization,
UNU/WIDER Policy Brief No.4
Kuznets and Simon Smith, 1955. Economic Growth and Income Inequality. American Economic Review, 45(1),
1-28.
Shorrocks, A.F. 1982. Inequality Decomposition by Factor Components. Econometrica, 50(1), 193-212.
Shorrocks, Anthony and Guanghua Wan, 2005. Spatial Decomposition of Inequality. Journal of Economic Geography, no 5, 59-81
Suryahadi, Asep Yadi, 1998. The Effects of Openness on Developing Country Labour Markets: The Case of Indonesia, unpublished PhD dissertation, Australian National University, Canberra.
Suryahadi, Asep Yadi, 2001 Globalization and Wage Inequality in Indonesia, A CGE Analysis, East- West Centre Working Papers, Economic Series, No 26, May 2001
Williamson, J.G., 1965. Regional Inequality and the Process of National Development: A Description of the Patterns.
Economic Development and Cultural Change, 13(4), 3-45
Wood, A., 1994. North-South Trade, Employment and Inequality: Changing Fortunes in a Skill-Driven World,
Clarendon Press, Oxford.
Wood, A., 1995. Openess and Wage Inequality in Developing Countries; The Latin American Challenge to East Asian Conventional Wisdom. The World Bank Economic Review, 11(1), 33-57
Wooldridge, J.M., 2006, Econometric Analysis of Cross Section and Panel Data, MIT Press, Massachusetts.