RECONSTRUCTING, AUGMENTING AND MANIPULATING
3D SCENE FROM SEQUENCE OF IMAGES
1
Osama Hosam
*, 2
Nadhir Ben Halima,
3Sameh Dakroury,
4Essam O. Abdel-Rahman
1,2,3,4Asstt Prof., Faculty of Computer Science and Engineering, TAIBAH UNIVERSITY, KSA
1Asstt Prof., The City for Scientific Research and Technology Applications, IRI, Alexandria, EGYPT
3Asstt. Prof., Department of Engineering Mathematics, Faculty of Engineering, Cairo University, EGYPT
* Correspondence Author
E-mail: 1mohandesosama@yahoo.com , 2nadhir_bh@yahoo.fr , 3sdakrory@hotmail.com ,
4essamothman1@yahoo.com
ABSTRACT
In this paper, the scene parameters are setup for scene reconstruction; camera position and orientation are considered. Consecutive images are used to create the depth map of the scene. After reconstructing the scene, we apply a new methodology to augment the scene by using LAB color space and K-means clustering. A general scheme for scene manipulation is also introduced. The new methodology has shown high accuracy in scene reconstruction and augmentation.
Keywords: 3D Reconstruction, Scene Manipulation, Augmented Reality, Shape from Stereo, 3D Point Cloud Generation.
1. INTRODUCTION
The detection of third dimension by using multiple images follows naturally from the physical behavior of human eyes in the vision of 3D objects. The two eyes take pairs of images (one for each eye) for the same view. Using this image pair (also called stereo image), the depth or the third dimension can be defined. Many approaches are available for detecting the third dimension of an image, namely, shape from shading [1], shape from texture [2], shape from motion [3], and shape from multiple images or pair of images (stereo) [4, 5, 6].
The main idea behind constructing 3D model from multiple images is the concept of motion parallax [8]. An observer looking outside of car glass window will notice that objects near the car will move faster than those far away. This shift in speed is called the motion parallax. The same concept can be applied in case of an aircraft taking multiple images. Higher objects will appear moving faster than lower objects. In this case, the shift in speed is called the x-parallax of the satellite image [9]. Therefore, given multiple images of the same view, objects will not appear in the same position in each image. Instead, objects position will be shifted in the image. This shift is called the disparity.
Correspondence or matching can be used to find the disparity [4].
In this paper, we introduce an approach for reconstructing and manipulating the scene from multiple images. First, the reconstruction of 3D cloud points of the scene is shown. Second, the scene is reconstructed in colored format and finally, the 3D reconstructed scene is manipulated with interpolation approach.
2. SETTING UP THE RECONSTRUCTION PARAMETERS
In this section, the preliminaries needed for 3D reconstruction are introduced. For example; how to do projections of the points; how to transform them from 2D to 3D and vice versa. Then how to build the colored point cloud from the original image and the provided depth map.
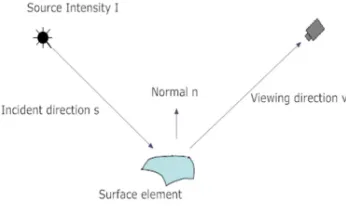
Projections: Assuming the camera calibration
(camera parameters are properly set), the third dimension can be inferred from pair of images (successive images in the scene sequence). As shown in Figure 1. Where P is the point in the
scene and and are the projections of the point
Figure 1: Setting Up The Reconstruction
Environment.
The shift of the point is and the shift of
is . The disparity d is defined as the difference
between xl and xr . From the similar triangles
( ,P, ) and (Ol,P,Or) we have,
) 1 ( Z T f Z x x
T l r =
− − +
Solving (1) for Z we have,
) 2 ( d T f Z =
From equation (2) we find that the depth is inversely proportional to the disparity, we conclude that the distance objects seem to move (shift) more slowly than close ones. If Z is given, such as in the case of point cloud of the scene, we can get the projection of the point or its x, y coordinates. So the formula in (2) helps us convert from 3D point to 2D coordinates and vice versa.
3. EPIPOLAR GEOMETRY ESTIMATION
In this section, a detailed explanation of a 3D reconstruction method is given. The method starts by taking pair of images and applying a powerful
segmentation technique, namely, K-means
clustering technique [10]. K-means will separate each image into 3 images. Each image contains different segments of the scene. For each of the 3 cluster images, an open filter is applied to remove the segments which may incur error. Then the images are binarized to separate the objects from the background. The correspondence between each cluster of the first image and clusters of the second image is calculated. Equations (1) , (2) are then used to build a dense disparity map or depth map.
The features for each region are:
Centroid - find x-y coordinates of the center of the region. The center of the region can be obtained as the half of the height and width of the region.
Area A – can be calculated by counting the
number of pixels in the region
∑∑
− = − = = 1 0 1 0 . ) 3 ( ) , ( N r N c ii I r c
A
where Ai is the area of the region i, and r, c represent the row and column values respectively.
Perimeter p – found by perform an edge detector and count “1” pixels.
Thinness ratio T – has a maximum value of 1, corresponding to a circle, and decreases as object gets thinner or perimeter gets more convoluted:
) 4 (
4 2
= p A T π
Irregularity or compactness ratio – 1/T, reciprocal of the thinness ratio.
Aspect ratio – also called elongation or eccentricity, ratio of bounding box:
) 5 ( 1 1 min max min max + − + − = r r c c Ratio Aspect
The disparity for each pixel in region S is
computed as the distance between the centroids of
the region S in both right and left images.
4. BUILDING A 3D POINT CLOUD FROM A DEPTH IMAGE
The 3D point cloud is constructed by extracting the 3D coordinates and the RGB values for each pixel of the image. The following procedure is carried out iteratively through the image pixels and their corresponding depth values to obtain the required 3D point information:
Step 1: start with first point of the image.
Step 2: capture the x-y coordinates of the current
point
,
.Step 3: obtain the value of from the depth
map to construct a 3D coordinate point
, ,
.Step 4: extract the RGB values for the current
Step 5: until all 3D points are generated, increase
to the next point and go to Step 2.
The above procedure returns the 3D coordinate matrix and also a second matrix containing the RGB color values for each point of the image.
5. GENERATING 2D FRAME USING 3D+RGB POINTS:
Given the set of 3D points of the image and their corresponding RGB values, a 2D frame for a specific camera view can be generated, i.e. , the points must be projected back on the camera frame (imagined). First the FOV (Field Of View) for the camera is identified. Since the projection is not orthogonal ( it is perspective in this case), the convex hull of the view needs to be calculated. All points in the convex hull are viewed by the camera. Z-buffer will hold the points that maps to a single projection or frame point. The following procedure constructs the 2D frame for the camera view:
Step 1: given the
, ,
coordinates for allpoints, find the azimuth and elevation angles ,
shown in Figure 2.
Step 2: using and , find the normal vector
to the viewing plane .
Step 3: project the
, ,
points on the viewingplane ( the null space of ) to find the set of 2D
points
,
.Step 4: construct the convex hull of the view
using the 2D points
,
.Step 5: calculate the area of the polygon
formed by the exterior points of the set
,
[image:3.595.129.260.565.685.2]described by .
Figure 2: Camera View Angles ,
The set of points
,
forms the resultingframe coordinates for each of the scene points. It is
straight forward to get the RGB colors for each point.
6. RIGID TRANSFORMATION
EXTRACTION AND ENHANCING THE 3D POINT CLOUD
Transformation in computer graphics means to get the new pose of the object after rotation, translation and scaling. Combining them together or taking a single transformation can be accomplished
by matrix multiplication. The rotational
transformation and scaling matrices are multiplied by the current scene points to get the new view for the scene. The point cloud transformation matrices (Translate) and (Rotation) can be obtained by using two corresponding sets of 3D points having the same colors. The problem is to find and satisfying the equation:
.
where and are the two corresponding sets
of data points. First, the centroids of both data sets are obtained
!
" ̅
!, $
!, ̅
!%
&1
( )
!,
!,
! |& +,
!
" ̅
!, $
!, ̅
!%
&( )
1
!,
!,
! & +,
The covariance matrix of the two data sets can then be obtained as:
- ) ."
!,
!,
!%
& +,
/ ! 0 . ."
!,
!,
!%
&/
!0
&
Using the singular valued decomposition (SVD) of the matrix :
- 1. 2. 3
The rotation matrix
4
is obtained by:3. 1
&The translation matrix can be easily found by
substituting the two centroid points ! and ! in
place of the data set matrices and in
/ . !
!
Using and obtained from the above procedure proceed with the following steps to enhance the set of 3D cloud points:
• given the point cloud of the base image
(the first frame in the sequence) iterates on all point cloud points
o multiply the current point
coordinates with and save the new coordinates
o multiply the current point
coordinates with and save the new coordinates
• at the end of iterations the new coordinates
for the 3D point cloud are obtained
• repeat the above procedure on all point
clouds for each image. Since the
correspondence between scenes is known, the points can be tracked easily.
o in each iteration, the new 3D
points are added to the basic 3D point cloud
• finally, the whole 3D point cloud of the
whole scene is obtained.
Notice that combining and depends on the
camera viewpoint since and multiplication is
not commutative. So attention should be paid to the order of transformation.
7. SCENE AUGMENTATION
In general, the scene augmentation is used to augment a specific object in the scene by a given texture. The augmentation process involves two main steps. The first step is to generate 2D frames with known viewpoints (to facilitate identification of the object position in the scene). The second step is to use color filter to identify the object with a specific color.
7.1. Generating 2D Frames
The 3D point cloud of the whole scene is used to generate 2D frames. The frames are created by using the following steps
• get the first frame of the frame sequence
• use and obtained in section 6 to
calculate the viewpoint position.
• gets the convex hull of the projection view
assuming (perspective viewing). This step is explained in detail in section 5.
• apply the projection for each point to get
its x-y position on the camera plane.
7.2. Object Identification Using Color Filter
First, the features of the reference frame are extracted and compared with those of the
[image:4.595.306.510.364.517.2]subsequent frames. Proper selection of the features of great importance for efficient matching. The SIFT feature extraction [11] concentrates only on the high frequency areas in the image. It considers the object with the background as a low frequency region and hence, cannot detect them. Color descriptors are more efficient in extracting objects in our case. The frame is clustered by using color filters. Good results are have been obtained with color based K-means clustering as shown in Figure 3. Only one of the clusters is shown in the Figure.
Figure 3: Clustering The Scene Depending On Colors; k-means Clustering Is Used.
7.3. Object Augmentation
The main role of the previous steps was to segment the regions according to the color of the objects. The next step is to augment the identified objects with the given texture. The augmentation process involve two basic operations. First, the features of each region segment such as Area, Orientation Major and Minor axes lengths are extracted. Second, the texture image is resized to fit on the identified object. The Major and Minor axes lengths are used to determine the correct texture image size. The texture image has to be rotated to have the same orientation of the object.
8. 3D SCENE MANIPULATION
scene are inspected to determine the color intensity
for each object in the scene. Lambertian reflectance model is assumed. This means that the object brightness remains unchanged if the viewing direction is changed and hence, the object can be seen from a different view angles with the same brightness. Finally, the trajectory interpolation is used to obtain scene smoothness.
8.1 Lambertian Reflectance
[image:5.595.100.273.375.478.2]Lambertian reflectance is a property for the material that defines its ideal reflectance. The surface brightness appears homogenous when viewed from different view angles. It is extremely hard to occur that all surfaces follow the Lambertian reflectance assumption. For example, the unfinished wood can easily be represented by Lambertian reflectance while the wood covered with paint can cause multiple specular highlights which create different reflectance characteristics of the material as shown in Figure 4.
Figure 4: Reflectance And Viewing Parameters
Light source intensity will vary according to many parameters such as the viewing direction, the surface material and the illumination.
8.2 Creating Objects, Adding Them To The Scene
Objects can implemented by representing them as point clouds. Each point can itself be viewed as a tiny sphere with its associated characteristics, such as color, coordinates and material properties. For example to draw a sphere by that method, first, a big sphere (just its x-y-z coordinates) is created. Then, on the surface of that sphere (which is not visible), tiny spheres are drawn by using spherical coordinates. The process can be summarized in the following steps:
Step 1: get x- y-z coordinates for the surface of the sphere .
Step 2: convert to spherical coordinates.
Step 3: use the azimuth and elevation angles to
draw small tiny spheres on the surface created by the big sphere in the previous step.
Step 4: assign color for each small sphere
(Lambertian reflectance model is considered). Referring to Figure 5, the Lambertian function can be calculated as
Lambertian function BDC
Where BC is the surface albedo.
Step 5: calculate surface radiance by the
following formula
Surface radiance G BD H cosC BD H JKL . MLC
where is the angle between the surface normal and the light source direction and H is the source intensity.
Step 6: according to the above, radiance changes
the color intensity of the points of the cloud. For each point in the scene the color will be different; since JKL and ML are different for each point.
Other objects (such as lines, planes, etc.) are manipulated in the same manner. The Lambertian reflectance model is applied on each point of the object.
8.3 Scene Manipulation
In this section, scene manipulation is considered. An object such as a plane or a sphere is inserted in the scene. The approach is to search for specific objects in the scene and then insert, as an example, a plane or a sphere on or beside them.
8.3.1 Insertion of simple Lambertian objects
The new objects can be inserted into the scene. The following preliminaries are considered when inserting objects
• The object to be inserted may be occluded
with another object in the scene, i.e. there is a scene object between the viewpoint and the inserted object.
• If the objects are moving, collision
detection algorithm must be considered. For simplicity, we are not going to insert a moving object.
scene have to be removed. This process makes it
not feasible to do scene manipulation.
Instead, the required object is located by finding a group of points with common properties. For example, a table surface is characterized by similar normals for its points. In general, all points of a plane are similar. The approach is to divide the points with similar normals into groups and sort the groups according to the number of points in each group. The group representing the table plane is one of the largest groups. However, since large groups may correspond also to some irrelevant objects such as a wall or other large parts of the scene, some trial iterations should be done before recognizing the correct suitable object.
8.3.2 Scene and trajectory interpolation
After creating the scene frames, the scene can be made smoother by increasing the number of frames. To achieve this goal, trajectory interpolation is applied to the 3D scene. For example, A 100 frames can be increased to 200 frames by inserting a new frame between each couple of frames. The inserted frame is obtained by using interpolation of the neighboring frames. The basic idea is similar to that is used in making cartoon movies where interpolation frames are inserted to smooth the motion of bodies( see Figure 5). As shown in Figure 5, the inserted frame is obtained by getting the average coordinates for each point in frame #2 and its corresponding point in frame #3.
Figure 5: Inserting New Key-frames Need Some Calculations
[image:6.595.298.516.72.245.2]In the above illustrations, it can be noticed that two frames containing the motion of human body are considered. Interpolation is the intermediate step between rendering the two frames. This intermediate step results in a more smooth animation flow between the two frames (frame #1 and frame #3). The resulting scene frames from bilinear interpolation is shown in Figure 6.
Figure 6: Key-frame Interpolation
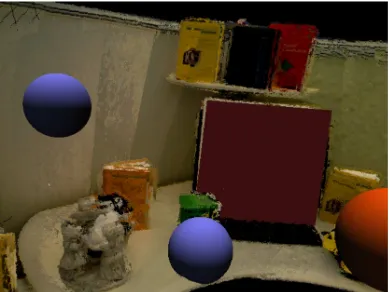
[image:6.595.317.512.337.483.2]The resulting frames can be more increased until reaching a very smooth scene viewing. Figure 7 shows the reconstructed scene after smoothing process.
Figure 7: The Scene With The Inserted Spheres And Planes
9. RESULTS AND DISCUSSION
9.1 Depth Map
The image dataset used in the experiment is shown in Figure 1. The image sequence in Figure 1(a) is taken by a moving un-calibrated camera. The camera is focused on the scene for the purpose of the reconstructing it. The scene contains a collection of objects such as check board, toy and three books.
[image:6.595.89.290.485.614.2]white. The gray intensities between the heavy black
and white represent different depths.
9.2 Color Based K-means Clustering
The k-means clustering is applied for image 001
and the results are shown in Figure 3. The figure
[image:7.595.116.516.207.537.2](a) (b)
Figure 9: The Depth Map For Frame 2 Of The Scene (a) The Original Image (b) Depth Map
shows three identified clusters for image 001. Each cluster is represented by an image. The resulting K-means clusters contain background objects and
[image:7.595.302.515.594.649.2]book objects. A separation technique is employed to separate the correct cluster which is the one to the right in Figure 3.
Figure 10: The Three Clusters For A Single Scene.
[image:7.595.87.293.594.684.2]For example, finding the yellow and orange
brightness colors in LAB color space is done by searching for the required color in the book covers. The resulting segmented images with regions representing each book are shown in Figure 11. A morphology filter is applied on the left image in Figure 11 to remove the small none suitable regions.
Figure 11: Books Ssegmented (Right) With Their Corresponding Regions(Left).
9.3 Object Augmentation Results
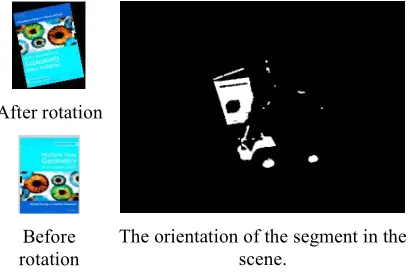
The results for augmenting the book cover into the scene are shown in Figure 12. The scene is segmented by using Connected Component Analysis (CCA). The orientation of the region which represents the book is obtained (it can be noticed from Figure 12 that small regions with specific threshold can be discarded. CCA, mainly the area, the aspect ratio, and the orientation are all calculated. For example, the orientation of the book in Figure 12 is 102 degrees. The orientation is a measure for the angle between - axis and the book’s major axis. After calculating the orientation, the rotation transformation is applied on the book cover image to obtain the rotated cover image with the same orientation of the segmented book region.
After rotation
The orientation of the segment in the scene.
[image:8.595.288.517.72.210.2]Before rotation
Figure 12: Preparing The Book Cover For Augmentation
(a) (b)
Figure 13: The Scene Sequence (a) The Original Scene (b) The Augmented Scene
[image:8.595.89.289.223.295.2]The second part of the experiment is to use major and minor axis to determine the resizing transformation required to make the original book image similar to the segmented region. The resulting scene after augmentation is shown in Figure 13.
10. CONCLUSION
A new technique has been proposed for reconstructing and augmenting 3D scene form multiple images. The scene is reconstructed by simple correspondence with CCA for segmentation. Then, the scene frames are analyzed by using LAB color space to extract segments with specific color. Segments with the required colors are detected and then augmented by predefined image (book cover in
our experiments). The reconstruction and
augmentation technique proposed in this paper has shown promising results and is opening new research trends to focus on fully featured and colored 3D reconstruction.
REFRENCES:
[1] M. J. Carlotto “Shape from Shading”, website
content http://www.newfrontiersinscience.com
/martianenigmas/Articles/SFS/sfs.html ; last updated Oct. 15, 2006.
[2] A. M. Loh “The recovery of 3D structure using visual texture patterns” ,PhD thesis, February 2006.
[3] H. Cantzler “An overview of shape-from-motion”, School of Informatics University of Edinburgh, 2003.
[4] H. Koo and C. Jeong, “An Area-Based Stereo Matching Using Adaptive Search Range and Window Size”, Department of Electronics Engineering, Korea University, Korea, 2001. [5] K. Han, K. W. Song, E. Chung, S. Cho, Y. Ha,
“Stereo matching using genetic algorithm with adaptive chromosomes “, School of Computer
and Software engineering Kumoh Nat'l
[image:8.595.91.296.522.659.2][6] R. kimmel, "3D Shape Reconstruction from
Autostereograms and Stereo", Computer
science department, Technion, Haifa 32000, July 13 2000.
[7] Kyu-Phil Han, Tae-Min Bae, Yeong-Ho Ha, " Hybrid stereo matching with new relaxation scheme of preserving disparity discontinuity", School of Electronics and Electrical Eng. [8] Earth Sciences Sector of Natural Resources,
Canada, and Information available at their website http://ess.nrcan.gc.ca/index_e.php, Last updated 2006.
[9] C. Baillard, H. Maitre, " 3D Reconstruction of Urban Scenes from Aerial Stereo Imagery: A Focusing Strategy" ENST, Department TSI, Paris, France, 1999.
[10] J. A. Hartigan and M. A. Wong, "Algorithm AS 136: A K-Means Clustering Algorithm", Journal of the Royal Statistical Society, Series C 28 (1) pp. 100–108.
[11] D. Lowe. “Object recognition from local scale invariant features.” In Proc. ICCV, pages 1150–