GENERALIZED DISCRETE FOURIER TRANSFORM BASED
IMPROVEMENT OF PARTIAL TRANSMIT SEQUENCE
SCHEME TO REDUCE PAPR IN OFDM SYSTEMS
1
AHMED M. ELSHIRKASI, 2 MOHAMMAD UMAR SIDDIQI, 3 MOHAMED HADI HABAEBI
1, 2, 3Department of Electrical & Computer Engineering, Faculty of Engineering
International Islamic University Malaysia (IIUM)
E-mail: [email protected] , [email protected] ,
ABSTRACT
Future applications of communication systems require higher data rates and more mobility. Orthogonal frequency division multiplexing (OFDM) can achieve these goals due to it is ability to reach high bit rates over fading channels as well as its efficient utilization of the bandwidth. However, the transmitted signal of OFDM suffers from high peak to average power ratio (PAPR). Such signals require high power amplifier (HPA) of large dynamic range to amplify the whole transmitted signal without distorting it. This paper gives the results of a study on the effect of applying the nonlinear phase of generalized discrete Fourier transform (GDFT) theory on the performance of partial transmit sequence (PTS) which is one of proposed techniques to mitigate high PAPR of OFDM signal. This has been done by modifying the phase of data symbols in each OFDM block before PTS is applied. Simulation results show that the proposed scheme requires half the number of sub-blocks to achieve the same amount of PAPR reduction compared with the original PTS scheme.
Keywords: Generalized Discrete Fourier Transform, OFDM, PAPR, CCDF, PTS
1. INTRODUCTION
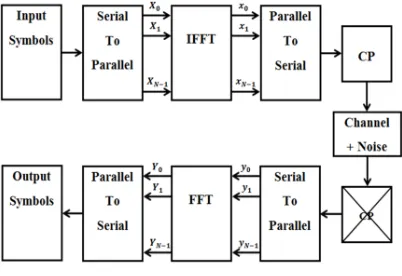
The fundamental principle of OFDM is to split the allocated frequency band of the system into many orthogonal, parallel and overlapping narrow sub-bands. Each narrow sub-band carries data at low rate. The advantage of this way over the use of the whole spectrum as one band is that time duration of bit transmitted over narrow sub-bands becomes longer which makes the transmitted signal less damaged by effects of wireless propagation environment such as inter symbol interference (ISI) that is caused by multi-paths of wireless channel. Furthermore, each narrow sub-band experiences a flat fading portion from the spectrum which decreases the equalizer complexity required at the receiver. Cyclic prefix (CP) which is guard interval is inserted between adjacent transmitted OFDM blocks to mitigate interference resulting from multipath components of wireless channels. The receiver discards this CP part which contains the interference influence. In addition, Fast Fourier Transformation FFT is used to build the
[image:1.595.306.507.523.661.2]orthogonality in OFDM system and to implement it efficiently [1]. The main blocks of OFDM system is shown in Figure 1.
Figure 1: Block Diagram of OFDM System
amplifiers of high dynamic range to amplify them
without causing distortion. Such amplifiers consume the battery of the device quickly as well as adding more complexity to the system design [2].
2. PAPR OF OFDM SIGNAL
OFDM transmitted signal is composed of many signals, that are carried by subcarriers separated by equal frequency spaces. The mathematical representation of the OFDM signal of subcarriers in complex baseband is as follows:
(1)
where is the data symbol, B is the total allocated bandwidth, is the bandwidth of each subband. The mathematical representation of PAPR is defined as [3]:
max | |
!"| | # (2)
where E is the expected value. NL equidistant samples are taken from equation 2 to find the discrete representation of PAPR, $ is known as the oversampling factor. It is shown that L = 4 is a good value to have accurate results of PAPR for simulation purposes [2]. Discrete version of Equation 2 has the following mathematical form:
%& max |%!"|% &|
&| # (3)
where 0 ( ) ( $ * 1, and E denotes the expectation.
Various methods and ideas are suggested to mitigate high PAPR value of OFDM signals. Complementary cumulative distribution function (CCDF) is the mathematical tool usually used in literature as metric when simulating PAPR reduction techniques. CCDF gives the probability that OFDM transmitted signal has PAPR value upper than a certain threshold [4].
3. PARTIAL TRANSMIT SEQUENCE PTS:
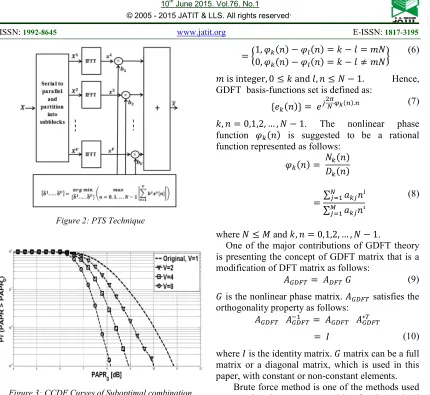
PTS technique divides the input OFDM block, which contains data symbols, into V disjoint subblocks where , ( . N-point IFFT operation applied on each subblock. Each output of the parallel IFFT operations is weighted with a phase factor to give minimum PAPR for transmission. PTS technique is shown in the block diagram of Figure 2. The weights used to shift the output of each IFFT operation are selected from a finite set of phase complex values. These phase complex values
are commonly chosen from the set "*1, 1, ., *.#. A special case of PTS technique known as suboptimal combination is used in this paper. The phase factors in this algorithm are chosen from two value only, i.e. set "1, *1#. This algorithm works as follows [1, 2]:
Step 1: input OFDM block is divided into , subblocks.
Step 2: IFFT of size is taken for each subblock.
Step 3: all phase factors are set to be 1 and PAPR is calculated and set as PAPR_min.
Step 4: the phase factor is switched from 1 to -1 for the second subblock and the new PAPR is calculated. If the new PAPR is less than PAPR_min
/ is kept as -1 and PAPR_min is changed to the new PAPR. Otherwise PAPR_min and / are kept as in step 3.
Step 5: same calculations are repeated with other subblocks.
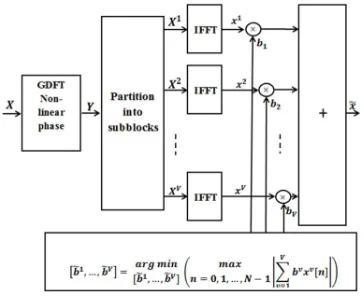
Suboptimal combination algorithm has been simulated, the CCDF curves of the result is shown in Figure 3 with OFDM block size 256 and QPSK modulation scheme. Simulation result shows that more PAPR reduction is achieved by increasing the number of sub-blocks,. However, more sub-blocks , require more IFFT operations as well as more phase factor optimization process. In this work, the phase of the input block is modified in a way that leads to reduce the number of the subblocks , for the same amount of PAPR reduction achieved by original PTS.
4. GENERALISED DISCRETE FOURIER TRANSFORM WITH NONLINEAR PHASE
Figure 2: PTS Technique
Figure 3:CCDF Curves of Suboptimal combination algorithm, N=256, QPAK. V= 1,2,4,8
By starting from the basis function of traditional DFT of the form [5, 6 and 7]:
& 3 &4
3, ) 0,1,2, … , * 1 (4)
GDFT theory suggests rewriting the kernel in Equation 4 as follows:
& 3 ≜ 784 .4 (5)
where :& 3 is the nonlinear phase function. GDFT preserves the orthogonality condition, which is the main property of GDFT, as follows:
1 & 3 ;∗ 3
4
1 =784 7>4 ?.4
4
@1, :& 3 * :; 3 ) * A B
0, :& 3 * :; 3 ) * A C B D
(6)
B is integer, 0 ( ) and A, 3 ( * 1. Hence,
GDFT basis-functions set is defined as:
" & 3 # 784 .4 (7)
), 3 0,1,2, … , * 1. The nonlinear phase
function :& 3 is suggested to be a rational function represented as follows:
:& 3 M& 3
& 3
∑ O& 3P
∑ OR & 3Q
(8)
where ( S and ), 3 0,1,2, … , * 1.
One of the major contributions of GDFT theory is presenting the concept of GDFT matrix that is a modification of DFT matrix as follows:
TUVW UVW X (9)
X is the nonlinear phase matrix. TUVW satisfies the orthogonality property as follows:
TUVW TUVW TUVW TUVW∗W
Y (10)
where Y is the identity matrix. X matrix can be a full matrix or a diagonal matrix, which is used in this paper, with constant or non-constant elements.
Brute force method is one of the methods used to scan the phase space searching for the optimal nonlinear phase diagonal for the matrix G in (9). This can be done by representing :& 3 in (5) as a polynomial of two terms as follows:
:& 3 O& 3P8Z[ O& 3P8\ (11)
By putting O& ) and /& 0, Equation 11
becomes:
:& 3 ) [ O& 3P8\ (12)
GDFT complex time series can be rewritten now
as:
& 3 &4 =]8\4^8\_Z? (13)
), 3 0,1, … , * 1. In Equation (13), the first
complex exponential term of the linear phase is the kernel of traditional DFT while the second complex exponential term is the non-linear phase of GDFT. Different combinations from coefficients O& and
/& in equation 12 give different nonlinear phase
[image:3.595.89.292.332.461.2]nonlinear phase according to certain criteria is
chosen. Binary representation of the two coefficients O& and /& is used to define the search resolution of the phase space. The search step resolution is defined as follows:
∆]8\,P8\ 2a
(14)
where B indicates to the number of bits used to represent each nonlinear phase coefficient. In this paper, O& is assumed to be 1 to simplify the phase search process, so the different nonlinear phase vectors are generated by changing the coefficient
/& which is given by the symbol /.
5. PROPOSED SCHEME
In this proposed scheme, the phase of each data symbol in the OFDM block is modified using the corresponding phase element in nonlinear phase vector generated according to GDFT theory. PTS is applied after this phase modification. Changing the phase of the data symbols in the OFDM block decorrelate theses symbols so when IFFT operation is applied on them the probability of producing high peaks is reduced that results in a reduction in the overall PAPR of transmitted signal. The process in this proposed scheme is done by multiplying the OFDM input block bcby several diagonal matrices [image:4.595.307.506.472.628.2]
M . This multiplication produces the phase-modified input vector de where 1 ( ( 2a,B is the number of bits used to represent the phase coefficient as in Equation 14. The best modified input vector among 2a is chosen to be partitioned for PTS technique. The process is shown in the block diagram of figure 4.
Figure 4: Block Diagram of the Proposed Scheme
The phase space is scanned by brute force method to find the optimal nonlinear phase vector that uses diagonal matrices M. The optimal diagonal is selected among 2a possible ones
according to autocorrelation property of vectors de. Autocorrelation function is represented by the relation [6]:
ff g h )
&
h∗ ) [ g
(15)
The resulting vector ff g is compared with the impulse function which is the result of ideal autocorrelation represented as follows:
ffQi]; g jk (16)
The optimal nonlinear phase which gives closest autocorrelation value to the impulse is selected from the mean square error relation. The algorithm is summarized in the following steps:
Step 1: the input OFDM block of data symbols is multiplied by 2a diagonal matrices to modify the phase of data symbols and produce vectors l. Step 2: the auto correlation function mnmn is calculated for each l.
Step 3: the auto correlation function mnmn is compared with the an impulse in means of mean square error to produce oapi.
Step 4: the phase that gives minimum oapi is chosen as optimal phase
Step 5: PTS is applied on the phase-modified block results from step 4.
[image:4.595.99.281.532.680.2]The block diagram of selecting optimal nonlinear phase is shown in figure 5.
Figure 5: Selecting the Optimal Nonlinear Phase
6. SIMULATION AND RESULTS
Table 1: Simulation Parameters
Number of side information bits
B
2,3,6
Size of OFDM 64
Modulation scheme
16 QAM
Number of transmitted blocks
120,000
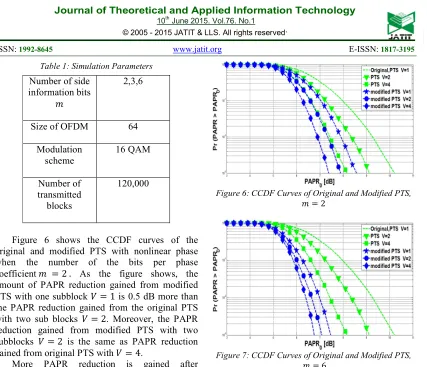
Figure 6 shows the CCDF curves of the original and modified PTS with nonlinear phase when the number of the bits per phase coefficient B 2 . As the figure shows, the amount of PAPR reduction gained from modified PTS with one subblock , 1 is 0.5 dB more than the PAPR reduction gained from the original PTS with two sub blocks , 2. Moreover, the PAPR reduction gained from modified PTS with two subblocks , 2 is the same as PAPR reduction gained from original PTS with , 4.
More PAPR reduction is gained after increasing the value of B to 6. Figure 7 shows that the modified PTS with one subblock , 1 gives 0.5 dB PAPR reduction more compared with the original PTS with four sub-blocks , 4. The modified PTS scheme, with , 4, adds around 0.5dB additional PAPR reduction. However, this improvement in the performance of modified PTS in terms of PAPR reduction vs. the number of sub-blocks, comes at expense of finding the optimal nonlinear phase vector by brute force method.
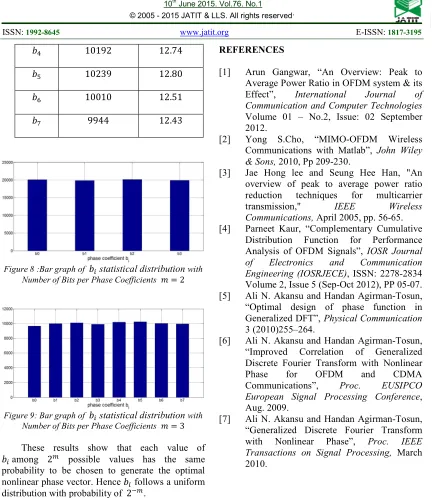
Last result in this section is about the statistical distribution of the coefficient / that is used to generate the nonlinear phase, where i ∈
"0, 1, … , 2a* 1#.Results are listed in tables 2 and
3 with corresponding bar graphs in figures 8 and 9 for number of bits per phase coefficient B 2 and 3 respectively.
Figure 6: CCDF Curves of Original and Modified PTS, B 2
Figure 7: CCDF Curves of Original and Modified PTS, B 6
[image:5.595.315.507.453.740.2]
Table 2: Statistical Distribution of / when B 2
/ Times of
selecting /
%
/ 30159 25.13
/ 29771 24.81
/ 30258 25.22
/x 29812 24.84
Table 3: Statistical Distribution / when B 3
/ Times of
selecting /
%
/ 9655 12.07
/ 9984 12.48
/ 10089 12.61
/y 10192 12.74
/z 10239 12.80
/{ 10010 12.51
[image:6.595.86.519.83.581.2]/| 9944 12.43
Figure 8 :Bar graph of / statistical distribution with Number of Bits per Phase Coefficients B 2
Figure 9: Bar graph of / statistical distribution with Number of Bits per Phase Coefficients B 3
These results show that each value of
/ among 2a possible values has the same probability to be chosen to generate the optimal nonlinear phase vector. Hence / follows a uniform distribution with probability of 2 a.
7. CONCLOSION AND FUTURE WORK
The nonlinear phase from the theory of generalized discrete Fourier transform has been used in this paper to decorrelate the data samples of input OFDM block before applying PTS algorithm. Simulation results show that phase-modified OFDM block needs less number of sub- blocks , to reduce PAPR with the same amount compared with the original PTS. In addition, the coefficient / follows a uniform distribution. Future work could study other mathematical functions to generate the nonlinear phase as well as other methods to find the optimal nonlinear phase vector.
REFERENCES
[1] Arun Gangwar, “An Overview: Peak to Average Power Ratio in OFDM system & its Effect”, International Journal of Communication and Computer Technologies
Volume 01 – No.2, Issue: 02 September 2012.
[2] Yong S.Cho, “MIMO-OFDM Wireless Communications with Matlab”, John Wiley & Sons, 2010, Pp 209-230.
[3] Jae Hong lee and Seung Hee Han, "An overview of peak to average power ratio reduction techniques for multicarrier transmission," IEEE Wireless Communications, April 2005, pp. 56-65. [4] Parneet Kaur, “Complementary Cumulative
Distribution Function for Performance Analysis of OFDM Signals”, IOSR Journal
of Electronics and Communication
Engineering (IOSRJECE), ISSN: 2278-2834 Volume 2, Issue 5 (Sep-Oct 2012), PP 05-07. [5] Ali N. Akansu and Handan Agirman-Tosun, “Optimal design of phase function in Generalized DFT”, Physical Communication
3 (2010)255–264.
[6] Ali N. Akansu and Handan Agirman-Tosun, “Improved Correlation of Generalized Discrete Fourier Transform with Nonlinear
Phase for OFDM and CDMA
Communications”, Proc. EUSIPCO European Signal Processing Conference, Aug. 2009.