ISSN: 1992-8645 www.jatit.org E-ISSN: 1817-3195
OPTIMAL LOCATION OF FACTS DEVICES FOR POWER
QUALITY ISSUES USING PSO AND BAT ALGORITHM
1S.BALASUBRAMANIYAN, 2T.S.SIVAKUMARAN
1
Assistant Professor, Department of EEE, Mailam Engineering College, Mailam, INDIA 2
Professor& Dean, Department of EEE, Arunai College of Engineering, Tiruvannamalai, INDIA E-mail: [email protected] , [email protected]
ABSTRACT
This paper proposes an optimal location of FACTS devices in power system using Evolutionary algorithms. Using the proposed method, the location of FACTS controllers, their type and rated values are optimized simultaneously. From the FACTS family, series device Thyristor Controlled Series Compensator (TCSC), Shunt device Static Compensator (STATCOM) and series and shunt device Unified Power Flow Controller (UPFC) are considered. The proposed algorithms are very effective methods for the optimal choice and placement of FACTS devices to improve the power quality of power systems. The proposed algorithm has been applied to IEEE -30 bus system.
Keywords: Bat Algorithm, FACTS devices, Optimal location, PSO algorithm, Power Quality.
1. INTRODUCTION
Power quality is “the provision of voltages and system design in such a way that the electric energy is utilized from the distribution side successfully without interference or interruption.” Power quality is the most important concerned area of electric power system. The insufficient quality of power output sometimes leads to complete shut-down of the industries which provides a major economic loss to the industries and consumers [1]. In recent years, with increasing in development of power grids, the economical operation of power system is more considered. Because of deregulation and restructuring of the power markets use of Flexible AC Transmission Systems (FACTS) devices are inevitable. The maximum capability of power systems can be exploited by means of FACTS devices. Nowadays, development of power electronics devices causes reduction in the cost of FACTS and therefore application of FACTS devices especially in distribution networks is more economical. Because of the economic considerati-ons, installation of FACTS controller in all of the buses or the lines is impossible and unnecessary. There are numerous methods for finding optimal locations of FACTS devices in power system [2-3].
In this paper a new algorithms has been proposed to optimally locate the FACTS devices in power systems. Finding the best place for FACTS devices are performed using Bat and PSO algorithms. The IEEE-30 bus system has been used
to test the proposed algorithms. FACTS (Flexible AC Transmission system) provide the power quality solutions to the utility and Consumer end. The potential benefits of FACTS devices are now widely recognized by the power system engineering community [4]. In recent trends Flexible Alternating Current Transmission system (FACTS) is the term used for complex controllability in power system by means of power electronics devices. FACTS devices are used for various applications in worldwide to avoid cost intensive of power systems.
FACTS devices are provide a better solutions for various conditions and improve power quality problems. The effect of FACTS devices are activated through switches or controlled shunt compensation, or phase shift control. Figure 1. Shows the overview of FACTS devices. The shunt are primary for compensation of reactive power with effect of voltage control. The series devices are compensating reactive power with their influence on the effective impedance, stability and power flow.
2. CONFIGURATION OF FACTS DEVICES
FACTS CONTROLLER
Shunt Controllers Combined Series and Shunt Controllers
• Unified Power Flow Controller (UPFC) • Thyristor
Controlled Phase Shifting Transformer (TCPST)
• Inter line Power Flow Controller (IPFC)
Combined Series and Series Controllers Series Controllers
• Static Synchronous Series Comparator (SSSC)
• Thyristor Controlled Series Capacitor (TCSC) • Thyristor Switched Series
Capacitor (TSSC)
• Thyristor Controlled Series Reactor (TCSR)
• Thyristor Switch Series Reactor (TSSR)
• Static Synchronous Compensator (STATCOM) • Static Synchronous Generator
(SSG)
• Battery Energy Storage System (BESS)
• Super Conducting Magnetic Energy Storage (SMES)
• Static VAR Compensator (SVC)
• Thyristor Controlled Reactor (TCR)
• Thyristor Switched Reactor (TSR)
• Thyristor Switched Capacitor (TSC)
• Static VAR Generator or Absorber
[image:2.595.188.496.81.317.2]• Inter line Power Flow Controller (IPFC)
Figure 1: Overview Of FACTS Devices
First it increase the damping ratio when large systems are connected. Second it overcome the Sub Synchronous Resonance (SSR) problems, TCSC has the capability of high speed switching mechanism for transmission power flow, which allows load increment of existing transmission systems and allows for rapid readjustment of power flow at various circumstances. The TCSC regulate steady state power flow within its rating limits. Figure 2. Shows the configuration of Thyristor Controlled Series Capacitor (TCSC) [5].
V
SCR 2 SCR 1 L
iL
[image:2.595.88.293.105.295.2]is ic C
Figure 2: Configuration Of A TCSC
2.2 Static Compensator (STATCOM)
Static Var Compensator (SVC) with Voltage Source Converter (VSC) structured as Static Compensator (STATCOM). STATCOM has similar characteristics like synchronous condenser but it has superior to the synchronous condenser in several ways such as low cost investment, low operating cost, low maintenance and better dynamics. The STATCOM is built with thyristor like GTO or IGBTs. The structure of STATCOM is shown in Figure 3. The reactive power provision is independent from the actual voltage is the advantage of STATCOM, this means during severe circumstances the STATCOM holds its full
capacity. The performance analysis of STATCOM for power quality problems can be much improved with the combination of real and reactive power [5].
+
V1
is
Figure 3: Structure Of STATCOM
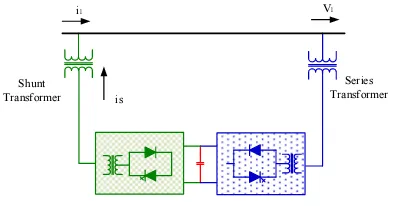
2.3 Unified Power Flow Controller (UPFC) A Unified Power Flow Conditioner (UPFC) is a combination of Static compensator (STATCOM) and Static Series Compensator (SSC). It plays the role of shunt compensation and voltage phase shifting respectively.
il
is
Vl
Shunt Transformer
[image:2.595.309.506.403.506.2]Series Transformer
Figure 4: Configuration Of An UPFC
The Unified Power Flow Conditioner (UPFC) have a series and shunt transformer connected through double voltage source converters with common DC link. The DC circuit permits the real power exchange between series and shunt transformer to control the phase shift of series voltage. The structure is shown in Figure 4, it provides the full control for voltage and power flow. The series converter requires to protect a thyristor bridge. Due to the presence of VSC and protection, an UPFC is getting relatively more expensive, which limits the practical applications where the voltage and power flow control is preferred [5].
3. MODELING OF FACTS DEVICES
3.1 Modeling of TCSC
[image:2.595.95.288.452.568.2]transmit-ISSN: 1992-8645 www.jatit.org E-ISSN: 1817-3195
ssion line. The equivalent circuit of TCSC as shown
in Figure 5. TCSC is modelled by changing transmission line reactance. Hence the compen-sation values varies from -0.7 Xline to 0.2 Xline as mentioned below,
[image:3.595.334.488.166.423.2]Bus i Bus j
Figure 5: Equivalent TCSC structure
TCSC line
ij X X
X = + (1)
line TCSC
TCSC
X
X
=
γ
+
(2)Where Xline is the reactance of transmit-ssion line and γTCSC is the compensation factor of TCSC [5].
3.2 Modeling of STATCOM
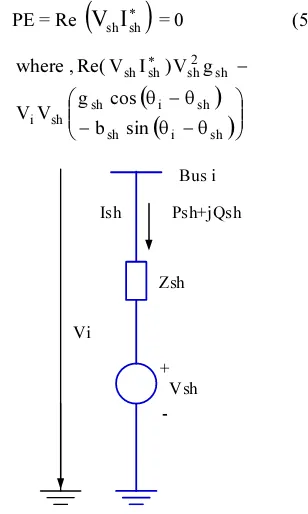
A STATCOM is a shunt compensating device used to control transmission voltage and reactive power control as shown in Figure 3. In ideal steady state analysis, it can be assumed that the real power exchange between the system and the STATCOM device can be ignored, and only the reactive power can be exchanged between system and control device.
Figure 6. Shows the equivalent circuit of STATCOM. In the derivation, it is assumed that (a) harmonics generated by the STATCOM are neglected; (b) the system as well as the STATCOM are three phase balanced. Then the STATCOM can be equivalently represented by a controllable fundamental frequency positive sequence voltage source Vsh. In principle, the STATCOM output voltage can be regulated such that the reactive power of the STATCOM can be changed.
From Figure 6, suppose Vsh= Vsh∠θsh, Vi = Vi∠θi, then the power flow constrains of the STATCOM are,
(
)
(
)
θ − θ +
θ − θ −
=
sh i sh
sh i sh sh i sh 2 i sh
sin b
cos g V V g V
P (3)
(
)
(
)
θ − θ −
θ − θ −
− =
sh i sh
sh i sh sh i sh 2 i sh
cos b
sin g V V b V
Q (4)
Where gsh + jbsh = 1/ Zsh
The operating constraint of the Static Compensator (STATCOM) is the real power exchange through the DC-link as,
PE = Re
(
V
shI
∗sh)
= 0 (5)(
)
(
)
θ − θ −
θ − θ
−
∗
sh i sh
sh i sh sh i
sh 2 sh sh sh
sin b
cos g V V
g V ) I V Re( , where
Vi
Ish Psh+jQsh Bus i
Zsh
Vsh +
-Figure 6: STATCOM Equivalent Circuit
In Reactive power control mode, the STATCOM generated reactive power is controlled by reactive power injection reference. Mathematically, such a control constraint is described as follows:
0
Q
Q
sh−
Specsh=
(6) Where QshSpec is the specified reactive power injection control reference. Qsh, which is given in equation 4, is the actual reactive power generated by the STATCOM [5].3.3 Modeling of UPFC
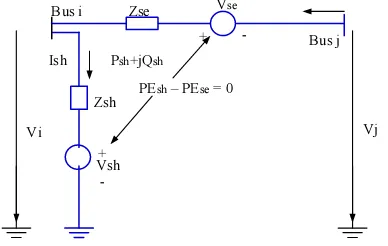
[image:3.595.89.293.194.317.2]The basic operating principle diagram of an UPFC is shown in Figure 4 [6]. The UPFC consists of two switching converters based on VSC valves. The two converters are connected by a common DC link. The series inverter is coupled to a transmission line via a series transformer. The shunt inverter is coupled to a local bus i via a shunt-connected transformer. The shunt inverter can generate or absorb controllable reactive power, and it can provide active power exchange to the series inverter to satisfy operating control requirements.
Vi
Ish Psh+jQsh Bus i
Zsh
Vsh+
-Zse Vse
+ - Bus j
[image:4.595.93.287.260.383.2]Vj PEsh –PEse = 0
Figure 7: UPFC Equivalent Circuit
For the equivalent circuit of the UPFC shown in Figure 7, suppose Vsh = Vsh∠θsh, Vse = Vse∠θse, Vi = Vi∠θI, Vj = Vj∠θj, then the power flow constraints of the UPFC shunt and series branches are, )) sin( b ) cos( g ( V V g V P sh i sh sh i sh sh i sh 2 i sh θ − θ + θ − θ − = (7) )) cos( b ) sin( g ( V V b V Q sh i sh sh i sh sh i sh 2 i sh θ − θ − θ − θ − − = (8) )) sin( b ) cos( g ( V V ) sin b cos g ( V V g V P se i ij se i ij se i ij ij ij ij j i ij 2 i ij θ − θ + θ − θ − θ + θ − = (9) )) cos( b ) sin( g ( V V ) cos b sin g ( V V g V Q se i ij se i ij se i ij ij ij ij j i ij 2 i ij θ − θ − θ − θ − θ − θ − − = (10) )) sin( b ) cos( g ( V V ) sin b cos g ( V V g V P se i ij se i ij se j ij ij ij ij j i ij 2 j ji θ − θ + θ − θ − θ + θ − = (11) )) cos( b ) sin( g ( V V ) cos b sin g ( V V g V Q se i ij se i ij se j ij ij ij ij j i ij 2 j ji θ − θ − θ − θ − θ − θ − − = (12)
Where gsh + jbsh = 1/ Zsh, gij + jbij = 1/ Zse, θij = θi - θj, θji = θj - θi.
The well-known independent active and reactive power flows control is,
0
P
P
Specji
ji
−
=
(13)0
Q
Q
ji−
Specji=
(14) Where PjiSpec is the specified active power flow control reference. QjiSpec is the specified active power flow control reference.4. PROPOSED ALGORITHMS
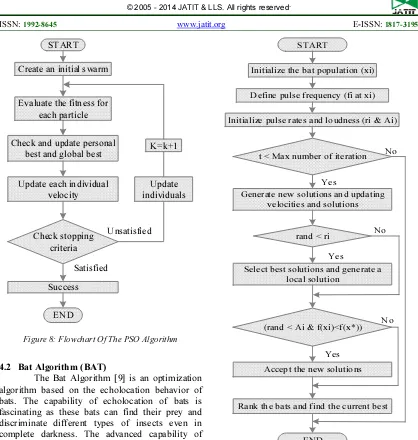
4.1 Particle Swarm Optimization (PSO)
A particle swarm optimization algorithm based on the behavior of individuals of a swarm developed by Kennedy and Eberhart [8]. Its roots are in zoologists modeling of the movement of individuals (i.e., fish, birds, and insects) within a group. It has been noticed that members of the group seem to share information among them to lead to increased efficiency of the group. The particle swarm optimization algorithm searches in parallel using group of individuals similar to other AI-based heuristic optimization techniques. Each individual corresponds to a candidate solution to the problem. Individuals in a swarm approach to the optimum through its present velocity, previous experience, and the experience of its neighbors. In a physical n-dimensional search space, the position and velocity of individual i are represented as the velocity vectors. Using these information individual i and its updated velocity can be modified under the following equations in the particle swarm optimization algorithm. The flowchart of the particle swarm optimization is shown in Figure 8.
) 1 k ( i ) k ( i 1 k
i
x
v
x
+=
+
+ (15)(
)
(
(k))
i gbest i i ) k ( i lbest i i k i 1 k 1 x x x x v v − β + − α + = + (16) Where, k iteration at i individual the is x(k)i k iteration at i s individual of velocity updated the is v(ik)
[0,1] between numbers random uniformly are ; i i β α i s individual of best individual the is xlbesti
ISSN: 1992-8645 www.jatit.org E-ISSN: 1817-3195
START
Create an initial swarm
Evaluate the fitness for each particle
Check and update personal best and global best
Update each individual velocity
Check stopping criteria
Success
END
Update individuals
K=k+1
Unsatisfied
[image:5.595.89.507.91.531.2]Satisfied
Figure 8: Flowchart Of The PSO Algorithm
4.2 Bat Algorithm (BAT)
The Bat Algorithm [9] is an optimization algorithm based on the echolocation behavior of bats. The capability of echolocation of bats is fascinating as these bats can find their prey and discriminate different types of insects even in complete darkness. The advanced capability of echolocation of bats has been used to solve different optimization problems. Echolocation of bats works as a type of sonar in bats, emits a loud and short pulse of sound, waits as it hits into an object and, after a fraction of time, the echo returns back to their ears . Thus, bats can compute how far they are from an object. In addition, this amazing orientation mechanism makes bats being able to distinguish the difference between an obstacle and a prey, allowing them to hunt even in complete darkness. Based on the behavior of the bats, Yang [9] has developed a new and interesting metaheu-ristic optimization technique called Bat Algorithm. Such technique has been developed to behave as a band of bats tracking prey/foods using their capability of echolocation. The flowchart of the Bat algorithm is shown in Figure 9.
ST ART
Initialize the bat population (xi)
Define pulse frequency (fi at xi)
Initialize pulse rates and loudness (ri & Ai)
t < Max number of iteration
Generate new solutions and updating velocities and solutions
Yes
rand < ri
Select best solutions and generate a local solution
(rand < Ai & f(xi)<f(x*))
Accept the new solutions
Rank the bats and find the current best
END
No
Yes
No
Yes
[image:5.595.94.290.112.414.2]No
Figure 9: Flowchart Of The Bat Algorithm
4.2.2 Bat algorithm idealized rules
1. All bats use echolocation to sense distance, and they also know the difference between food/prey and background barriers in some magical way. 2. Bats fly randomly with velocity vi at position xi with a fixed frequency fmin, varying wavelength λ and loudness A0 to search for prey. They can automatically adjust the wavelength (or frequency) of their emitted pulses and adjust the rate of pulse emission r ∈ [0,1] depending on the proximity of their target.
equations. The new solutions xit and velocities vit at time step t are given as,
(
max min)
mini f f f
f = + − (17)
(
)
i t i t1 i t
i v x x f
v ∗
− + −
= (18)
t i t
1 i t
i x v
x = +
− (19)
Where, β ∈ [0, 1] is a random vector drawn from a uniform distribution. Here x* is the current global best location (solution) which is located after comparing all the solutions among all the n bats. As the product λifi is the velocity increment, we can use either fi (or λi) to adjust the velocity change while fixing the other factor λi (or fi), depending on the type of the problem of interest. Initially, each bat is randomly assigned a frequency which is drawn uniformly from [fmin, fmax]. For the local search part, once a solution is selected among the current best solutions, a new solution for each bat is generated locally using random walk
t old
new X A
X = +∈ (20)
Where, ∈ ∈ [−1,1] is a random number, while
At =< Ait > is the average loudness of all the bats at this time step [10].
5. SIMULATION RESULTS
In this paper traditional newton raphson method is applied to find load flow analysis. In this approach MATLAB coding was required for simulation purpose. An IEEE 30 Bus test system is used for this paper. The test system consists of 3 generators and 3 synchronous condensers and 24 PQ bus (or load bus).The problem to be addressed consists of finding the optimal location (bus number) and corresponding rating / sizing of FACTS devices (power rating (MVA) of UPFC, STATCOM and Reactance value of TCSC). In this case the PSO and BAT Algorithm is employed. Excluding the Slack bus, the selection process performed among 40 line configurations / combinations. The purpose of optimization technique is to identify the effective location and determine the sizing of the corresponding FACTS device (TCSC, STATCOM and UPFC). Reactive power (Q) is considered as common cost function parameter for all FACTS devices considered for our test case along with their respective cost function (including Installation and maintenance charges).
Base case performance of 30 bus system is presented in table 1. The results for individual devise (TCSC, STATCOM & UPFC) performance
[image:6.595.321.493.216.600.2]for test case IEEE-30 bus system tabulated in table 2-7. The optimal sizing and location of proposed all FACTS devices performance has shown in figure 10.
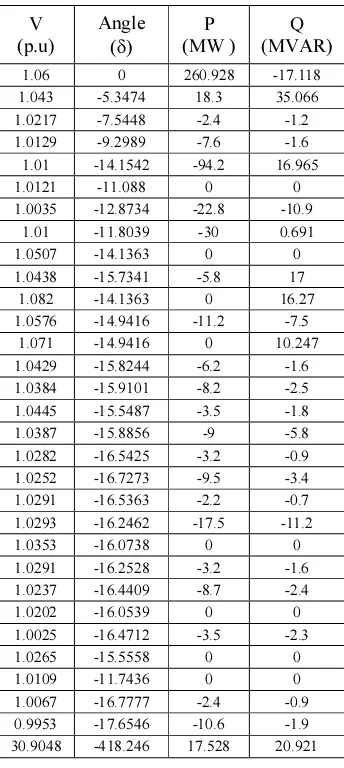
Table 1: Load Flow For IEEE-30 Bus System For Base Case.
V (p.u)
Angle (δ)
P (MW )
Q (MVAR)
1.06 0 260.928 -17.118
1.043 -5.3474 18.3 35.066
1.0217 -7.5448 -2.4 -1.2
1.0129 -9.2989 -7.6 -1.6
1.01 -14.1542 -94.2 16.965
1.0121 -11.088 0 0
1.0035 -12.8734 -22.8 -10.9
1.01 -11.8039 -30 0.691
1.0507 -14.1363 0 0
1.0438 -15.7341 -5.8 17
1.082 -14.1363 0 16.27
1.0576 -14.9416 -11.2 -7.5
1.071 -14.9416 0 10.247
1.0429 -15.8244 -6.2 -1.6
1.0384 -15.9101 -8.2 -2.5
1.0445 -15.5487 -3.5 -1.8
1.0387 -15.8856 -9 -5.8
1.0282 -16.5425 -3.2 -0.9
1.0252 -16.7273 -9.5 -3.4
1.0291 -16.5363 -2.2 -0.7
1.0293 -16.2462 -17.5 -11.2
1.0353 -16.0738 0 0
1.0291 -16.2528 -3.2 -1.6
1.0237 -16.4409 -8.7 -2.4
1.0202 -16.0539 0 0
1.0025 -16.4712 -3.5 -2.3
1.0265 -15.5558 0 0
1.0109 -11.7436 0 0
1.0067 -16.7777 -2.4 -0.9
0.9953 -17.6546 -10.6 -1.9
30.9048 -418.246 17.528 20.921
Table 2: Load flow using newton raphson method with TCSC for IEEE-30 bus system using PSO
TCSC for IEEE – 30 Bus system PSO Algorithm
V (in p.u)
Angle δ
P (MW )
Q (MVAR)
1.06 0 261.8579 -14.1716
1.045 -5.4278 18.3 55.721
[image:6.595.317.501.629.742.2]ISSN: 1992-8645 www.jatit.org E-ISSN: 1817-3195
0.9994 -9.1177 -7.6 -1.6
1.01 -14.2869 -94.2 20.5589
1.0032 -11.1004 0 0
0.9981 -12.9394 -22.8 -10.9
1.01 -11.9802 -30 27.9417
1.0323 -14.4511 0 0
1.011 -16.2482 -5.8 -2
1.082 -14.4511 0 25.8374
0.9763 -14.734 -11.2 -7.5
0.9273 -14.734 0 -32.4711
0.9666 -15.7829 -6.2 -1.6
0.9678 -16.0451 -8.2 -2.5
0.9828 -15.7881 -3.5 -1.8
0.9971 -16.3084 -9 -5.8
0.9701 -16.8999 -3.2 -0.9
0.9748 -17.187 -9.5 -3.4
0.983 -17.0199 -2.2 -0.7
0.9969 -16.7007 -17.5 -11.2
0.997 -16.678 0 0
0.9691 -16.6011 -3.2 -1.6
0.9799 -16.9388 -8.7 -6.7
0.9883 -16.5586 0 0
0.9701 -17.0037 -3.5 -2.3
1.0024 -16.0383 0 0
0.9995 -11.768 0 0
0.9821 -17.3211 -2.4 -0.9
0.9704 -18.2431 -10.6 -1.9
29.8632 -425.742 18.4579 18.9163
[image:7.595.90.513.81.657.2]Location = 6 Size = -0.2329
Table 3: Load flow using newton raphson method with TCSC for IEEE-30 bus system using Bat algorithm
TCSC for IEEE – 30 Bus system BAT Algorithm V
(in p.u)
Angle δ
P (MW )
Q (MVAR)
1.06 0 262.2706 53.073
1.0071 -4.8613 18.3 -75.2498
1.0123 -7.6239 -2.4 -1.2
1.0014 -9.409 -7.6 -1.6
1.01 -14.5427 -94.2 40.9258
1.0031 -11.2901 0 0
0.9981 -13.1563 -22.8 -10.9
1.01 -12.1625 -30 27.1577
1.0467 -14.3606 0 0
1.0402 -15.9611 -5.8 -2
1.082 -14.3606 0 18.3834
1.0529 -15.1821 -11.2 -7.5
1.071 -15.1821 0 13.87
1.0379 -16.0847 -6.2 -1.6
1.0332 -16.1786 -8.2 -2.5
1.0398 -15.7758 -3.5 -1.8
1.0351 -16.1214 -9 -5.8
1.0234 -16.8028 -3.2 -0.9
1.0209 -16.9808 -9.5 -3.4
1.0249 -16.7837 -2.2 -0.7
1.0278 -16.408 -17.5 -11.2
1.0283 -16.3937 0 0
1.0224 -16.578 -3.2 -1.6
1.0165 -16.7634 -8.7 -6.7
1.0119 -16.343 0 0
0.9941 -16.7673 -3.5 -2.3
1.0176 -15.8207 0 0
1.0013 -11.9436 0 0
0.9977 -17.0645 -2.4 -0.9
0.9861 -17.9576 -10.6 -1.9
30.7137 -424.86 18.8706 13.6601
Location = 2 Size = -0.1725
Table 4: Load flow using newton raphson method with STATCOM for IEEE-30 bus system using PSO
STATCOM for IEEE – 30 Bus system PSO Algorithm
V (in p.u)
Angle δ
P (MW )
Q (MVAR)
1.06 0 261.0403 1.8709
1.0185 -7.5515 -2.4 -1.2
1.009 -9.3112 -7.6 -1.6
1.01 -14.2575 -94.2 23.9856
1.0084 -11.1175 0 0
1.0012 -12.9348 -22.8 -10.9
1.01 -11.8989 -30 12.4645
1.0498 -14.1688 0 0
1.0438 -15.7622 -5.8 -2
1.082 -14.1688 0 16.7595
1.056 -15.0001 -11.2 -7.5
1.071 -15.0001 0 11.4828
1.0411 -15.895 -6.2 -1.6
1.0365 -15.9874 -8.2 -2.5
1.0432 -15.5859 -3.5 -1.8
1.0386 -15.9236 -9 -5.8
1.0269 -16.6043 -3.2 -0.9
1.0244 -16.7791 -9.5 -3.4
1.0285 -16.5824 -2.2 -0.7
1.0314 -16.206 -17.5 -11.2
1.0319 -16.1917 0 0
1.0259 -16.3803 -3.2 -1.6
1.0202 -16.5591 -8.7 -6.7
1.0159 -16.1332 0 0
0.9982 -16.554 -3.5 -2.3
1.0218 -15.6093 0 0
1.0054 -11.7491 0 0
1.0019 -16.8429 -2.4 -0.9
0.9904 -17.7284 -10.6 -1.9
30.8354 -419.701 17.6403 8.5137
[image:8.595.89.511.91.647.2]Location = 2 Size = 01.0252
Table 5: Load flow using newton raphson method with STATCOM for IEEE-30 bus system using Bat algorithm
STATCOM for IEEE – 30 Bus system BAT Algorithm
V (in p.u)
Angle δ
P (MW )
Q (MVAR)
1.06 0 261.0081 -19.9262
1.045 -5.3758 18.3 52.0155
1.0204 -7.5343 -2.4 -1.2
1.0113 -9.2873 -7.6 -1.6
0.9957 -14.0098 -94.2 3.0782
1.0092 -11.0666 0 0
0.9958 -12.8114 -22.8 -10.9
1.01 -11.834 -30 10.1842
1.0503 -14.1152 0 0
1.0445 -15.7074 -5.8 -2
1.082 -14.1152 0 16.472
1.0568 -14.9545 -11.2 -7.5
1.071 -14.9545 0 10.8423
1.0419 -15.8472 -6.2 -1.6
1.0373 -15.9382 -8.2 -2.5
1.044 -15.5357 -3.5 -1.8
1.0394 -15.87 -9 -5.8
1.0277 -16.5521 -3.2 -0.9
1.0251 -16.7254 -9.5 -3.4
1.0292 -16.5283 -2.2 -0.7
1.0321 -16.1508 -17.5 -11.2
1.0327 -16.1366 0 0
1.0267 -16.3286 -3.2 -1.6
1.021 -16.5044 -8.7 -6.7
1.0166 -16.0764 0 0
0.9989 -16.4967 -3.5 -2.3
1.0225 -15.5516 0 0
1.006 -11.6949 0 0
1.0026 -16.7835 -2.4 -0.9
0.9911 -17.6677 -10.6 -1.9
30.8468 -418.154 17.6081 8.166
Location = 3 Size = 01.0279
Table 6: Load flow using newton raphson method with UPFC for IEEE-30 bus system using PSO
UPFC for IEEE – 30 Bus system PSO Algorithm V
(in p.u)
Angle δ
P (MW )
Q (MVAR)
ISSN: 1992-8645 www.jatit.org E-ISSN: 1817-3195
1.045 -5.3782 18.3 43.3695
1.0212 -7.5287 -2.4 -1.2
1.0123 -9.2794 -7.6 -1.6
1.01 -14.1488 -94.2 16.6588
1.0106 -11.055 0 0
1.0026 -12.8523 -22.8 -10.9
1.01 -11.7974 -30 6.1113
1.0511 -14.098 0 0
1.0454 -15.6882 -5.8 -2
1.082 -14.098 0 16.0574
1.0573 -14.9329 -11.2 -7.5
1.071 -14.9329 0 10.4507
1.0425 -15.8245 -6.2 -1.6
1.0379 -15.9164 -8.2 -2.5
1.0446 -15.5154 -3.5 -1.8
1.0402 -15.8499 -9 -5.8
1.0284 -16.5302 -3.2 -0.9
1.0259 -16.7037 -9.5 -3.4
1.03 -16.5072 -2.2 -0.7
1.033 -16.1307 -17.5 -11.2
1.0335 -16.1164 0 0
1.0274 -16.3066 -3.2 -1.6
1.0218 -16.4828 -8.7 -6.7
1.0176 -16.0546 0 0
0.9999 -16.474 -3.5 -2.3
1.0235 -15.5301 0 0
1.0071 -11.6773 0 0
1.0037 -16.7593 -2.4 -0.9
0.9922 -17.6416 -10.6 -1.9
30.8877 -417.811 17.5569 7.7298
[image:9.595.94.509.83.663.2]Location = 24 Size = 02.4800
Table 7: Load flow using newton raphson method with UPFC for IEEE-30 bus system using Bat algorithm
UPFC for IEEE – 30 Bus system BAT Algorithm V
(in p.u)
Angle δ
P (MW )
Q (MVAR)
1.06 0 260.9569 -20.4179
1.045 -5.3782 18.3 43.3695
1.0212 -7.5287 -2.4 -1.2
1.0123 -9.2794 -7.6 -1.6
1.01 -14.1488 -94.2 16.6588
1.0106 -11.055 0 0
1.0026 -12.8523 -22.8 -10.9
1.01 -11.7974 -30 6.1113
1.0511 -14.098 0 0
1.0454 -15.6882 -5.8 -2
1.082 -14.098 0 16.0574
1.0573 -14.9329 -11.2 -7.5
1.071 -14.9329 0 10.4507
1.0425 -15.8245 -6.2 -1.6
1.0379 -15.9164 -8.2 -2.5
1.0446 -15.5154 -3.5 -1.8
1.0402 -15.8499 -9 -5.8
1.0284 -16.5302 -3.2 -0.9
1.0259 -16.7037 -9.5 -3.4
1.03 -16.5072 -2.2 -0.7
1.033 -16.1307 -17.5 -11.2
1.0335 -16.1164 0 0
1.0274 -16.3066 -3.2 -1.6
1.0218 -16.4828 -8.7 -6.7
1.0176 -16.0546 0 0
0.9999 -16.474 -3.5 -2.3
1.0235 -15.5301 0 0
1.0071 -11.6773 0 0
1.0037 -16.7593 -2.4 -0.9
0.9922 -17.6416 -10.6 -1.9
30.8877 -417.811 17.5569 7.7298
0 5 10 15 20 25 30 35
B A SE
CA SE
TC S C P
SO
TC S
C BA T
ST A
T CO M P S
O
S TTAC
OM B
A T
UP FC
PSO
U P
FC B
AT
Voltage Real Power Reactive Power
Figure 10: Power quality performances with FACTS devices
6. CONCLUSION
In this research work an evolutionary algorithm method has been proposed to optimally locate TCSC, STATCOM and UPFC in power systems. The result of load flow calculation before and after compensation process also shown. From figure 10, it is clear that, performance of the FACTS devices can be improved based on the location, which is suitable for their nature of operation. Selection of sizing of operation also improves the performance as well as reduction in pricing of devices. In further similar principle can be implemented for combined optimal selection and sizing of FACTS devices
REFRENCES:
[1] C.Fitzer, M.Barnes, Peter Green, “Voltage sag detection technique for a dynamic voltage restorer”, IEEE transactions on Industry appli-cations, Vol.40, No.1 Jan.2004, pg.203- 212. [2] J. G. Singh, S. N. Singh and S. C. Srivastava,
“Enhancement of Power System Security through Optimal Placement of TCSC and UPFC,” Power Engineering Society General Meeting, Tampa, 24-28 June 2007, pp. 1-6. [3] N.K. Sharma, A. Ghosh and R. K. Varma, “A
Novel Placement Strategy for Facts Controllers,” IEEE Transactions on Power Delivery, Vol.18, No.3, 2003, pp. 982- 987. [4] IEEE/CIGRE Working Groups on FACTS,
“FACTS Overview,” IEEE Special Publication 95-TP-108, 1996.
[5] Xiao-Ping Zhang, Christian Rehtanz, Bikash Pal, Flexible AC Transmission Systems: Modelling and Control. ISBN-10 3-540-30606-4 Springer Berlin Heidelberg New York, 2006. [6] L.Gyugyi, C.D.Shauder, S.L.Williams,
T.R.Rietman, D.R.Torgerson, A. Edris. The unified power flow controller: a new approach to power transmission control. IEEE
Transactions on Power Delivery, vol.10, no.2, 1995, pp 1085-1093.
[7] X.P. Zhang, Comprehensive modelling of the unified power flow controller for power system control. Electrical Engineering - Archiv für Elektrotechnik, DOI: 10.1007/S00202-004- 0280-0, published online, 2005.
[8] J. Hazra1 and A. K. Sinha, \A Study on Real and Reactive Power Optimization using Particle Swarm Optimization," International Conference on Industrial and Information Systems, August 2007, pp. 323 328.
[9] X. S. Yang, A New Metaheuristic Bat-Inspired Algorithm, in Nature Inspired Cooperative Strategies for Optimization, (NISCO 2010) (Eds. J. R. Gonzalez et al.), Studies in Computational Intelligence, Springer Berlin, 284, 2010, pp.65-74.
[10] P. Musikapun and P. Pongcharoen1, Solving Multi-Stage Multi-Machine Multi-Product Scheduling Problem Using Bat Algorithm,
Proc. 2nd International Conference on
Management and Artificial Intelligence