M E T H O D O L O G Y
Open Access
A statistical framework for quantifying clinical
equipoise for individual cases during randomized
controlled surgical trials
Nicholas R Parsons
1*, Yuri Kulikov
1, Alan Girling
2and Damian Griffin
1Abstract
Background:Randomised controlled trials are being increasingly used to evaluate new surgical interventions. There are a number of problematic methodological issues specific to surgical trials, the most important being identifying whether patients are eligible for recruitment into the trial. This is in part due to the diversity in practice patterns across institutions and the enormous range of available interventions that often leads to a low level of agreement between clinicians about both the value and the appropriate choice of intervention. We argue that a clinician should offer patients the option of recruitment into a trial, even if the clinician is not individually in a position of equipoise, if there is collective (clinical) equipoise amongst the wider clinical community about the effectiveness of a proposed intervention (the clinical equipoise principle). We show how this process can work using data collected from an ongoing trial of a surgical intervention.
Results:We describe a statistical framework for the assessment of uncertainty prior to patient recruitment to a clinical trial using a panel of expert clinical assessors and techniques for eliciting, pooling and modelling of expert opinions. The methodology is illustrated using example data from the UK Heel Fracture Trial. The statistical modelling provided results that were clear and simple to present to clinicians and showed how decisions
regarding recruitment were influenced by both the collective opinion of the expert panel and the type of decision rule selected.
Conclusions:The statistical framework presented has potential to identify eligible patients and assist in the simplification of eligibility criteria which might encourage greater participation in clinical trials evaluating surgical interventions.
Keywords:Equipoise, Randomised controlled trial, Surgery, Statistical model
1 Background
There is an increasing demand for randomised con-trolled trials (RCTs) in surgery to provide high quality evaluation of new interventions; we use the word inter-vention synonymously with treatment, procedure or sur-gical procedure. In a background of ever evolving and improving healthcare, differences between interventions for the same condition are often small, substantially increasing the risk of biased estimation of treatment effects in simple (uncontrolled) observational studies of the interventions [1]. The need for the kind of high
level evidence provided by RCTs for surgical interven-tions is clear [2], although a number of methodological issues have been raised for surgical trials [1,3]. One of the most important issues being recruitment, and speci-fically identifying whether patients are eligible for entry into a trial.
The existing tremendous diversity in practice patterns across institutions coupled with an ever increasing range of available interventions suggests a low level of agree-ment between clinicians about both the value of many interventions and the appropriate choice of intervention [4]. A present or imminent controversy in the expert medical community about a choice between interven-tions is called clinical (or collective) equipoise. Equipoise
* Correspondence: [email protected]
1Warwick Medical School, University of Warwick, Coventry, CV4 7AL, UK Full list of author information is available at the end of the article
is the point where we are equally poised in our beliefs about the potential benefits of a particular intervention [5]; i.e. is intervention A better than intervention B. Clinical equipoise is present “if there is genuine uncer-tainty within the expert medical community - not neces-sarily on the part of the individual investigator - about the preferred treatment”[5]. In many cases the only way to resolve collective uncertainty about the optimum intervention choice is to undertake a clinical trial. Indi-vidual equipoise relates to a single clinician, i.e. the posi-tion where he or she has no preference amongst a range of available treatments. It is subject to change for a host of reasons, including peer pressure, the results of poten-tially imperfect studies and the influence of advertising. Freedman [5] argues that global clinical equipoise should override the individual clinician’s lack of equi-poise. Clinicians should subsume their personal views and recruit patients into a trial, even if not individually in a position of equipoise themselves. This view is impli-citly accepted by society in the form of ethics commit-tees, which must ensure that the treatments being compared are reasonable options before trial partici-pants are sought. Often, for a treatment that is not com-pletely novel, this is demonstrated by the presence of clinical equipoise in an expert and/or wider medical community. Once ethics committee permission has been granted, it then becomes an individual clinician’s deci-sion whether the offer of entry into the trial is appropri-ate for an individual patient [6]. Unfortunappropri-ately, the varied preferences expressed (which may be rational, anecdotal or irrational) between individual institutions and between individual surgeons within and between institutions often make patient recruitment to trials very challenging.
Statistically the level of individual uncertainty about the effectiveness of an intervention can be quantified by a (subjective) probability, which is assigned to a specific hypothesis and is personal and varies with an indivi-dual’s knowledge and expertise.“A measure of a state of
knowledge” [7] is provided by the Bayesian concept of
subjective probability. The process of expert evaluation about the effectiveness of a proposed intervention in an RCT is synonymous with elicitation of a Bayesian prior; i.e. a statement of knowledge prior to performing an experiment or trial usually stated in the form of a prob-ability density. There are a number of approaches to turning informally expressed ideas into a mathematical prior distribution, with no consensus as to the optimal method of determination for a process that is usually problem specific [8]. We choose to elicit the subjective opinion of a panel of experts as a basis for decision making regarding the eligibility of a patient for recruit-ment to an RCT [9]. This has the advantage of being dynamic and flexible, in the sense that it is quite feasible
that opinions will change during the course of a trial, for example with the publication of related research [8], or as experience accumulates amongst clinicians as to how best to undertake a surgical procedure.
Methods for formal measurement of clinical uncer-tainty, as a prelude to a clinical trial have been
sug-gested previously [10] and measures of surgeon’s
equipoise in the setting of surgical trials have also been reported [11]. However, we develop these ideas further, using techniques for eliciting subjective judgements before a trial [12-14] and introduce a novel framework for decision making regarding recruitment to an RCT that we hope will be easily understood by clinicians and implemented in real time during the course of a trial. It is particularly challenging recruiting patients to trials comparing operative to non-operative treatments or a standard against a new but popular well-marketed treat-ment. Therefore we develop a statistical framework to model clinical equipoise (Section 3), using a parametric and a nonparametric approach, for data collected from a clinical trial comparing conservative and operative treat-ment for displaced fractures of the calcaneus. The results of applying the models are reported in Sections 3.7-10 and we draw conclusions in Section 4.
2 Methods
Using available web design tools a method was devel-oped to capture the opinions of clinicians in real time for individual patients (cases) in an ongoing RCT. It comprised of a virtual expert panel giving their opinion about the effectiveness of a proposed treatment for vidual patients based on online clinical details; the indi-vidual assessments were then synthesized and fed back electronically to the lead clinical investigator. This pro-cess is described in greater detail below.
Patients who met the initial trial inclusion criteria were identified and approached by a member of the research team to alert them to the possibility of partici-pating in a trial. They were then asked permission for their anonymized clinical details to be distributed among a panel of experts/clinicians for an opinion regarding the effectiveness of the proposed treatment. Clinical data from consented patients were made avail-able on a secure website managed by eLab at the Uni-versity of Warwick, and all panel experts/clinicians were alerted by email and text message (if requested) to the posting of a new patient and asked to offer their perso-nal opinion on the likely success of the proposed treat-ments. The assessment scale is described in more detail for the specific example of the UK Heel Fracture Trial. Initially the system was tested in a pilot study with seven surgeons from five UK hospitals. Ten retrospec-tive calcaneal fracture cases were selected to represent
instructions on the website with online and telephone technical support available; no specific training was given. When voting on all ten cases was completed, sur-geons were asked to fill in an evaluation questionnaire. Voting on a single case never took longer than 5 min-utes and the available clinical information was found sufficient and the whole process user friendly by all par-ticipating surgeons.
After the successful pilot study the system was intro-duced as an independent component of the UK Heel Fracture Trial, which compared conservative and opera-tive treatment for displaced fractures of the calcaneus. The study had separate ethical approval and a consent form, in addition to the main trial. This allowed inclu-sion both of those patients who took part in the UK Heel Fracture Trial and those who declined, as soon as the patient met the trial eligibility criteria. To avoid interference with the clinical course, patients were asked permission to use their data at the 6 weeks follow-up clinic or later. Their anonymous clinical data including X-rays and CT images were posted to a secure website. The expert assessment panel included 12 surgeons from 9 hospitals. All surgeons were foot and ankle specialists and acted as principal investigators in their individual trial centres.
After assessing the clinical data available for a given patient, the surgeon was able to scroll down to an inter-active scale, featuring bars (initially set at zero) above each of seven outcome categories indicating whether after surgical intervention the patient would get“much worse“(1),“significantly worse“ (2),“a bit worse“(3), “no difference“ (4),“a bit better“(5), “significantly better“ (6) or “much better“ (7). A left-click of the mouse and a drag allowed each outcome prognosis bar to be set to a desired percentage, which was reported numerically over the bar. Once the assessment summed to 100% (reflected in a digital window in the upper left corner of the scale) the submit button allowed the data to be sent to the trial lead for analysis. The UK Heel Fracture Trial compared operative (surgical) and non-operative (con-servative) treatment. Surgical techniques are becoming widespread for calcaneal fracture, but do have associated risks, therefore it was important for the clinician to assess the improvement potential relative to the risks for this procedure. Belief, in the context we describe here, that surgery can make a patient better implies intention to do surgery, while disbelief implies intention to avoid surgical intervention, hence to choose the conservative option. The question posed to the expert panel can and should be tailored to the specific trial. For the UK Heel Fracture Trial the experts were asked to compare opera-tive (surgical) and non-operaopera-tive (conservaopera-tive) treat-ment, which although strongly contrasting treatment options may vary in the exact detail of the constituent
components. For studies with less contrasting treatment options (e.g. two types of surgery) the question to experts may simply be whether the test intervention would be better or worse for a patient, compared to a control (standard) intervention.
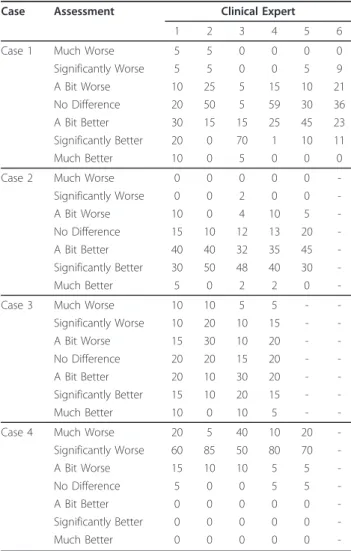
Table 1 shows four examples of data elicited from between 4 and 6 clinical experts, not necessarily the same individuals labelled as 1 to 6, who provided their opinions on the effectiveness of surgical compared to non-surgical intervention after fracture of the calcaneus. As expected there are clear differences in the both the locations and shapes of the individual distributions for a number of these cases and indeed a number of clear similarities for other cases. For instance, the opinions of the clinicians vary widely for case 1; clinical expert 3 is reasonably confident that the patient will improve signif-icantly after treatment whereas for expert 4 the most likely outcome of treatment is that the condition of the patient will be unchanged. There is much clearer
Table 1 Assessment of the likely effectiveness of surgical intervention after fracture of the calcaneus for four example cases and up to six clinical experts
Case Assessment Clinical Expert
1 2 3 4 5 6
Case 1 Much Worse 5 5 0 0 0 0
Significantly Worse 5 5 0 0 5 9
A Bit Worse 10 25 5 15 10 21
No Difference 20 50 5 59 30 36 A Bit Better 30 15 15 25 45 23 Significantly Better 20 0 70 1 10 11
Much Better 10 0 5 0 0 0
Case 2 Much Worse 0 0 0 0 0
-Significantly Worse 0 0 2 0 0
-A Bit Worse 10 0 4 10 5
-No Difference 15 10 12 13 20 -A Bit Better 40 40 32 35 45 -Significantly Better 30 50 48 40 30
-Much Better 5 0 2 2 0
-Case 3 Much Worse 10 10 5 5 -
-Significantly Worse 10 20 10 15 -
-A Bit Worse 15 30 10 20 -
-No Difference 20 20 15 20 -
-A Bit Better 20 10 30 20 -
-Significantly Better 15 10 20 15 -
-Much Better 10 0 10 5 -
-Case 4 Much Worse 20 5 40 10 20
-Significantly Worse 60 85 50 80 70
-A Bit Worse 15 10 10 5 5
-No Difference 5 0 0 5 5
-A Bit Better 0 0 0 0 0
-Significantly Better 0 0 0 0 0
-agreement for case 4 where all the experts expect the patient to worsen significantly after treatment. How do we use these data to decide whether a patient (case) is eligible for recruitment to a clinical trial? We propose two approaches here to model the opinions obtained from each expert clinician, a parametric model based on a Beta distribution (Section 3.2) and a nonparametric model based on estimated means and standard devia-tions (Section 3.3) that characterise expert opinions using concepts of belief, disbelief anduncertainty. The belief, disbelief and uncertaintyare visualized using a ternary plot that displays these characteristics in a man-ner that allows them to be compared to decision rules that partition the opinion space. Finally, resampling methods are used to draw inferences concerning the sufficiency of evidence from the clinical experts to patient eligibility for recruitment
3 Results and Discussion 3.1 Expert opinion
An opinion regarding the effectiveness of a procedure can be thought of as comprising of three distinctive aspects;belief, disbeliefand uncertainty.Beliefrepresents the tendency of an expert to expect a particular treat-ment to perform better than an alternative (control intervention) for a particular patient (case); i.e. the ten-dency for the experts to score cases in the higher end categories of the rating scale of Table 1. Conversely, the
level of disbelief is equated with the tendency for an
intervention to have a worse outcome as compared to a control intervention; i.e. the tendency for the experts to score cases in the lower end categories of the rating scale. Theuncertaintyassociated with thebeliefand dis-belief represents the spread of the data across the opi-nion range; i.e. all the scores might be concentrated in the central category (no difference) or be spread equally between all categories in Table 1 - we would have equal beliefin these two scenarios but a maximum difference inuncertainty.
Borrowing from the notation of subjective logic
[15,16], we label the belief, disbelief and uncertainty
associated with an opinion for expert ias bi, di andui,
and apply the constraint that
bi+di+ui= 1 and{bi,di,ui} ∈[0, 1]3 (1)
where the triplet πi = {bi, di, ui} is described as the
opinion of experti. Intuitively it makes sense that there should be a constraint on these characteristics, as expressed in (1), as clearly when we have a maximum
level of beliefin a procedure we must necessarily have
zerodisbeliefanduncertainty. Similarly, when there is a
maximum level of uncertainty there clearly must be
zero levels of beliefand disbelief. The constraint that
our levels ofbelief, disbelief anduncertaintymust sum to unity is of course a matter of convenience, in an ana-logous manner to that in conventional probability where the same constraint is used. It seems reasonable, using statistical arguments, that we should scale our levels of beliefand disbelief about the effectiveness of a proce-dure by the associateduncertainty. That is we are
inter-ested in the quantitiesb/uandd/u, in the same way we
might want to normalize a treatment difference in an RCT by the associated standard deviation measuring the spread or uncertainty in the estimated difference to give an effect size. In order to estimateb, d andu, we need to develop a model for the clinical expert assessment data.
3.2 Parametric model
3.2.1 Assessment pooling
The assessment of the likely effectiveness of the
inter-vention xwas scored on a discrete valued symmetric
scale with descriptive terms selected to imply an even spacing between categories. For our selected example, the seven-category ordinal scale, described in Section 2, was transformed onto the interval [0,1] as follows;
2→ 143, 2→ 143, 3→ 145, 4→ 147, 5→ 149, 6→ 1411
and 7→ 1314. This retains the implicit spacing of the ordinal scale and centres the new scale at the same point as the original scale. Equivalent arguments can be constructed for ordinal scales with different numbers of categories.
Letxi, where 0≤xi≤1, quantify the likely effectiveness
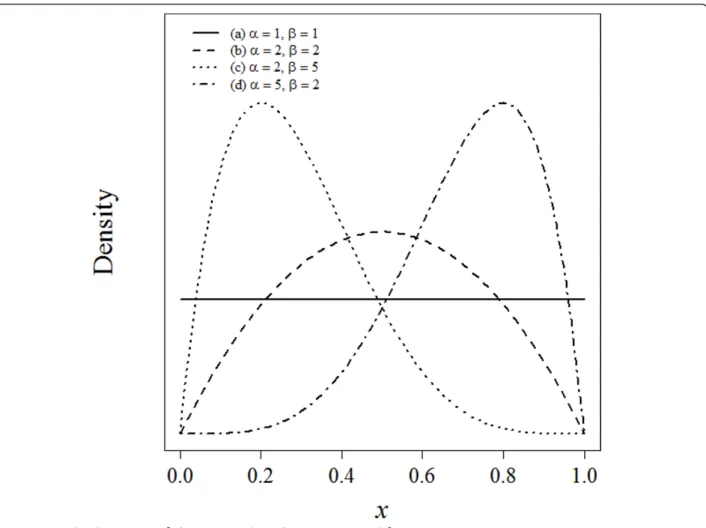
of a procedure for individual experti as part of a panel ofnexperts. The distribution ofxi is assumed to follow
an approximate Beta distribution (Figure 1), a continu-ous probability distribution defined on the interval (0,1) and parameterized by two positive parameters, denoted bya and b, that modify the shape of the distribution. The Beta distribution is widely used for modelling ran-dom probabilities, particularly in the context of Bayesian analysis [17] and has been used to describe not only variability within a population as in a conventional sta-tistical model, but also to describe the subjective degree of beliefin a Bayesian sense [8]. Expressed mathemati-cally, the probability density function forxiis
fi(xi;αi,βi) =
(αi+βi) (αi)(βi)
xiαi−1(1−xi)βi−1,,
whereΓ(.) is the gamma function and parameters ai≥
1 andbi≥1, requiring that the distribution be unimodal
or at the extreme case, when ai =bI = 1, uniform. In
the surgical trial setting described here, it seems unlikely that for instance a u-shaped distribution forxi (e.g.a=
0.5 andb= 0.5) would be plausible.
f0(x) ={
n
i=1fi(xi;αi,βi)} 1/n
wheref0(x) follows a Beta distribution with parameters ¯
α= 1nn
i=1αi and β¯= 1
n
n
i=1βi. This provides a
pooled assessment that represents the intersection of the beliefs of the expert panel [19].
3.2.2 Opinion model
In order to translate the assessments from the panel of
n experts to a collective expert opinion, the measures
¯
bu¯ and d¯u¯ (Section 3.1), that characterise the
pooled opinion, are related to the pooled assessment
parameters α¯ and β¯. Equating the level of belief
expressed by an expert to the pooled assessments, it is
clear that α¯ must be proportional to b¯u¯, that is a
lar-ger value of α¯ represents a greater degree of belief; at the extreme as α¯ → ∞, then b¯→1 and u¯→0, when
we have maximumbeliefwe must have minimum
uncer-tainty. Similarly arguments lead to β¯ being
proportional to d¯
¯
u; a larger value of β¯ represents a
greater degree ofdisbelief. Although, clearly from exam-ple (a) in Figure 1, when the pooled Beta distribution
parameter estimates are at their minimum and α¯ = 1
and β¯= 1 then there is maximum uncertainty (u¯= 1) and minimumbeliefanddisbelief, b¯=d¯ = 0. Formalizing these arguments leads to the following expressions that satisfy all these conditions
¯
b
¯
u=α¯−1 and
¯
d
¯
u =β¯−1. (2 3)
Solving equations (2) and (3), along with the condition that b¯+d¯+u¯= 1 (equation 1), yields the following expressions that characterize the relationship between the triplet {¯b,d¯,u¯} and the parameters α¯ and β¯,
¯
b= α¯−1
¯
α+β¯−1,d¯ =
¯
β−1
¯
α+β¯−1, andu¯ = 1
¯
α+β¯−1; (4 6)
where the triplet {¯b,d¯,u¯} clearly satisfies b¯+d¯+u¯ = 1; a more detailed derivation of equations (4)-(6) is
pro-vided elsewhere [15,16]. Thus, when α¯ =β¯= 1,
¯
π={0, 0, 1} and the pooled opinion is totaluncertainty (ignorance); see example (a) in Figure 1. If parameters
¯
α and β¯ are greater than unity but equal, we have
equalbelief and disbelief; for example (b) in Figure 1 where α¯ =β¯= 2 and π¯ ={13,13,13}. As α¯ increases
rela-tive to β¯ the belief increases and the uncertainty
decreases and conversely as β¯ increases relative to α¯ the disbelief increases and the uncertainty decreases; these two scenarios are illustrated in examples (d) and (c) in Figure 1, where α¯ = 5, β¯= 2 and π¯ ={46,16,16}
and α¯ = 2, β¯= 5 and π¯ ={16,46,16}.
3.3 Nonparametric model
An alternative nonparametric formulation forbelief, dis-belief anduncertainty allows a more general approach to that described in Section 3.2. Defining μi andsi as
the mean and standard deviation of the assessment of
the effectiveness of the intervention xi for expert i,
wherexi is in the range [0,1]. Then theuncertainty (ui),
belief (bi) and disbelief(di) associated with an opinion
for experti can be expressed as ui=σi2
μi(1−μi), bi
=μi(1-ui) andbi=di=(1-μi)(1-ui); as 0≤xi ≤1, then 0
≤ ui ≤ 1 and the measures satisfy equation (1). For
example using the data from Table 1 for expert 4 from case 3, the weighted mean and standard deviation, based on the transformed seven-category ordinal scale
described in Section 3.2.1
(1/14,3/14,5/14,7/14,9/14,11/14,13/14) with weights given by
(5,15,20,20,20,15,5), areμ= 0.5 and s= 0.226, and sou
= 0.204 andb =d= 0.398. Multiplicative pooling leads
directly to estimates for the opinion triplet {¯b,d¯,u¯}, with weights given by thenthroot of the product of the individual expert weights, in an analogous manner to that described in Section 3.2.1 for the parametric model. In fact the expressions for uncertainty, beliefand dis-belief for the Beta model in equations (4)-(6) follow
directly from the above expressions for u, b and d,
based onμ ands, after some rescaling, by noting that the mean and variance of the Beta distribution area/(a +b) andab/{(a+b)2(a+b+1)} respectively.
3.4 Opinion space
As proposed by Jøsang [15], a ternary plot provides a convenient method of representing the triplet of belief, disbeliefanduncertaintythat constitute a pooled expert opinion. A ternary plot represents the ratios of the three
variables as positions in an equilateral triangle, where each base, or side, of the triangle represents a propor-tion, with the point of the triangle opposite that base representing a proportion equal to one. As a proportion increases in any one sample, the point representing that sample moves from the base to the opposite point of
the triangle. For instance, when α¯ =β¯= 1 (maximum
uncertainty) the opinion is mapped to the apex of the equilateral triangle, whereas when α¯ =β¯= 2 there is
equalbelief, disbelief and uncertainty and the pooled
opinion is mapped to the centre of the triangle. The cases representing greater levels ofbelief and greater
levels ofdisbelief are mapped towards the right-hand
and left-hand vertices of the triangle respectively.
3.5 Decision rules
In order to determine the level of equipoise that should be satisfied for a clinical trial to be considered ethical
Johnson et al. [20] conducted an ethometric study to
investigate how much clinical equipoise can be dis-turbed before potential trial subjects deem it to be unethical. A series of hypothetical clinical trial scenarios were presented to people from a broad range of societal and geographical groups within the UK. They were asked to specify the level of collective doubt between two treatment modalities that they would accept if
cast-ing a vote on an ethics committee. Johnson et al. [20]
defined the 80:20 rule, that represented the split in equi-poise that should be allowed for a trial to be judged to be ethical and recommended its use as an appropriate tool for deciding whether recruitment is ethically justifi-able; based on their empirical evidence that less than 3% of subjects questioned thought that a trial should morally be undertaken if equipoise was beyond this
point. By way of comparison, an alternative mean
threshold rule might consider it ethical to recruit patients if the mean clinical effectiveness (μ), estimated asa/(a+b) for the Beta distribution, were within pre-determined limits. For instance, it might be considered ethical to recruit patients into a trial if the mean clinical effectiveness were in the range 0.4≤μ≤0.7.
The 80:20 andmean threshold equipoise decision rules
3.6 Hypothesis testing
The significance of the estimated pooled opinion (π¯) is assessed using resampling. For the Beta model for
Sec-tion 3.2, pooled assessment parameters
¯ α∗
m= 1n
i∗∈Smα
i∗ and β¯m∗ = 1n
i∗∈Smβ
i∗ are estimated
for Sm, a set of size n constructed by sampling with
replacement from {1,2...n}; for example for the pooled
assessment of 5 experts Sm might be {1,2,2,4,1} or
{5,3,3,1,1}. This process is repeated many times by ran-dom construction ofSmto give empirical bootstrap [21]
distributions α¯1∗,α¯∗2,. . .,α¯∗M and β¯1∗,β¯2∗,. . .,β¯M∗, and thereby π¯1∗,π¯2∗,. . .,π¯M∗ . From this empirical distribu-tion, a bootstrap confidence interval for π¯ is derived for the purpose of hypothesis testing. A similar resampling scheme can also be developed simply for the nonpara-metric model of Section 3.3.
This resampling methodology represents the variability in opinion that might be obtained for any combination of experts in the panel, including in principle a panel composed entirely of a single expert, and as such repre-sents the full range of possible opinions for the selected population of experts. For the relative small panel of experts in our example, exhaustive permutation resam-pling [21] is the preferred option, but this may be
com-putational unrealistic for large n where bootstrapping
withM= 1000 would be sufficient.
3.7 Beta distribution fitting
The outlined statistical framework is illustrated using the example data introduced in Section 2 (Table 1). We focus here on the Beta model (Section 3.2) as an exem-plar, as this fits our data well and is computational slightly more complex to implement than the nonpara-metric method. Statistical analysis was undertaken in the statistical software package R [22]. Code to replicate the analysis presented here is available on request from the corresponding author.
The parameters of the Beta distribution were esti-mated for each clinical expert for the four cases shown
in Table 1 using the fitdistr function available in
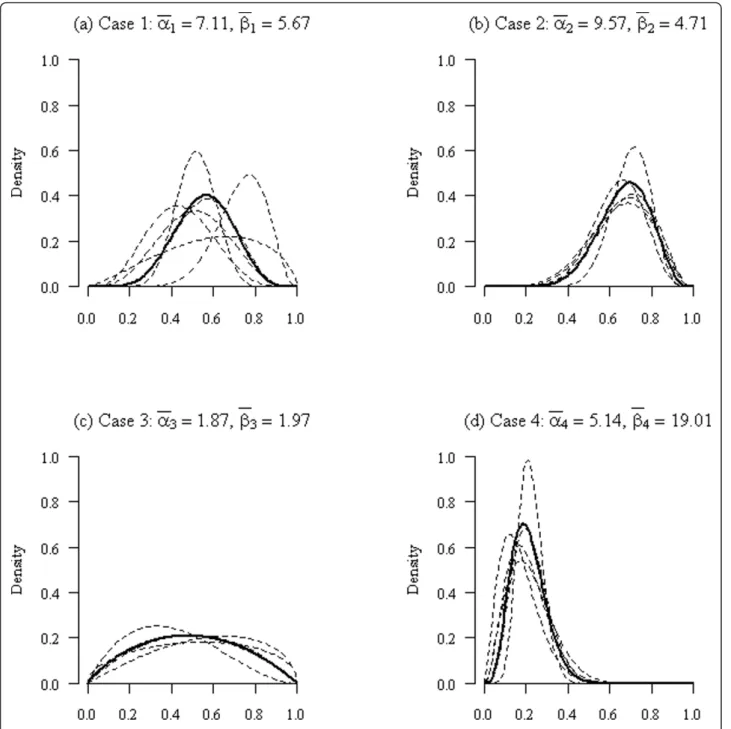
the MASS [23] library in the statistical software pack-age R [22]. This function estimates parameters for a range of univariate distributions, including the Beta distribution, using maximum-likelihood methods. For the four example cases introduced in Section 2 the pooled parameter estimates were α¯1= 7.11, α¯2= 9.57,
¯
α4= 5.14, α¯4= 5.14 and β¯1= 5.67, β¯2= 4.71, ¯
β4= 19.01, β¯4= 19.01. The fitted distributions for
each clinical expert and pooled estimates are shown in Figure 2.
3.8 Opinions
The pooled parameter estimates from the Beta distribu-tion fitting for the four example cases were used to
esti-mates the belief, disbelief and uncertainty using
equations (4)-(6); this gave the following estimates,
¯
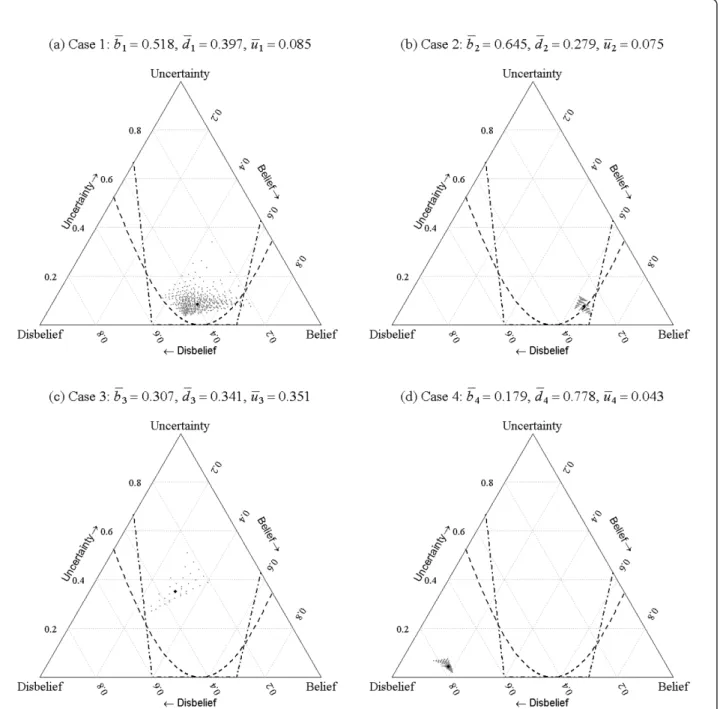
b2= 0.645, b¯2= 0.645, ¯b3= 0.307, b¯4= 0.179, ¯
d2= 0.279, d¯2= 0.279, d¯3= 0.341, d¯4= 0.778 and ¯
u2= 0.075, u¯2= 0.075, u¯3= 0.351, u¯4= 0.043.
Inspec-tion of Figure 2, indicates that there appears to be sig-nificant belief for case 2 that the patient will improve after treatment (surgery) and conversely significant dis-belief in the effectiveness of the treatment for case for case 4; this is reflected in the large (> 0.6) estimates ofb andd for cases 2 and 4 respectively. Also, there is sig-nificant uncertainty, seen by the flatness of the curves in Figure 2(c), in the collective opinions of the experts for case 3; this is apparent in the large level of uncertainty for this case, relative to the other cases.
3.9 Decision rules
In order to determine whether an opinion provides suf-ficient evidence for eligibility for recruitment to a clini-cal trial, we must first define a decision rule. Here we
focus on two rules, the 80:20 [20] and themean
thresh-old rules; although the procedures described here are
equally applicable to many more rules that could
poten-tially be defined. The 80:20 and mean threshold rules
partition the opinion space, visualized by the ternary plot, into regions that determine whether the patient can or cannot ethically be recruited to a trial.
The division lines between the regions for the 80:20 rule were determined iteratively (using an interval search method) by finding estimates of the Beta
distri-bution parameters a and b that exactly divided the
probability density 80% and 20% around equipoise, and projecting these estimates into the opinion space using equations (4)-(6). This process was achieved using an
implementation of the uniroot function in R [22].
After discussion with the clinical experts it became clear that the point of equipoise for the assessment scale described in Section 2 for the 80:20 rule was not located centrally but was in fact located at the division between the ‘No difference’and the‘A bit better’categories. That is, because surgery was seen to be an active intervention for a condition that required treatment, the point of equipoise was located slightly to the right of the centre point of the assessment scale; which for our definition of the assessment scale is at 8/14 rather than at 1/2 on
the interval (0, 1). The asymmetry that this implies for
the 80:20 decision rule is clear in Figure 3. The mean
distinct regions μ< 0.4, 0.4≤μ≤ 0.7 andμ< 0.7 char-acterised by the thresholds 0.4 and 0.7 for the mean, that determined whether the intervention was likely to be effective. The divisions between regions were mapped onto the opinion space by solving equations (4)-(6) using the constraint thatμ(a+b) =a. For instance forμ
= 0.7 andu= 0, thenb = 0.7 andd= 0.3 and whend=
0 then u=3/7 and u=4/7; these points define the
intersections between the upper division boundary with the lower and right edges of the ternary plot in Figure 3.
3.10 Hypothesis testing
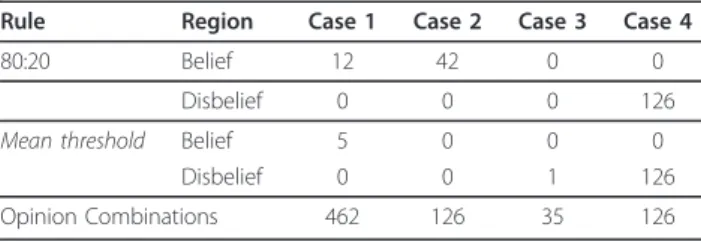
The exhaustive permutation test described in Section 3.6 was applied to each of the test cases. This gave 462, 126, 35 and 126 combinations of opinions for the four cases that used respectively 6, 5, 4 and 5 expert clinical
asses-sors. The belief, disbelief and uncertainty for all the
combinations of opinion were estimated for each of the four cases and plotted along with the decision rules in Figure 3.
The ‘cloud’ of points for each case represents the
variability due to the range of opinions expressed by the expert assessors. Where there were considerable differ-ences of opinion, for instance for case 1, there was a much wider spread of points than where there was over-all agreement amongst the experts about the likelihood of success of the intervention, for instance for case 2 or
4. It is instructive to look at one particular opinion tri-plet to more fully understand the meaning of the tern-ary plots.
For case 1, the opinion triplet π= {0.712,0.211,0.077} located towards the lower right hand vertex of the tern-ary plot has very high belief and low uncertainty. This is the opinion associated with six replicates of the assess-ment of clinical expert 3 for case 1 (see Table 1), who had a strong belief that the patient would get signifi-cantly better after treatment. If this expert assessor were
indeed representative of the wider population of experts, then it would certainly be unethical for the patient to be recruited to the trial and consequentially the opinion for this potential scenario is located to the right of the 80:20 andmean thresholddecision rules.
Labelling the regions to the lower right and lower left of the plots to the right and left of the 80:20 and mean threshold decision rule partition curves as the‘belief’ and‘disbelief’regions, allows us to count the number of opinions falling within these regions for each case and rule; see Table 2. Defining the null hypothesis to be that a case should not be recruited to the trial, Table 2 pro-vides evidence for this hypothesis and suggests appropri-atep-values based on the 80:20 rule for the four cases to be 0.026 (i.e. 12/462), 0.333, 0.000 and 1.000 and based
on the mean threshold rule to be 0.011 (i.e. 5/462),
0.000, 0.029 and 1.000. Testing at the 5% level (two-sided) indicates that for the 80:20 rule cases 1 and 3
would be eligible for recruitment and for the mean
threshold rule cases 1, 2 and 3 would be eligible for recruitment. For this decision making process to have some validity, the decision rule and the significance level would clearly need to be stated before data collec-tion was undertaken.
4 Conclusions
We describe a statistical framework for the assessment of clinical uncertainty, as a prelude to a clinical trial and demonstrate, using data from the UK Heel Fracture Trial, how expert opinions can be pooled, modelled and presented on a ternary plot that represents an opinion space. Individual cases can then be assessed in relation to decision rules mapped onto the opinion space, pro-viding clear and rapid decisions regarding trial eligibility. The methodology has potential to identify eligible patients and assist in the simplification of eligibility cri-teria which might encourage greater participation in clinical trials.
Methods for the assessment of clinical uncertainty, as a prelude to a clinical trial, have been suggested pre-viously [10,11]. However, the methodology described here is the first attempt at a structured statistical frame-work to undertake this type of analysis. Beta
distributions were fitted to assessments of the likely effectiveness of an intervention elicited from a virtual panel of experts and pooled using methods familiar to exponents of determining expert probabilities [19]. Opi-nions were expressed using previously suggested [15] definitions of belief, disbeliefand uncertainty that we believe fully characterised the clinical expert assess-ments. Our analysis restricted the choice of Beta
distri-butions for modelling to unimodal forms (a≥1 andb≥
1). This was not a concern for the examples described here or indeed more widely for other data we have explored in the setting of surgical trials. However, it is in principle possible in other applications that the most likely assessment of clinical effectiveness of an
interven-tion is that a patient would either get much betteror
much worsewith any other outcome being extremely unlikely. In this setting belief, disbeliefanduncertainty as expressed in equations (4)-(6) would not be defined. For the data presented here the Beta model proved to be the most informative, however where this is not the case the nonparametric methods described, based on estimated means and standard deviations, provide useful alternatives for any distribution on the interval [0,1]. Although the examples described here all use seven point likert type scales for elicitation, the statistical fra-mework introduced would work equally well with any type of ordered categorical assessment scale.
Expert opinions are pooled here using multiplicative methods [19], as we felt that this best represented clini-cal equipoise [24] and the views of the experts consulted for the example data; i.e. that all experts opinions were ‘correct’and the pooling should represent the consensus based on the intersection of beliefs. However, our view is pragmatic and we see no reason why additive pooling could not be used in preference to multiplicative pool-ing, particularly if it was felt that the latter method was giving too much weight to the assessment of one or more‘over-confident’individual experts.
We have presented significance tests at the 5% level to assess whether a patient might ethically be recruited to a trial. Our selection of this level for the tests was some-what arbitrary and clearly this could be set, prior to ana-lysis, at a higher or lower level for a different application or a less formal procedure adopted if necessary. The 80:20 rule [20], which is based on some empirical evi-dence, was selected as a standard for decision making
regarding recruitment. The alternativemean threshold
rule, as well as being intuitively reasonable, was sug-gested in part to encourage some debate as to what form the decision rule should take for different cases and in various settings. This is clearly an area that requires additional research.
The focus of this paper has been on developing tools for improving recruitment to trials. For those patients
Table 2 Opinion counts by case, decision region and rule, and the total number of opinion combinations available for the exhaustive permutation test
Rule Region Case 1 Case 2 Case 3 Case 4
80:20 Belief 12 42 0 0
Disbelief 0 0 0 126
Mean threshold Belief 5 0 0 0
Disbelief 0 0 1 126
deemed eligible for recruitment who decide to enter an RCT, it would seem natural to use the expert evidence elicited through this process as a clinical prior, based on subjective opinion, in a formal Bayesian analysis [14].
The methodological framework discussed here has provided additional insight that would otherwise have not been available for the heel fracture trial. Although, clearly this methodology will need to be assessed in future studies to identify whether it can actually deliver improvement in trial recruitment rates. The methodolo-gical framework we describe is currently limited to two-arm trials, although we see no reason why this could not be extended to more than two treatment groups. The opinion pooling we describe is appropriate for situations where individual expert opinions may differ to a moderate or large extent, but it is not at all clear that pooling opinions where for instance experts have totally
opposing views (100% belief ordisbelief in treatment
effectiveness) would be appropriate, as the pooled opi-nion would in reality represent no individual expert’s opinion. Therefore we would recommend the methodol-ogy be limited to only those scenarios of the former rather than the latter type. Although we have focussed on surgical trials, we would expect the methodology described here to be applicable to any RCT where recruitment was problematic. The methodology also has clear application in pilot studies where feasibility is being assessed and also potentially as a support tool for inclusive trials where patients are allowed to select an intervention as well as being randomised in a conven-tional manner [25].
Acknowledgements
The UK Heel Fracture Trial was funded by Arthritis Research UK (UK HeFT Trial Grant 15964). AG acknowledges support of his contribution to this work through the MATCH programme (EPSRC Grant GR/S29874/01) and YK acknowledges the support of Warwick Medical School (University of Warwick) for PhD sponsorship.
Author details 1
Warwick Medical School, University of Warwick, Coventry, CV4 7AL, UK. 2Department of Public Health, Epidemiology and Biostatistics, University of Birmingham, Birmingham, B15 2TT, UK.
Authors’contributions
DG, chief investigator for the UK Heel Fracture Trial, and YK developed the original concepts for the study. NP developed the statistical methodology, with input from YK and AG, and wrote the first draft of the paper. All authors contributed to the paper during development and read and approved the final version of the manuscript.
Competing interests
The authors declare that they have no competing interests.
Received: 25 July 2011 Accepted: 13 December 2011 Published: 13 December 2011
References
1. Boutron I, Ravaud P, Nizaed R:The design and assessment of prospective randomised, controlled trials in orthopaedic surgery.Journal of Bone and Joint Surgery (British)2007,89:858-863.
2. Horton R:Surgical research or comic opera: questions, but few answers. Lancet1996,347:984-985.
3. McCulloch P, Taylor I, Sasako M, Lovett B, Griffin D:Randomised trials in surgery: problems and possible solutions.BMJ2002,324:1448-1451. 4. Halpern SD:Evidence-based equipoise and research responsiveness.
American Journal of Bioethics2006,6:1-4.
5. Freedman B:Equipoise and the ethics of clinical research.New England Journal of Medicine1987,317:141-145.
6. Chard JA, Lilford RJ:The use of equipoise in clinical trials.Social Science and Medicine1998,47:891-898.
7. Jaynes ET:Probability theory: the logic of scienceCambridge: Cambridge University Press; 2003.
8. Spiegelhalter DJ, Abrams KR, Myles JP:Bayesian approaches to clinical trials and health-care evaluationNew York: Wiley; 2004.
9. Kandane JB, Wolfson LJ:Experiences in elicitation.The Statistician1998, 47:3-19.
10. Lilford R:Formal measurement of clinical uncertainty: prelude to a trial in perinatal medicine.BMJ1994,308:111-112.
11. Young J, Harrison J, White G, May J, Solomon M:Developing measures of surgeons’equipoise to assess the feasibility of randomized controlled trials in vascular surgery.Surgery2004,136:1070-1076.
12. Parmar MKB, Griffiths GO, Spieglelhalter DJ, Souhami RL, Altman DG, van der Scheuren E:Monitoring of large randomised clinical trials: a new approach with Bayesian methods.Lancet2001,358:375-381. 13. Parmar MKB, Spiegelhalter DJ, Freedman LS:The chart trials: Bayesian
design and monitoring in practice.Statistics in Medicine1994, 13:1297-1312.
14. Spiegelhalter DJ, Freedman LS, Parmar MKB:Bayesian approaches to randomized trials.Journal of the Royal Statistical Society, Series A1994, 157:357-416.
15. Jøsang A:Artificial reasoning with subjective logic.InProceedings of the Second Australian Workshop on Commonsense Reasoning: December 1997; PerthEdited by: Nayak A, Pagnucco M .
16. Jøsang A:A logic for uncertain probabilities.International Journal of Uncertainty, Fuzziness and Knowledge-Based Systems2001,9:279-311. 17. Evans M, Hastings N, Peacock B:Beta Distribution.Statistical Distributions.3
edition. New York: Wiley; 2000, 34-42.
18. Genest C, Zidek JV:Combining probability distributions: a critique and an annotated bibliography.Statistical Science1986,1:114-135.
19. O’Hagan A, Buck CE, Daneshkhah A, Eiser JR, Garthwaite PH, Jenkinson DJ, Oakley JE, Rakow T:Uncertain Judgements: Eliciting Expert Probabilities Chichester: John Wiley and Sons; 2006.
20. Johnson N, Lilford RJ, Brazier W:At what level of collective equipoise does a clinical trial become ethical?Journal of Medical Ethics1991, 17:30-34.
21. Efron B, Tibshirani R:An introduction to the bootstrapBoca Raton, Florida: Chapman and Hall/CRC; 1993.
22. R Developmental Core Team:R: A language and environment for statistical computing.R Foundation for Statistical Computing, Vienna, Austria; 2010 [http://www.R-project.org].
23. Venables WN, Ripley BD:Modern applied statistics in s-plus.4 edition. New York: Springer; 2002.
24. Lilford R, Jackson J:Equipoise and the ethics of randomization.Journal of the Royal Society of Medicine1995,88:552-559.
25. Torgerson D, Sibbald B:Understanding controlled trials: What is a patient preference trial?BMJ1998,316:360.
doi:10.1186/1745-6215-12-258