Geosciences Theses Department of Geosciences
12-14-2016
GEOGRAPHIC VARIATION OF RADON GAS
CONCENTRATIONS IN RELATIONSHIP TO
HOUSING CHARACTERISTICS IN DEKALB
COUNTY, GEORGIA
Fredrick Neal
Follow this and additional works at:https://scholarworks.gsu.edu/geosciences_theses
This Thesis is brought to you for free and open access by the Department of Geosciences at ScholarWorks @ Georgia State University. It has been accepted for inclusion in Geosciences Theses by an authorized administrator of ScholarWorks @ Georgia State University. For more information, please [email protected].
Recommended Citation
Neal, Fredrick, "GEOGRAPHIC VARIATION OF RADON GAS CONCENTRATIONS IN RELATIONSHIP TO HOUSING CHARACTERISTICS IN DEKALB COUNTY, GEORGIA." Thesis, Georgia State University, 2016.
TO HOUSING CHARACTERISTICS IN DEKALB COUNTY, GEORGIA
by
FREDRICK B. NEAL
Under the Direction of Dajun Dai, PhD
ABSTRACT
Radon (RN-222), naturally released from underground, is the second leading cause of
lung cancer for at-risk groups after smoking, and the leading cause of lung cancer. This research
aims to investigate the relationship between housing characteristics and indoor radon levels.
Indoor radon data (1993 – 2013) were obtained from the DeKalb County Board of Health
alongside housing characteristics sourced from the DeKalb County Tax Assessor. Chi-square
tests, logistic regression, and bivariate analysis were used to examine the housing risk factors.
The results indicate a correlation between high radon concentrations, and homes constructed of
brick, with a basement foundation and centralized heating and air systems. Analysis of
geological data revealed no significant connection to elevated radon levels.
TO HOUSING CHARACTERISTICS IN DEKALB COUNTY, GEORGIA
by
FREDRICK B. NEAL
A Thesis Submitted in Partial Fulfillment of the Requirements for the Degree of
Master of Science
in the College of Arts and Sciences
Georgia State University
Copyright by Fredrick Butler Neal
TO HOUSING CHARACTERISTICS IN DEKALB COUNTY, GEORGIA
by
FREDRICK B. NEAL
Committee Chair: Dajun Dai
Committee: Jeremy Diem
Daniel Deocampo
Electronic Version Approved:
Office of Graduate Studies
College of Arts and Sciences
Georgia State University
DEDICATION
I want to first thank the members of my committee Dr. Dajun Dai, Dr. Jeremy Diem, and
Dr. Daniel Deocampo. I would like to thank Dr. Dajun Dai for his help and guidance throughout
the development of this study and my time at Georgia State as a whole. He has always shown an
interest in my academic progress and I will always be grateful. I also want to thank Dr. Diem
who greatly influenced me to enter the graduate program at Georgia State. I dedicate this thesis
to my wife Xanthe. She has always been my biggest supporter throughout my entire time in
graduate school. Without her support, I would not have been able to complete this work. She
has picked up the slack many a late night and long day while I worked on my course work and
this thesis. My two children Ottmah and Camille provided me with the motivation to begin
school again and to continue my studies further once my undergraduate degree was obtained.
Lastly, I dedicate this work to my mother and sister, who set the example to achieve higher
education and for all of their love and patience. I am truly surrounded by a strong and loving
ACKNOWLEDGEMENTS
I wish to thank my committee members for all the time and assistance they have afforded
me during this process. I would like to formally thank Ryan Cira for giving me the opportunity
to work on the dataset at the DeKalb County Board of Health (DCBOH) and the permission to
use that dataset for this study. Ryan was always willing to answer any question, no matter how
small. I also want to thank Mandy Seaman for aiding me while I was at the DCBOH.
Additionally, I would like to thank The DeKalb County Tax Assessor and GIS Department for
their data contributions. I would also like to acknowledge Timothy Dignam (CDC,
TABLE OF CONTENTS
ACKNOWLEDGEMENTS ... v
LIST OF TABLES ... viii
LIST OF FIGURES ... ix
1 INTRODUCTION... 1
1.1 Risk Factors ... 2
1.1.1 Geology of Radon Prone Areas ... 2
1.1.2 Soil Permeability ... 2
1.1.3 Foundation Type ... 3
1.1.4 Housing Type ... 4
1.1.5 Construction Type ... 4
1.1.6 Year of Construction ... 5
1.1.7 Seasonality and Heating Systems ... 5
1.2 Research Question ... 6
1.3 Significance of the Research ... 7
2 Data and Methods ... 8
2.1 Study Area ... 8
2.2 Data ... 10
2.3 Chi-square Testing ... 17
3 RESULTS ... 18
3.1 Sampling Sites ... 18
3.2 Chi-square Tests ... 22
3.3 Logistic Regression Analysis ... 25
4 Discussion... 26
4.1 Research Question ... 26
4.2 Geology ... 27
4.3 Foundation ... 28
4.4 Building Materials ... 29
4.5 Housing Type ... 29
4.6 Heating and Cooling Systems ... 30
4.7 Limitations ... 30
5 Conclusions ... 31
LIST OF TABLES
Table 1 Summary of Variables ... 13
Table 2 Foundation Chi-square Test Results ... 23
Table 3 Construction Type Chi-square Test Results ... 23
Table 4 Heating Chi-square Test Results... 23
Table 5 House Type Chi-square Test Results ... 24
Table 6 Geologic Formations Chi-square Test Results ... 24
Table 7 Age of Home Bivariate Analysis Results ... 24
Table 8 Logistic Regression Results ... 25
LIST OF FIGURES
Figure 1 Map of Atlanta MSA ... 9
Figure 2 Radon Testing Kit... 10
Figure 3 Radon Testing Kit... 11
Figure 4 Radon Level Histogram and Radon Natural Log Levels Histogram ... 13
Figure 5 Box Plot for Foundation Type ... 14
Figure 6 Box Plot for Construction Type ... 14
Figure 7 Box Plot for House Type ... 15
Figure 8 Box Plot for Heat System Type ... 15
Figure 9 Box Plot for Geologic Formation ... 16
1 INTRODUCTION
High indoor concentrations of radon gas represent a substantial health hazard to residents
in geographic regions where uranium-rich geologic formations are prevalent. Literature
suggested that an upwards of 90 percent of lung cancer cases are a result of cigarette smoking
(Khan, et al., 2011; IARC, 2004). However, radon gas within the indoor air environment is
believed to be the second leading cause of lung cancer (Gray, et al., 2009) after smoking and the
leading cause among non-smokers. Some studies have concluded that heavy exposure to the gas
over time increases the odds of developing lung cancer (Field & Withers, 2012; Krewski, et al.,
2006). The World Health Organization estimates that lung cancer rates are attributable to radon
ranges from 3 to 14%; based on the average radon concentration in each country measured and
the calculation methods involved. Radon gas occurs naturally; emanating from bedrock, soil,
and from common household building materials (Abd El-Zaher, 2013; Miles, 1998). Radon is
tasteless, odorless, and colorless, therefore making it undetectable other than through
surveillance devices (Drolet, et al., 2013). The EPA recommends that radon concentrations are
dangerous when above 4 pCi/L, however, literature has concluded that there are possible health
risks associated with mid to lower levels of radon at or above 2.7 pCi/L (Brauner, et al., 2012).
The annual United States death toll attributed to radon is estimated to be nearly 21,000 people
per year (EPA, 2016). However, awareness of the risks are low and since the connection has
been made between radon exposure and negative health outcomes during the 1980’s, the national
radon program has seen a gradual reduction of funding and, as a result, there has been little
headway made in new-home construction mitigation systems, public building monitoring, and a
1.1 Risk Factors
1.1.1 Geology of Radon Prone Areas
Bedrock formations account for a varying percentage of high radon concentrations across
terrain and groundwater (Appleton & Miles, 2010; Ravikumar, et al., 2014). Radon – 222
(222Rn) is one of three natural radon isotopes (the only one that poses a health risk) that is the
product of the decay of radium-226 (226Ra). Both of the aforementioned are daughter elements
of uranium – 238 (238U) (Drolet, et al., 2013). Numerous studies have included underlying
geology as a predictor for hazardous indoor radon concentrations (Andersen, et al., 2007; Drolet,
et al., 2013; Kitto & Green, 2008). One of the ways for a structure to have a high concentration
of radon is that there is a source of uranium in the underlying geologic formations of granite,
gneiss, sedimentary, or sedimentary fault; with granite being the most potent (Farah, et al., 2012;
Minda, et al., 2009; Park, et al., 2011). Additionally, carbonate rocks (a class of sedimentary
rocks), are formations that are prone to weathering known as karstification, resulting in extensive
cave systems that hold and transport high quantities of radon (Buttafuoco, et al., 2010; Kropat, et
al., 2014). Studies have concluded that a significant portion of indoor radon variation can be
attributed to underlying bedrock although other factors are shown to contribute as well
(Gundersen & Schumann, 1996; Ielsch, et al., 2010).
1.1.2 Soil Permeability
Soil permeability or texture is considered a predictive factor for high radon
concentrations. Soils that are sandy or gravely, are more permeable than finer soils, which have
been found to effectively block radon from rising into dwellings (Barnet, 2012; Borgoni, et al.,
2011). Dry or cracked soils have been linked to higher radon variability because it increases soil
permeability is when basement and foundation types come into direct contact with
aforementioned soil types, affecting the likelihood of high radon concentrations (Johner &
Surbeck, 2001). Regions with underlying bedrock of crystalline rocks and karst formations are
shown to have higher concentrations of radon, however, soil permeability is considered the
primary surficial deposit responsible for the migration of radon from bedrock into the basements
and substructures of houses and commercial buildings alike (Chen, et al., 2013; Hauri, et al.,
2012). Additionally, fractures in the underlying deposits, water table level, and saturation are
variables that contribute to the mobility of radon (Thomas, et al., 2011; Drolet, et al., 2013).
Sandy or gravely soils are more permeable, allowing radon to easily flow through to the surface
where finer organic soil types such as silt or clay, form near-impermeable barriers to radon
migration in structures where the foundation has not penetrated through the soil layer (Cosma, et
al., 2013; Szabo, et al., 2013).
1.1.3 Foundation Type
Radon comes from beneath the surface and therefore foundation type has an effect on the
level of radon concentration within a home, particularly the lowest levels (Barros-Dios, et al.,
2007). One vein of thought is that a different foundation type (basement, crawl space, and
concrete slab) has a meaningful impact on variations of high residential radon concentrations
(Brauner, et al., 2013). Basements are subterranean whereas concrete slabs are built flush to the
surface and crawlspaces are above ground enclosures with dirt floors. Other studies suggest that
homes with a basement or semi basement foundation are likely to have greatly increased levels
of radon when compared to levels found in homes with only slab foundations (Arvela, et al.,
2012; Alghamdi and Aleissa, 2014; Kitto & Green, 2008). Lower levels of structures are often
poorly ventilated which allows the gas to build up to harmful levels (Alghamdi & Aleissa, 2014,
dwellings that were in direct contact with the ground (concrete slab) than those with a basement
or crawl space (Borgoni et al., 2011, Andersen, C.E. et al.., 2007). Similarly, other research also
found that direct contact with the ground was a determining factor in higher radon concentrations
(Demoury et al., 2013). Basement water mitigation features such as sump pumps and perimeter
drains have been linked with high radon levels (Shendell et al., 2013, Smith, B. J. and Field, R.
W., 2007).
1.1.4 Housing Type
Residential architecture or number of stories may have a relationship with elevated radon
levels. Literature suggests that there is a relationship between variations of radon concentrations
and the architectural style of a home (Brauner, et al., 2013; Zhang, et al., 2007). Upstairs rooms
in a multi-story home and apartment buildings are shown to have a lesser amount of radon than
do single story homes (Sundal, et al., 2004). Freestanding houses typically have higher
concentrations of radon than do apartment buildings, in part, because of the lower levels in
houses (basements, kitchens, and dens) and their proximity to the ground (Borgoni, et al., 2011;
Demoury, et al., 2013). Studies have concluded that models that include house specific factors
along with other variables (Demoury, et al., 2013) can explain variation in radon levels.
1.1.5 Construction Type
The materials, from which homes are constructed such as porous concretes, are a source
of radon gas that, when combined with other sources, can pose a risk to inhabitants (Chauhan &
Kumar, 2013; Rafique, et al., 2011). Homes that are constructed from materials that contain
decaying radioactive uranium such as stones used for masonry walls are often found in regions
with that type of underlying geology (Lamonaca, et al., 2014; Demoury, et al., 2013). Studies
high levels of radon (Aykamis, et al., 2013; Rafique & Rathore, 2013; Sahoo, et al., 2011) In
addition to natural building materials, some artificially fashioned building materials such as
concrete release radon into the air of dwellings (Keller, et al., 2001). In one study, over 40 types
of human made building materials derived from natural substances were evaluated; coal slag
(abrasives and sealants) and coal slag concrete were found to be risky to use due their radon
exhalation, depending on the origin of the coal (Szabo, et al., 2013).
1.1.6 Year of Construction
Older homes are going to have higher concentrations of radon because they typically
have more cracks in flooring and the foundation and thus have higher risk of contamination
(Barros-Dios, et al., 2007; Borgoni, et al., 2011). One study was conducted on two hundred new
homes built in Denmark were monitored for radon and only 14% was found to have levels above
100 Bq/m3 (2.7 pCi/L) (Brauner, et al., 2013). Features synonymous with older housing such as
smaller rooms and poor ventilation have been found to be a precursor to high radon levels (>100
Bq/m3); older homes are often occupied by people that live a lifestyle of shutting the doors and
windows while working long days (Alghamdi & Aleissa, 2014; Smith & Field, 2007). Indeed,
older structures provide many pathways for gasses to seep in, but new buildings can be found to
have high concentrations regardless of geology. Some studies have concluded that if high radon
in new buildings is not primarily caused by underlying bedrock, then construction materials are
the likely cause (Park, et al., 2011)
1.1.7 Seasonality and Heating Systems
Variability in radon measurements can also be linked to seasonal changes and
meteorological factors (Kropat, et al., 2014; Alghamdi & Aleissa, 2014). Highly permeable soils
effectively locks radon in the soil; the atmospheric conditions of the summer work to release
stored radon in loose soils (Szabo, et al., 2013). Fluctuating soil exhalation rates caused by
differences in temperature, humidity, and air masses are all possible reasons to explain
variability of radon readings on a temporal scale (Zimnoch, et al., 2014). In contrast, some
studies have concluded that elevated concentrations have been found to be higher during winter
months due to a combination of a lack of air circulation and shut windows and doors (Badhan, et
al., 2012; Denman, et al., 2007; Fujiyoshi, et al., 2013). Additionally, literature concludes that
there is a positive correlation between outdoor barometric pressure, low indoor humidity, and
outdoor temperature and indoor radon levels during winter months when pressure is typically
higher and temperature is lower. (Xie, et al., 2015). Heating and ventilation systems have been
included as determining factors for elevated radon concentrations for the possibility of spreading
radon containing dust in a home (Alghamdi & Aleissa, 2014; Steck, 2009). Highly energy
efficient homes may ultimately lead to less air exchange with the outside environment, trapping
radon inside (Lugg & Probert, 1997).
1.2 Research Question
The materials presented in this paper will attempt to determine what housing factors are
correlated to indoor residential radon levels greater than 4 picocuries per liter (pCi/L). The focus
of the analysis will be on housing characteristics and to the geogenic radon potential of
underlying bedrock prevalent in DeKalb County. It is important to gain a better understanding of
the conditions that are most likely to result in levels that are detrimental to human health. The
study will seek to answer the following questions: What housing characteristics and geologic
1.3 Significance of the Research
Health problems that arise from radon gas are insidious in nature and are hard to trace.
Furthermore, the hazard severity of radon is not apparent to the general public and is not a
prominently discussed danger or risk. There are two main points of significance that can be
attributed to this research: Identifying what housing factors that result in higher radon
concentrations can be utilized to predict residences that are more likely to contain the gas.
Accurate predictions would prove useful for public awareness campaigns that target at-risk
households. Another significance use for this research could be to shape state and local building
codes so that mitigation efforts can be installed during the construction process. The
combination of targeted awareness campaigns, pre-existing structure testing, and pre-emptive
mitigation efforts will decrease the radon exposure risk to the public and lead to a reduction in
2 DATA AND METHODS
2.1 Study Area
DeKalb County is the third most populous county in the state of Georgia, with an
estimated population of 713, 340 according to the 2010 U.S. Bureau. It is also one of the
primary counties that make up the greater Atlanta area, spanning over 267.58 square miles.
DeKalb County is a site worth studying due to its status as a region with high geogenic radon
potential, with underlying geologic formations of granite and gneiss granite which are known to
contain and emit the gas (Borgoni et al., 2013, Lamonaca et al., 2014). The county is home to a
large exposed granite formation named Stone Mountain which could be considered indicative of
a region of high radon concentration. Unique compared with much of the United States, is the
availability of the free radon surveillance system the DeKalb County Board of Environmental
Health has been maintaining since 1993. The system is voluntary to any home owner in the
county and for the purposes of this study 4,302 data points ranging from 1993 to 2014 were
extrapolated. This large data source will provide the basis for GIS and statistical analysis of
Figure 1 Map of Atlanta MSA
2.2 Data
The data set used in this study was obtained from the DeKalb County Board of Health’s
(DCBH) radon surveillance system. The DCBH system began conducting radon tests in
residential structures in 1993. The test is free so long as the home is owned by the person that
makes the request. Two tests are administered in each residence: one test is placed in the lowest
lived in room of the home (usually the basement), and the other in another first level room of the
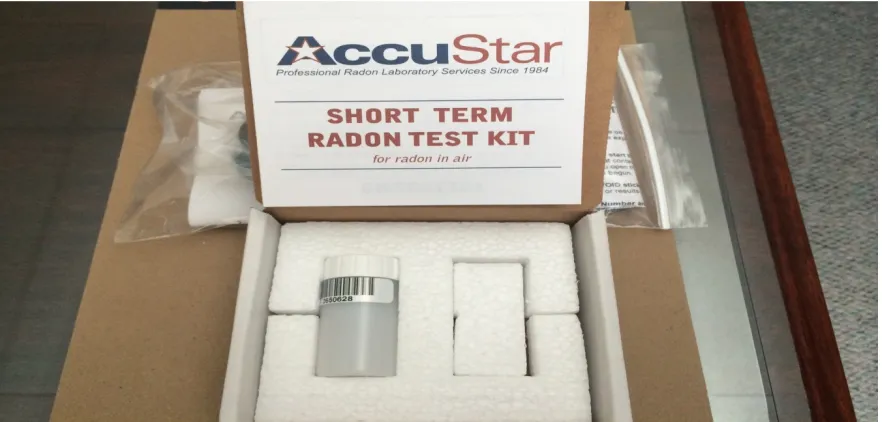
dwelling. The tests are cylindrical or hockey puck-like canisters containing activated charcoal,
which absorbs radon over the course of approximately 48 hours. The canisters are collected and
[image:21.612.73.507.315.632.2]then sent off to the test manufacturer’s lab for analysis and results.
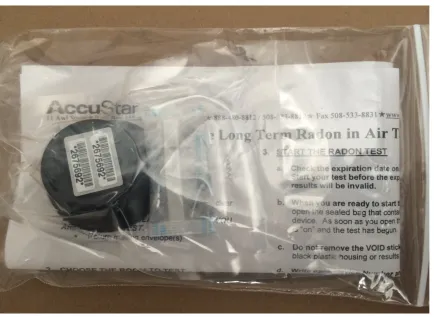
Figure 2 Radon Testing Kit
Figure 3 Radon Testing Kit
Accustar (PicoCan 275) activated carbon, short-term radon test kit used for sampling by the DeKalb County Board of Health.
The raw data set was reviewed for discrepancies, duplicates entries and data omissions.
Using 2014 as the cut-off date, there were 4,302 total records of which 3,905 were suitable for
analysis. Each address was geo-coded in ArcGIS 10.3 (ESRI, Redlands, CA) so that coordinates
for each test site could be ascertained for mapping purposes. The age of a home and what type
of heating system were taken from the DeKalb County Tax Assessor database. A county-wide
map of underlying bedrock was generated using data obtained from the United States Geological
Survey. A histogram was generated to determine how the radon concentrations are distributed.
A natural log transformation was applied to the variable in an attempt to normalize distribution.
Every value was added one in order to avoid zeros in the log transformation. A natural log
transformation of the EPA criterion plus one is 1.61, which can be used as the reference value for
the interpretation of the box plots. Box and whisker plots were plotted to identify difference in
relationship between the age of a home and elevated radon levels. Optimized hot-spot analysis
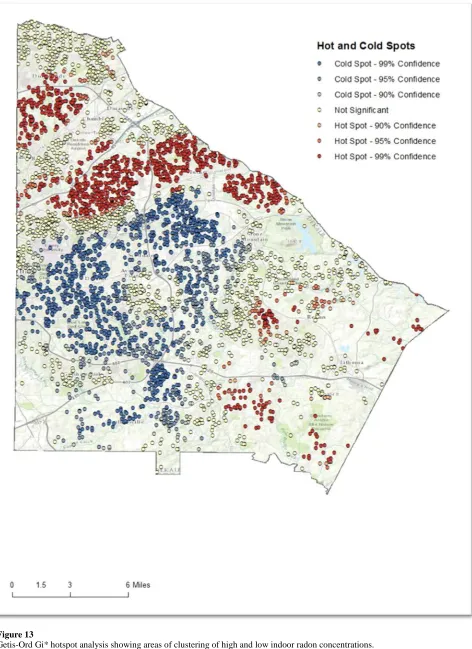
(Getis-Ord Gi* hotspot analysis) was employed to identify areas of the county where clusters of
high and low radon concentrations are present. Getis-Ord Gi* calculates Z-scores and P values
to measure statistical significance where higher Z-scores indicate more intense clustering.
Three subsets of housing characteristics were chosen from the data available: foundation
type, housing type, construction type, and heating and cooling. For foundation type, there are six
variables: basement, crawlspace, and slab. In the dataset, there are combinations of the
aforementioned foundation types such as basement-crawlspace, basement-slab, and
crawlspace-slab. Construction type is divided into brick, fame, and concrete block and a combination of the
three. Building type consists of: ranch, multi-story and split-level homes and combinations of
the three. Heating and cooling systems are broken into four: no heat, non-central heat,
centralized heat, and central heat and air. The age of a home was chosen as a factor to examine.
The geology of study area was divided into the following subtypes: biotite gneiss, granite,
Figure 4 Radon Level Histogram and Radon Natural Log Levels Histogram
Table 1Summary of Variables
Table displaying the different categories of dichotomized predictive factors analyzed by a Chi-square test. The age of a home was non-dichotomized and was analyzed using bivariate analysis.
CATEGORY
FOUNDATION BASEMENT CRAWL
SPACE SLAB
BASEMENT/ CRAWLSPACE CRAWLSPACE/ SLAB BASEMENT/ SLAB CONSTRUCTI0N
TYPE BRICK FRAME BLOCK FRAME BRICK/
BRICK/ BLOCK
FRAME/ BLOCK
HOUSE TYPE RANCH MULTI SPLIT RANCH/
MULTI RANCH/ SPLIT MULTI/ SPLIT HEATING & COOLING NO HEAT NON-CENTRAL HEAT CENTRAL HEAT CENTRAL HEAT & AIR
GEOLOGY BIOTITE
GNEISS GRANITE
GRANITE
GNEISS MICA SCHIST QUARTZITE SCHIST
ULTRAMAFIC INTRUSIVE
ROCK
HOUSE AGE AGE
PRESENT = 1, NOT-PRESENT = 0
[image:24.612.89.298.70.291.2]Figure 4a Radon Level Histogram: Distribution of radon concentration test results.
Figure 4b Radon Natural Log Levels Histogram
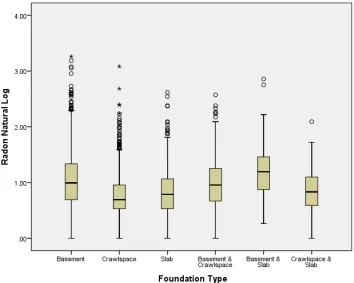
[image:24.612.66.560.399.650.2]Figure 5 Box Plot for Foundation Type
Box plots of radon levels (natural log) by foundation type.
Figure 6 Box Plot for Construction Type
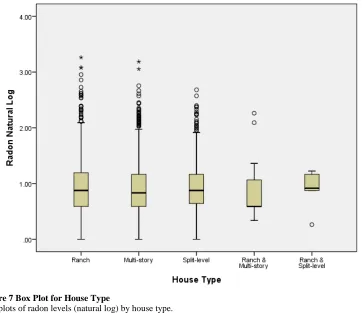
[image:25.612.130.486.391.682.2]Figure 7 Box Plot for House Type
Box plots of radon levels (natural log) by house type.
Figure 8 Box Plot for Heat System Type
[image:26.612.124.489.142.660.2]Figure 9 Box Plot for Geologic Formation
Box plots of radon levels (natural log) by foundation type.
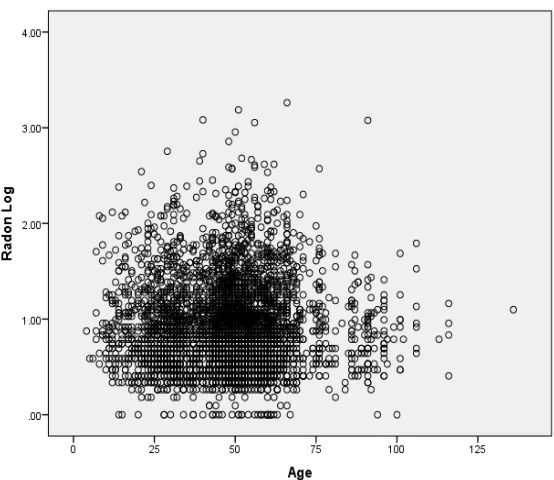
Figure 10 Scatter Plot for Age of Home
[image:27.612.192.469.495.735.2]2.3 Chi-square Testing
Chi-square tests were performed on each housing characteristic and geologic type to
determine if there was a statistical significance with radon levels above 4 pCi/L. A two sided
asymptotic figure below.05 is indicative of a statistical significance among the variables and
radon. Additionally, a Phi Cramer V symmetric measure was calculated to determine the
strength of the statistical relationship. The Phi measure was utilized because the Chi-square test
resulted in a two-by-two cross table. Bivariate analysis was run on the scaled value of age of
home to test for significance.
2.4 Logistic Regression Analysis
A logistic regression model was applied to ascertain the effects of housing characteristics
on indoor radon concentrations. As mentioned above, the categorical, non-linear nature of the
dataset necessitates the use of the model Housing characteristics were converted into binary and
divided into housing type, foundation type, construction type, and heating system. The
dependent variable is a binary value based on radon concentration measured in picocuries per
liter (pCi/L) as either 1 or 0. For the purpose of this study, any radon measure of 4 pCi/L or
3 RESULTS
3.1 Sampling Sites
The map (Figure 11) produced from radon test results provides an overview of the spatial
distribution of the sampling. Visually examining the map, the sampling is concentrated in the
central and northern areas of the county. There is a noticeable drop off in screening in the
southwest and southeastern areas of the county. These two areas are more sparsely populated
then the rest of DeKalb County. Additionally, the households in these areas are generally lower
income compare with the northern part of the county. The map (Figure 12) produced form
USGS geological data shows large swaths of Biotite Gneiss along the northern and middle
portion of the county and there is a large deposit of Schist along the southern portion of DeKalb.
The hot spot map (Figure 13) shows clustering along the mid-northern part and in some areas of
the county. Hot-spots with a confidence interval of 99% reside in the northern and in small
pockets in the southeastern part of the county. Significant cold-spot clusters are located in a
band across the central part of the county and a small pocket in the south-central section of
Figure 11
Figure 12
Figure 13
3.2 Chi-square Tests
The results of Chi-square testing for foundation type found that basement, crawlspace,
and basement mixed with concrete slab were all statistically significant with values of .000, .000,
and .002 respectively. The strengths of the significances (Phi) were .131, -.135, and .05 which
are not strong measures. Brick (sig .002) and frame (.006) were shown to be significant to
elevated radon concentrations. The associations were weak with Phi scores of .05 and -.044.
Homes that have no heating system were found to be significant (.004) but had a very weak Phi
value of .034. None of the characteristics in the housing type group or geology were found to be
statistically significant. Bivariate analysis results of age of home were not significant with a
Table 2 Foundation Chi-square Test Results
Chi-square test results for foundation factors relating to radon concentrations (Log transformed) above 4 pCi/L.
Basement Crawlspace Slab Basement &
Crawlspace Basement & Slab Crawlspace & Slab
Asymp. Sig.
(2-sided) .000 .000 .120 .505 .002 .055
Pearson
Chi-Square 67.195 71.37 2.412 0.445 9.707 3.672
[image:34.612.77.484.253.377.2]Phi 0.131 -.135 -0.025 0.011 0.05 -0.031
Table 3 Construction Type Chi-square Test Results
[image:34.612.72.350.431.548.2]Chi-square test results for construction materials relating to radon concentrations (Log transformed) above 4 pCi/L.
Table 4 Heating Chi-square Test Results
Chi-square test results for heating and cooling systems relating to radon concentrations (Log transformed) above 4 pCi/L.
Brick Block Frame Brick &
Block Brick & Frame Frame & Block
Asymp. Sig.
(2-sided) .002 .165 .006 .086 .302 .632
Pearson
Chi-Square 9.64 1.927 7.653 2.947 1.067 0.23
Phi 0.05 -.022 -0.044 0.027 -0.017 0.008
No Heat Heat Non-
Central Central Heat Heat & AC Central
Asymp. Sig.
(2-sided) 0.04 0.715 0.634 0.707
Pearson
Chi-Square 4.207 0.134 0.227 0.141
Table 5 House Type Chi-square Test Results
[image:35.612.64.476.266.374.2]Chi-square test results for house type relating to radon concentrations (Log transformed) above 4 pCi/L.
Table 6 Geologic Formations Chi-square Test Results
Chi-square test results for underlying bedrock formations and their relationship to radon concentrations (Log transformed) above 4 pCi/L.
Table 7 Age of Home Bivariate Analysis Results
Bivariate analysis results for the age of a home and any relationship to radon concentrations above 4pCi/L.
Multi-story Ranch Split-level Multi-story &
Split-level Multi-story Ranch & Split-level Ranch &
Asymp. Sig.
(2-sided) .271 .895 .112 .427 .480 .480
Pearson
Chi-Square 1.211 0.017 2.526 0.632 0.499 0.499
Phi 0.018 .002 -0.025 0.013 -0.011 -0.011
Biotite
Gneiss Granite Granite Gneiss Schist Mica Quartzite Schist Ultramafic Intrusive
Asymp. Sig.
(2-sided) .618 .514 .834 .488 .800 .722 0.967
Pearson
Chi-Square 0.248 0.425 0.044 0.48 0.064 0.126 0.002
Phi -0.008 -.100 0.003 0.011 -0.004 -0.006 -0.001
AGE
Radon Pearson
Correlation
-.013
N = 4079 Sig. (2-tailed) .416
3.3 Logistic Regression Analysis
Logistic regression was run on the housing characteristics that were found to be
statistically significant to hazardous levels of radon in residences that were identified by
Chi-square testing. The Homer and Lemeshow test value of .972 shows that the model is a good fit.
A Nagelkerke R value of .063 reveals that the model explained 6.3 percent of radon
concentrations above 4 pCi/L. Homes that only have a basement foundation are statistically
significant (.001) at a .01 level and had an odds ratio of 1.595. Homes with basement
foundations are 1.6 times (rounded) more likely to have dangerous radon levels than those
without. The characteristic of crawlspace was significant (.000) with an odds ratio of .342. The
variable of the combination of basement and slab are statistically significant (.008) at the .01
level and had an odds ratio of 2.299. This can be interpreted that homes with a combination of
basement and slab foundations are 2.3 times more likely to have hazardous radon concentrations
than those without. The variable of brick, frame, and no heat we not found to be statistically
[image:36.612.74.418.518.667.2]significant.
Table 8 Logistic Regression Results
Logistic regression analysis results on factors with statistical significance. Homer & Lemeshow test is indicative of goodness of fit and Nagelkerke R tells how much the model explains radon variance for levels above 4pCi/L.
B S.E. Wald df Sig. Exp(B)
Basement .467 .146 10.271 1 .001 1.595
Crawlspace -1.073 .210 26.226 1 .000 .342
Basement & Slab
.833 .312 7.134 1 .008 2.299
Brick .211 .160 1.733 1 .188 1.235
Frame -.094 .196 .232 1 .630 .910
No Heat 1.812 1.417 1.636 1 .201 6.123
4 DISCUSSION
4.1 Research Question
What housing characteristics and geologic factors are associated with elevated
concentrations of indoor radon gas?
Based on the results of the radon analysis in this study, housing characteristics can
explain some, albeit small variations of indoor Rn-222. Air pressure and movement within a
home must directly affect how much gas is allowed to build up (Harnapp, et al., 1997; Keller, et
al., 2001). Each home will likely have variations in airflow, depending on a number and size of
entry and exit points (or lack thereof) unique to each site. The geogenic potential of radon is
undoubtedly a result of the presence of 226Ra within the underlying bedrock, which explains
indoor concentrations to some degree. In this study, the lack of reliable surficial deposit data
rules out soil type as a predicting factor as well. There are many factors like pressure
differential, seasonality, temperature, soil permeability and material exhalation that influence
radon concentrations and, therefore, housing characteristics are not strong predictors of elevated
indoor radon levels (Kitto & Green, 2008; Vasilyev & Zhukonsky, 2013; Xie, et al., 2015).
` For the presence of indoor radon gas, housing conditions and geogenic factors were
expected to be determinants. This thesis examined the influence of housing characteristics and
geological factors on radon levels. It raised the question: are housing characteristics and
geologic data effective predictors of indoor residential radon concentrations? The results
suggested that there is a relationship between homes with basements, and elevated radon levels.
Additionally, homes constructed of brick and had no heating system were also associated with
radon concentrations above 4 pCi/L. A home with a crawl space has a negative relationship with
The findings are consistent with results in literature where housing characteristics are
found to be connected to radon levels above 4 pCi/L (Borgoni, et al., 2011; Demoury, et al.,
2013; Hauri, et al., 2012). Consistent with other studies, proximity to soil is a primary factor for
high radon concentrations (Louro, et al., 2013; Smith & Field, 2007). The results of the study
did not match up to findings in studies that identified age of home as a determining factor for
radon (Barros-Dios, et al., 2007; Kropat, et al., 2014).
4.2 Geology
From a geologic perspective, almost all of DeKalb County is considered a high geogenic
risk for radon. The underlying geology of the county is consistent with other regions known to
be high risk zones. Despite the fact that the region is a high-risk zone, not all homes that lie
along formations associated with elevated levels of radon, such as granite, have dangerous levels
of the gas. Furthermore, it is possible to have hazardous levels found in homes that are located
in geographies that do not have bedrock formations expected to have high radon emissions. This
could be caused by the gradual build-up of the gas from radon containing building materials.
The lack of any significant correlation between the geology present in the region and residential
radon points to a possible link with the conditions of the homes.
The results of both bivariate and logistic regression showed no correlation between the
bedrock formations of DeKalb County, and high levels of the gas. The predominant theory is
that radon concentrations are the result of many variables, and simply the presence of the gas’s
precursors is not an effective predictor of hazardous levels within the indoor environment.
Another explanation is that soil permeability at the site of each home has an effect on radon
concentrations, provided there is geogenic potential (Hauri, et al., 2012; Szabo, et al., 2013).
into substructures through various entry points. For this study, accurate soil data was not
procured and therefore soil distribution was not considered a reliable variable.
4.3 Foundation
The foundation of a home proved to be the most influential factor in a home having a
hazardous radon concentration. Having a basement increases the likeliness that dangerous radon
levels could be present. Since radon enters homes from the ground, the presence of a basement
was expected to be a determinant of high concentrations (Alghamdi & Aleissa, 2014;
Barros-Dios, et al., 2007; Harnapp, et al., 1997). Furthermore, the gas can enter through cracks in the
foundation, floor drains, and sump drains, which are present in homes where water inundation in
the substructure is an issue (Shendell, et al., 2013; Smith & Field, 2007). It would be possible
that basements with cracked dirt floors and walls would be the most susceptible to gas entry.
However, there is no way to determine this because the data set does not differentiate between
basement conditions. The combination foundation of basement and slab explain a small amount
of radon concentration variance. This could be attributed to the presence of some sort of a
basement and very little to having a slab base structure.
In contrast to the positive relationship between having a basement and radon, the one
between having a crawlspace and radon is negative, almost completely opposite. Crawlspaces
are usually dirt floor and several feet high at best. Therefore, it was initially thought that would
lend to radon permeating the floor and affecting the lower levels of those homes. However, the
presence of a crawlspace and low levels of radon may be a result of indoor-outdoor pressure
differences, when the indoor air pressure environment releases gas to lower pressure outdoor air
4.4 Building Materials
Building materials accounted for single-digit variability of indoor radon concentrations.
Homes that were constructed of brick were more likely to have an elevated level than those
constructed of either wood or concrete block based on bivariate analysis. Brick is more
insulating than the other two mentioned materials and prevents more air exchange with the
outdoor environment (Keller, et al., 2001; Rafique, et al., 2011). The brick itself could be a
source of radon depending on the origin of the brick’s primary composition. As expected, homes
constructed of brick had a small positive relationship with high concentrations. Cracks and
fissure form along joists and intersections, allowing radon to leak in and build up over time, but
do not have an easy exit path (Brauner, et al., 2012; Vasilyev & Zhukovsky, 2013). Frame
housing was significant in that it was negatively correlated to increased radon levels. The
reasoning for this is likely due to the porous nature of wood and the less air-tight indoor air
environment it fosters.
4.5 Housing Type
Housing type or architectural style was not expected to have much of an influence on
indoor radon concentrations. Some studies have included building type as a factor for radon
levels above 4 pCi/L (Friedman & Groller, 2010; Yarmoshenko, et al., 2013). It was thought
that perhaps the construction materials or foundation types of certain architectural styles
indicative of homes built in DeKalb County could help to explain a home’s high radon level.
The results did not support this idea as none of the architecture styles were statistically
significant in bivariate or logistic regression analysis. In addition, a statistically significant
relationship between age of a home and radon was not identified despite being included in other
homes in DeKalb County were constructed in waves and there is not a lot of difference in the
average age of the homes, with the bulk of homes being constructed between 1955 and 1972.
4.6 Heating and Cooling Systems
Homes with no heating system at all had some association with radon levels above 4
pCi/L. The relationship is very small and cannot be considered to be of any real significance. A
home with no heating system is likely to have very little air movement and the windows and
doors are probably not left open.
4.7 Limitations
The conditions that lead to high radon concentrations are complex as they are varied.
One of the major limitations of this study is a lack of certain types of data. The effects of air
movement could have been better analyzed with indoor/outdoor pressure data. The condition of
the basement would aid in assessing the difference presented by finished and unfinished
sub-structures on radon levels. Additionally, an assessment of drains, sump pumps, and other
basement features would prove as useful data points. The lack of accurate soil maps were
limiting in that it is difficult to get a true idea of a test site’s soil permeability. Lastly, a detailed
map of test site footprints could be utilized to associate slope and other topographical features
5 CONCLUSIONS
Underlying bedrock can be used to determine the geogenic radon potential of a given area
only by proximity. A higher resolution geology map should be employed to predict radon levels
above 4 pCi/L. However, geological formations alone are not enough to predict high indoor
concentrations. The same could be said for solely using housing characteristics as predictive
factors as well. The conclusion drawn from the results of this study is that a home constructed of
brick and has a basement foundation is more likely to have high radon concentrations in an area
of high geogenic potential. That is to say that, for all areas homogeneous in radon exposure risk,
homes with these characteristics singularly or in combination, presents an elevated risk worth
administering a screening. Furthermore, homes with a basement foundation are particularly at
risk, especially those that are finished and frequently used.
The primary aim of this study was to predict residential radon levels greater than 4pCi/L
based on housing characteristics of homes previously tested and underlying geology. The
housing data available for this study did not prove particularly strong for predicting hazardous
dangerous gas concentrations. One take –away from this study is that in order to anticipate
radon gas levels, more data needs to be collected in addition to housing characteristics and
geological. Because the hazard presented by radon is due to the build-up of the gas in a
contained space, the movement of air should play an integral role in a structure’s indoor
make-up. Therefore, collecting differential pressure data between the outdoor and indoor environment
could be a determining factor in a predictive model. To build a more comprehensive soil map,
soil samples should be collected at each radon testing site. Soil samples would be analyzed to
determine permeability; accounting for seasonal differences that could affect exhalation.
Another possible determinant could be the slope of the parcel on which a structure is built on. A
assess the slope of the land at a test site. Mapping the footprint of a home would be necessary to
insure that slope calculated is representative of the land the structure rests on.
Due to its link to lung cancer and other respiratory illnesses, radon gas exposure poses a
marked health risk to the general public. The insidious nature of RN-222 merits further research
for determining factors. Future research for predictive factors in a logistic regression model
should include geology, soil permeability, differential air pressure and movement, housing
characteristics, and topographical features of sampling sites. Efficient prediction coupled with
comprehensive policy would go far in protecting the public from the potentially fatal effects of
prolonged radon exposure.
REFERENCES
Abd El-Zaher, Mohamed. 2013. ;A comparative study of the indoor radon level with the radon
exhalation rate from soil in Alexandria city;Radiation Protection Dosimetry 154
(4):490-496. doi: 10.1093/rpd/ncs267.
Alghamdi, A. S., and K. A. Aleissa. 2014. ;Influences on indoor radon concentrations in Riyadh,
Saudi Arabia; Radiation Measurements62:35-40. doi: 10.1016/j.radmeas.2014.01.010.
Andersen, C. E., O. Raaschou-Nielsen, H. P. Andersen, M. Linda, P. Gravesen, B. L. Thomsen,
and K. Ulbak. 2007. ;Prediction of Rn-222 in Danish dwellings using geology and house
construction information from central databases; Radiation Protection Dosimetry 123
(1):83-94. doi: 10.1093/rpd/ncl082.
Angell, W. J. 2008. ;The US radon problem, policy, program and industry: Achievements,
challenges and strategies; Radiation Protection Dosimetry 130 (1):8-13. doi:
10.1093/rpd/ncn105.
Appleton, J. D., and J. C. H. Miles. 2010. ;A statistical evaluation of the geogenic controls on
indoor radon concentrations and radon risk;Journal of Environmental Radioactivity 101
(10):799-803. doi: 10.1016/j.jenvrad.2009.06.002.
Arvela, H., O. Holmgren, and H. Reisbacka. 2012. ;Radon prevention in new construction in
Finland: a nationwide sample survey in 2009;Radiation Protection Dosimetry 148
(4):465-474. doi: 10.1093/rpd/ncr192.
Aykamis, A. S., S. Turhan, F. A. Ugur, U. N. Baykan, and A. M. Kilic. 2013. ;Natural
radioactivity, radon exhalation rates and indoor radon concentration of some granite
samples used as construction material in Turkey; Radiation Protection Dosimetry 157
Badhan, K., R. Mehra, and R. G. Sonkawade. 2012. ;Studying the Variation of Indoor Radon
Levels in Different Dwellings in Hoshiarpur District of Punjab, India; Indoor and Built
Environment 21 (4):601-606. doi: 10.1177/1420326x11419983.
Barnet, I. 2012. ;Indoor radon probability calculated from the Czech soil gas radon data in a grid
net for the European Geogenic Radon Map construction: test of feasibility; Environmental
Earth Sciences 66 (4):1149-1153. doi: 10.1007/s12665-011-1322-3.
Barros-Dios, J. M., A. Ruano-Ravina, J. Gastelu-Iturri, and A. Figueiras. 2007. ;Factors
underlying residential radon concentration: Results from Galicia, Spain; Environmental
Research 103 (2):185-190. doi: 10.1016/j.envres.2006.04.008.
Borgoni, R. 2011. ;A Quantile Regression Approach to Evaluate Factors Influencing Residential
Indoor Radon Concentration; Environmental Modeling & Assessment 16 (3):239-250. doi:
10.1007/s10666-011-9249-3.
Borgoni, R., V. Tritto, C. Bigliotto, and D. de Bartolo. 2011. ;A Geostatistical Approach to
Assess the Spatial Association between Indoor Radon Concentration, Geological Features
and Building Characteristics: The Case of Lombardy, Northern Italy; International Journal
of Environmental Research and Public Health 8 (5):1420-1440. doi:
10.3390/ijerph8051420.
Brauner, E. V., C. E. Andersen, M. Sorensen, Z. J. Andersen, P. Gravesen, K. Ulbak, O. Hertel,
C. Pedersen, K. Overvad, A. Tjonneland, and O. Raaschou-Nielsen. 2012. ;Residential
radon and lung cancer incidence in a Danish cohort; Environmental Research 118:130-136.
Buttafuoco, G., A. Tallarico, G. Falcone, and I. Guagliardi. 2010. ;A geostatistical
approach for mapping and uncertainty assessment of geogenic radon gas in soil in an area
of southern Italy; Environmental Earth Sciences 61 (3):491-505. doi:
10.1007/s12665-009-0360-6.
Chauhan, R. P., and A. Kumar. 2013. ;Radon resistant potential of concrete manufactured using
Ordinary Portland Cement blended with rice husk ash; Atmospheric Environment
81:413-420. doi: 10.1016/j.atmosenv.2013.09.024.
Chen, J., J. Ly, L. Bergman, J. Wierdsma, and R. A. Klassen. 2008. ;VARIATION OF SOIL
RADON CONCENTRATIONS IN SOUTHERN ONTARIO;Radiation Protection
Dosimetry 131 (3):385-389. doi: 10.1093/rpd/ncn192.
Cosma, C., A. Cucos-Dinu, B. Papp, R. Begy, and C. Sainz. 2013. ;Soil and building material as
main sources of indoor radon in Baita-Stei radon prone area (Romania); Journal of
Environmental Radioactivity 116:174-179. doi: 10.1016/j.jenvrad.2012.09.006.
Demoury, C., G. Ielsch, D. Hemon, O. Laurent, D. Laurier, J. Clavel, and J. Guillevic. 2013. ;A
statistical evaluation of the influence of housing characteristics and geogenic radon
potential on indoor radon concentrations in France; Journal of Environmental
Radioactivity 126:216-225. doi: 10.1016/j.jenvrad.2013.08.006.
Denman, A. R., R. G. M. Crockett, C. J. Groves-Kirkby, P. S. Phillips, G. K. Gillmore, and A. C.
Woolnidge. 2007. ;The value of Seasonal Correction Factors in assessing the health risk
from domestic radon- A case study in Northamptonshire, UK; Environment
Drolet, J. P., R. Martel, P. Poulin, J. C. Dessau, D. Lavoie, M. Parent, and B. Levesque. 2013.
;An approach to define potential radon emission level maps using indoor radon
concentration measurements and radiogeochemical data positive proportion
relationships; Journal of Environmental Radioactivity 124:57-67. doi:
10.1016/j.jenvrad.2013.04.006.
Health Risk of Radon. September 22, 2016. Accessed March 3, 2016.
https://www.epa.gov/radon/health-risk-radon.
Farah, C., K. Beard, C. T. Hess, and J. M. Hock. 2012. ;ANALYZING SPATIAL AND
TEMPORAL (RN)-R-222 TRENDS IN MAINE; Health Physics102 (2):115-123. doi:
10.1097/HP.0b013e318231aa9a.
Field, R. William, and Brian L. Withers. 2012. ;Occupational and Environmental Causes of Lung
Cancer; Occupational Pulmonology 33 (4):681-703.
Friedmann, H., and J. Groller. 2010. ;An approach to improve the Austrian Radon Potential Map
by Bayesian statistics; Journal of Environmental Radioactivity 101 (10):804-808. doi:
10.1016/j.jenvrad.2009.11.008.
Fujiyoshi, R., M. Okabayashi, Y. Sakuta, K. Okamoto, T. Sumiyoshi, I. Kobal, and J. Vaupoti.
2013. ;Soil radon in winter months under snowpack in Hokkaido, Japan; Environmental
Earth Sciences 70 (3):1159-1167. doi: 10.1007/s12665-012-2203-0.
Gray, A., S. Read, P. McGale, and S. Darby. 2009. ;Lung cancer deaths from indoor radon and
the cost effectiveness and potential of policies to reduce them; British Medical
Journal 338:11. doi: 10.1136/bmj.a3110.
Gundersen, L. C. S., and R. R. Schumann. 1996. ;Mapping the radon potential of the United
Harnapp, V. R., H. A. Dollwet, and S. Y. Rong. 1997. ;Airborne radon in homes in Summit
County, Ohio: A geographic analysis; Ohio Journal of Science 97 (1):17-23.
Hauri, D. D., A. Huss, F. Zimmermann, C. E. Kuehni, and M. Roosli. 2012. ;A prediction model
for assessing residential radon concentration in Switzerland; Journal of
Environmental Radioactivity 112:83-89. doi: 10.1016/j.jenvrad.2012.03.014.
IARC. Tobacco smoke and involuntary smoking. In: IARC, ed. IARC monographs on the
evaluation of carcinogenic risks to human. Vol 83. Lyon: IARC, 2004, p 1470
Ielsch, G., M. E. Cushing, P. Combes, and M. Cuney. 2010. ;Mapping of the geogenic radon
potential in France to improve radon risk management: methodology and first application
to region Bourgogne; Journal of Environmental Radioactivity 101 (10):813-820. doi:
10.1016/j.jenvrad.2010.04.006.
Johner, H. U., and H. Surbeck. 2001. ;Soil gas measurements below foundation depth improve
indoor radon prediction; Science of the Total Environment 272 (1-3):337-341. doi:
10.1016/s0048-9697(01)00712-4.
Khan, Mir Azam, Muhammad Atta-ur-Rahman Adnan, Afaq Khattak, Fahad Ahmad, Hassan
Sajjad, Mohsin Khan Jadoon, and Arshad Javaid. 2011. ;FREQUENCY OF LUNG
CANCER DIAGNOSED BRONCHOSCOPICALLY IN A TERTIARY CARE CHEST
FACILITY; JPMI: Journal of Postgraduate Medical Institute 25 (4):338-342.
Kitto, M. E., and J. G. Green. 2008. ;Mapping the indoor radon potential in New York at the
township level; Atmospheric Environment 42 (34):8007-8014. doi:
Krewski, D., J. H. Lubin, J. M. Zielinski, M. Alavanja, V. S. Catalan, R. W. Field, J. B. Klotz, E.
G. Letourneau, C. F. Lynch, J. L. Lyon, D. P. Sandler, J. B. Schoenberg, D. J. Steck, J. A.
Stolwijk, C. Weinberg, and H. B. Wilcox. 2006. ;A combined analysis of North American
case-control studies of residential radon and lung cancer; Journal of Toxicology and
Environmental Health-Part a-Current Issues 69 (7-8):533-597. doi:
10.1080/15287390500260945.
Kropat, G., F. Bochud, M. Jaboyedoff, J. P. Laedermann, C. Murith, M. Palacios, and S.
Baechler. 2014. ;Major influencing factors of indoor radon concentrations in
Switzerland; Journal of Environmental Radioactivity129:7-22. doi:
10.1016/j.jenvrad.2013.11.010.
Lamonaca, F., V. Nastro, A. Nastro, and D. Grimaldi. 2014. ;Monitoring of indoor radon
pollution;Measurement 47:228-233. doi: 10.1016/j.measurement.2013.08.058.
Lugg, A., and D. Probert. 1997. ;Indoor radon gas: A potential health hazard resulting from
implementing energy-efficiency measures; Applied Energy 56 (2):93-196. doi:
10.1016/s0306-2619(97)00002-0.
Miles, J., and K. Ball. 1996. ;Mapping radon-prone areas using house radon data and geological
boundaries; Environment International 22:S779-S782.
Minda, M., G. Toth, I. Horvath, I. Barnet, K. Hamori, and E. Toth. 2009. ;Indoor radon mapping
and its relation to geology in Hungary;Environmental Geology 57 (3):601-609. doi:
Park, C. H., S. Y. Jang, S. J. Kim, and J. H. Moon. 2011.; EFFECTS OF BEDROCK TYPE ON
THE INDOOR RADON CONCENTRATIONS AT THE OFFICE BUILDINGS IN
GYEONGJU, KOREA; Nuclear Technology & Radiation Protection 26 (3):226-232. doi:
10.2298/ntrp1103226p.
Rafique, M., S. U. Rahman, T. Mahmood, S. Rahman, Matiullah, and S. U. Rehman. 2011.
;Radon exhalation rate from soil, sand, bricks, and sedimentary samples collected from
Azad Kashmir, Pakistan; Russian Geology and Geophysics 52 (4):450-457. doi:
10.1016/j.rgg.2011.03.007.
Rafique, M., and M. H. Rathore. 2013.; Determination of radon exhalation from granite, dolerite
and marbles decorative stones of the Azad Kashmir area, Pakistan; International Journal
of Environmental Science and Technology 10 (5):1083-1090. doi:
10.1007/s13762-013-0288-y.
Ravikumar, P., D. Davis, S. Mathew, R. K. Somashekar, and K. L. Prakash. 2014.
;Spatio-Temporal Variation in Radon Concentration in Groundwater with Respect to Rock Types:
A Case Study from Chitradurga District, Karnataka; Journal of the Geological Society of
India 83 (2):156-164. doi: 10.1007/s12594-014-0027-0.
Sahoo, B. K., B. K. Sapra, J. J. Gaware, S. D. Kanse, and Y. S. Mayya. 2011. ;A model to
predict radon exhalation from walls to indoor air based on the exhalation from building
material samples;Science of the Total Environment 409 (13):2635-2641. doi:
10.1016/j.scitotenv.2011.03.031.
Shendell, D. G., and M. Carr. 2013. ;Physical Conditions of a House and Their Effects on
Measured Radon Levels: Data From Hillsborough Township, New Jersey,
Smith, B. J., and R. W. Field. 2007. ;Effect of housing factors and surficial uranium on the
spatial prediction of residential radon in Iowa; Environmetrics 18 (5):481-497. doi:
10.1002/env.816.
Sundal, A. V., H. Henriksen, O. Soldal, and T. Strand. 2004. ;The influence of geological factors
on indoor radon concentrations in Norway;Science of the Total Environment 328
(1-3):41-53. doi: 10.1016/j.scitotenv.2004.02.011.
Szabo, K. Z., G. Jordan, A. Horvath, and C. Szabo. 2013. ;Dynamics of soil gas radon
concentration in a highly permeable soil based on a long-term high temporal resolution
observation series; Journal of Environmental Radioactivity 124:74-83. doi:
10.1016/j.jenvrad.2013.04.004.
Szabó, Zs, P. Völgyesi, H. É Nagy, Cs Szabó, Z. Kis, and O. Csorba. 2013. ;Radioactivity of
natural and artificial building materials – a comparative study; Journal of Environmental
Radioactivity 118 (0):64-74. doi: http://dx.doi.org/10.1016/j.jenvrad.2012.11.008.
Vasilyev, A. V., and M. V. Zhukovsky. 2013. ;Determination of mechanisms and parameters
which affect radon entry into a room; Journal of Environmental Radioactivity 124:185-190.
doi: 10.1016/j.jenvrad.2013.04.014.
Xie, D., M. L. Liao, and K. J. Kearfott. 2015. ;Influence of environmental factors on indoor
radon concentration levels in the basement and ground floor of a building - A case
study; Radiation Measurements 82:52-58. doi: 10.1016/j.radmeas.2015.08.008.
Yarmoshenko, I., A. Onishchenko, and M. Zhukovsky. 2013. ;Establishing a regional reference
indoor radon level on the basis of radon survey data; Journal of Radiological Protection 33
Zhang, Z. G., B. Smith, D. J. Steck, Q. Guo, and R. W. Field. 2007. ;Variation in yearly
residential radon concentrations in the upper midwest; Health Physics 93 (4):288-297. doi:
10.1097/01.hp.0000266740.09253.10.
Zimnoch, M., P. Wach, L. Chmura, Z. Gorczyca, K. Rozanski, J. Godlowska, J. Mazur, K.
Kozak, and A. Jericevic. 2014. ;Factors controlling temporal variability of near-ground
atmospheric Rn-222 concentration over central Europe; Atmospheric Chemistry and