Georgia State University
ScholarWorks @ Georgia State University
Economics Dissertations Department of Economics
8-9-2016
Three Essays on Social Issues in Experimental
Economics
Daniel Lee
Follow this and additional works at:https://scholarworks.gsu.edu/econ_diss
This Dissertation is brought to you for free and open access by the Department of Economics at ScholarWorks @ Georgia State University. It has been accepted for inclusion in Economics Dissertations by an authorized administrator of ScholarWorks @ Georgia State University. For more information, please contactscholarworks@gsu.edu.
Recommended Citation
ABSTRACT
THREE ESSAYS ON SOCIAL ISSUES IN EXPERIMENTAL ECONOMICS
By
DANIEL J. LEE
AUGUST, 2016
Committee Chair: Dr. Susan K. Laury
Major Department: Economics
This dissertation consists of three essays, all of which use the toolbox of experimental
methods to explore behavioral issues that fall out of the concepts of human capital and
public economics. The essays examine how an individual alters her behaviors in response to
changes in price, information, and social pressures. Understanding these behavioral changes
can help us to better explore the pathways that can then inform optimal policy design.
The first essay, Racial Bias and the Validity of the Implicit Association Test, examines
Implicit Bias from an economic standpoint. Implicit associations and biases are carried
without awareness of conscious direction. In this paper, I develop a model to study giving
behaviors under conditions of implicit bias. I test this model by implementing a novel
laboratory experiment—a Dictator Game with sorting to study both these giving behaviors,
as well as a subject’s willingness to be exposed to a giving environment. In doing so, I
adapt the Implicit Association Test (IAT), commonplace in other social sciences, for use
in economics experiments. I then compare IAT score to dictator giving and sorting as a
necessary test of its validity. I find that the presence of sorting environments identify a
reluctance to share and negatively predict giving. However, despite the IAT’s ever-growing
popularity, it fails to predict even simple economic behaviors such as dictator giving. These
results are indicative that implicit bias fails to overcome selfish interests and thus the IAT
lacks external validity.
In the second essay, Will Girls be Girls? Risk Taking and Competition in an All-Girls
has on risk taking and competitive behavior. In it, we compare decisions made by students
in an all-girls school to those made by students in a closely matched co-educational school.
We further investigate the developmental nature of this behavior by comparing choices made
by younger students (Grades 7-8) with those of older students (Grades 11-12). By focusing
on the structural differences between those who select into the all-girls’ school, we find that
although girls educated in a single-gender environment are the most risk averse, they are also
among the most competitive. These results lend support to the hypothesis that “nurture
matters” in the gender differences debate.
Finally, I discuss an essay on charitable giving, entitledThe Richness of Giving: Charity
Selection and Charitable Gifts in a Large Field Experiment. It builds on previous work in
the charitable giving literature by examining not only how much subjects give to charity,
but also which charities subjects prefer. This choice is operationalized in an artefactual
field experiment with a representative sample of respondents. These data are then used to
structurally model motives for giving. The novelty of this design allows me to ask several
interesting questions regarding the choices one undertakes when deciding both whether and
how much to give to charity. Further, I ask these questions in the context of a standard
utility framework. Given the unique set up of this experiment, I also explore how these
distributional preference parameters differ by charity choice and from what we have observed
in the past. I find that there is more variation within demographics and charity types than
across distributions.
THREE ESSAYS ON SOCIAL ISSUES IN EXPERIMENTAL ECONOMICS
BY DANIEL J. LEE
A Dissertation Submitted in Partial Fulfillment of the Requirements for the Degree
of
Doctor of Philosophy in Economics in the
Andrew Young School of Policy Studies of
Georgia State University
GEORGIA STATE UNIVERSITY 2016
Copyright by
Daniel J. Lee
ACCEPTANCE
This dissertation was prepared under the direction of the candidate’s Dissertation Committee. It has been approved and accepted by all members of that committee, and it has been accepted in partial fulfillment of the requirements for the degree of Doctor of Philosophy in Economics in the Andrew Young School of Policy Studies of Georgia State University.
Dissertation Chair: Dr. Susan K. Laury
Committee: Dr. Charles Courtemanche Dr. John A. List
Dr. Michael K. Price
Electronic Version Approved:
Mary Beth Walker, Dean
Andrew Young School of Policy Studies Georgia State University August, 2016
Contents
Chapter I Racial Bias and the Validity of the Implicit Association Test 1
I.1 Introduction . . . 1
I.2 Background . . . 3
I.2.1 The IAT . . . 3
I.2.2 Literature Review . . . 7
I.3 Model Description . . . 12
I.4 Experiment . . . 14
I.4.1 Procedures . . . 14
I.4.2 Data . . . 16
I.5 Discrete Results . . . 20
I.6 Continuous Results . . . 24
I.6.1 Dictator Giving . . . 24
I.6.2 Dictator Sorting . . . 30
I.7 Small Gifts, a Robustness Check . . . 34
I.8 Conclusion . . . 35
Chapter II Will Girls be Girls? Risk Taking and Competition in an All-Girls School 38 II.1 Introduction . . . 38
II.2 Literature Review . . . 39
II.4 Data . . . 45
II.5 Results . . . 53
II.6 Concluding Remarks . . . 66
Chapter III The Richness of Giving: Charity Selection and Charitable Gifts in a Large Field Experiment 68 III.1 Introduction . . . 68
III.2 Experimental Design . . . 72
III.2.1 The ALP . . . 72
III.2.2 Charity Navigator . . . 73
III.2.3 Experimental Procedures . . . 74
III.3 Results . . . 77
III.3.1 Rationality . . . 77
III.3.2 Structural Model . . . 79
III.4 Charity Selection . . . 83
III.4.1 Rationality Across Type . . . 87
III.4.2 Structural Estimates Across Type . . . 90
III.5 Concluding Remarks . . . 91
Chapter IV Summary and Personal Reflection 93 IV.1 Implicit Bias . . . 94
IV.2 Girls’ School . . . 95
IV.3 Charitable Giving . . . 95
IV.4 Concluding Remarks . . . 96
Chapter V Appendix 97 V.1 Appendix A: IAT Screenshots . . . 97
V.2 Appendix B: Sharer Definitions . . . 98
V.4 Appendix D: Demograhpic Survey (Chapter 1) . . . 100
V.5 Appendix E: Additional Models . . . 101
V.6 Appendix F: Student Instructions and Survey (Chapter 2) . . . 102
V.7 Appendix G: List of Charitable Organizations . . . 103
V.8 Appendix H: Experimental Screens and Instructions (Chapter 3) . . . 104
List of Tables
I.1 Progression of IAT Tasks . . . 5I.2 Dictators by Treatment . . . 15
I.3 Dictator Summary Statistics . . . 17
I.4 Baseline Comparison of Roles in the Experiment . . . 17
I.5 Experimental Summary Statistics . . . 18
I.6 Average Amount Passed by IAT score and Race of Receiver . . . 21
I.7 Discrete IAT Estimations . . . 22
I.8 Discrete Estimations, Conditional on Race of Receiver . . . 23
I.9 The IAT’s Effect on Percent Shared . . . 28
I.10 Determinants of Sharing . . . 29
I.11 The Probability of Opting Out . . . 32
I.12 The IAT’s Effect on Sorting . . . 32
I.13 The IAT and Small Gifts . . . 34
II.1 Number of Subjects . . . 45
II.2 Summary Statistics—Sports Participation . . . 45
II.3 Summary Statistics—Educational Attainment . . . 47
II.5 Lobs made by test group . . . 55
II.6 Experimental Earnings . . . 58
II.7 Subject Rationality . . . 59
II.8 Decision to Compete . . . 60
II.9 Joint Estimation (Marginal Effects) . . . 61
II.10 Residual Competitiveness . . . 62
II.11 Probit of Sports on Decision to Compete (Marginal Effects) . . . 63
II.12 “Difference-in-Differences” Estimations . . . 64
II.13 Female Competition in Groups of Majority (>50%) Girls . . . 65
III.1 Subject Demographic Averages . . . 73
III.2 Pairwise Kolmogorov-Smirnov Tests by Subgroup . . . 84
III.3 Selected Categories and Causes . . . 85
III.4 Correlation between CCEI and Selected Category (OLS) . . . 88
List of Figures
I.1 Distribution of Amounts Passed . . . 18I.2 Distribution of IAT D-scores . . . 19
I.3 Scatter Plot of IAT Score and Amount Passed . . . 25
I.4 Sharing When Dictator is Biased . . . 27
I.5 Bar Graph of IAT Scores and Sorting . . . 30
I.6 Sorting When Dictator is Biased . . . 33
II.1 Demographic Comparison of SS and CE Schools . . . 46
II.3 Hand-Eye sports participation by experimental group . . . 50
II.4 Team sports participation by experimental group . . . 51
II.5 Box plot of risk Preferences across test groups . . . 54
II.6 Histogram of performance by gender, by age . . . 56
II.7 Earnings by Test Group . . . 57
III.1 Average Fraction Donated . . . 75
III.2 Distribution of Aftriat’s CCEI . . . 78
III.3 Distribution of Estimated Rho (ρ) . . . 80
III.4 Estimated Median Rho (ρ) Values by Subgroup . . . 81
III.5 Distribution of Estimated Alpha (α) . . . 82
III.6 Estimated Mean Alpha (α) by Subgroup . . . 83
III.7 Word Cloud of Selected Charities . . . 86
III.8 Distributions of CCEI Scores . . . 87
III.9 CES Parameter Distributions Across Charity Types . . . 89
III.10 Classifying Subjects’ Preference over Own Income . . . 90
Chapter I
Racial Bias and the Validity of the
Implicit Association Test
I.1
Introduction
The Center for American Progress estimates the costs of discrimination at $64 Billionper
year or roughly 2 million annually displaced American workers (Burns, 2012). Discrimination
is clearly costly. It is, almost universally, a unique and puzzling issue. And yet, though its
existence is widely acknowledged, it is rarely discussed publicly. In particular, in Becker’s
(1957) model of taste-based discrimination, animus is not only morally reprehensible, but also
damaging to both social welfare and efficiency as animus necessarily burns money. However,
evidence of animus is rarely observed in either naturally occurring data or field and laboratory
experiments. This is perhaps due to the nature of such experiments, which tend to focus on
non-visceral or unaroused decision making (cold-phase) when intuition dictates that personal
distaste is more likely to be expressed in hotter-phase decisions.
This paper speaks to a recent trend in the social social sciences–the claim that
discrim-ination from animus stems from implicit biases and associations. The concept of implicit
are those that we carry without awareness of conscious direction (Kang, 2009). The
devel-opment of the Implicit Association Test (IAT henceforth, discussed further below) has lent
support to these claims by introducing a tractable measure of these implicit biases without
having to rely on self-reporting mechanisms, which are known to be unreliable. The IAT
is essentially several timed sorting tasks. In it, subjects match features, such as faces, to
highly and lowly associated attributes, such as good or bad words. Allegedly, it is easier for
an experimental subject to sort any feature with its more closely associated attributes. For
instance, a picture of a chair is more closely associated with a word “furniture” than a word
“food”, and hence more likely to be sorted faster as such. Thus, it is through this primitive
of differential timing that one reveals his or her implicit biases.
There is some common-sense validation to this argument. Frequently cited examples of
these biases in decision making are men being more associated with management or white
faces being more associated with pleasant words and feelings. As economists, we can think
of these biases as coming through on thehot-phase of our decision-making process. However,
to act on these biases in an IAT is costless, and can be thought of as a cheap-talk action.
Furthermore, there has yet to be an in-depth economics experiment to test the validity of
the IAT.
Regardless, meta-analyses seem to illustrate that these biases persist, (Bertrand et al.,
2005; Greenwald et al., 2009) but should we care, and if so, to what extent? The relevant
question isnt merely one of existence, but whether an individual is both willing and able to
act on these biases (e.g. in the case of a giving decision). To quote Dr. James Heckman,
“The authors of these [discrimination] papers focus on the question of whether society is
color blind, not on the specific question of whether there is market discrimination in realized
transactions” (Heckman, 1998).
Given this critique and the damaging effects of bias, we want to know whether a
well-functioning market can overcome implicit bias, or if it is robust to market interaction.
and Wolfers (2010) claim that, due to the split-second nature of the occupation, implicit
biases can explain their findings of discriminatory behaviors in NBA referees. This behavior
and similar ones suggest a role for the IAT in economic research. What we first need,
there-fore, is a clean experimental test to see if implicit bias can predict economic behaviors. That
is, is the IAT measuring the bias it claims to, and if so, does that bias influence behavior?
In this paper, I take a necessary first step in this line of research by writing a model
of giving under implicit bias. I then conduct a laboratory experiment that examines the
extent to which these IAT scores co-move with pro-social (giving) behaviors. Additionally,
I allow subjects to sort in and out of giving environments to better identify the biases of
different sharers and how they manifest in the market. I focus on giving behaviors because
of a growing body of work in the social sciences discusses the relationship between bias and
giving behaviors (Triplett, 2012). Furthermore giving behaviors are both non-strategic and
non-spontaneous, and therefore easily controlled by the subject.
This chapter proceeds as follows: The next section provides background on the IAT and
relevant literature. Section 3 describes my model. Section 4 outlines the experiment and
describes the data. Sections 5 through 7 present and discuss the results. A final section
concludes.
I.2
Background
I.2.1
The IAT
Bias cannot be randomly assigned, so the question remains, how can we measure it,
particularly when we may be unaware of the biases we hold? Describing implicit bias as
automatic, and analogizing the mechanics of it to those of a reflex, social psychologists
Association Test, introduced in 1998. The test is explained in their seminal paper as follows1:
An implicit association test (IAT) measures differential association of 2 target
concepts with an attribute. The 2 concepts appear in a 2-choice task (e.g., flower
vs. insect names), and the attribute in a 2nd task (e.g., pleasant vs. unpleasant
words for an evaluation attribute). When instructions oblige highly associated
categories (e.g., flower + pleasant) to share a response key, performance is faster
than when less associated categories (e.g., insect + pleasant) share a key.
(Green-wald et al., 1998)
Though screenshots of the IAT tasks are presented in Appendix A, this description merits
further discussion. The reader will note that at its core, the IAT is essentially four (timed)
sorting tasks. The first two tasks, also known as the “2-choice” tasks, are relatively simple,
requiring the subject to sort either concepts or evaluation attributes. In this paper, I utilize
a race (Black-White) IAT which has yet to be used in economics literature, despite the fact
that black-white relations remain one of society’s most divisive issues.
Here, the measure of interest is implicit racial bias. Concepts in the 2-choice task are
pictures of (black and white) faces, while the attributes are are (good and bad) words2. To
further illustrate, in the 2-choice tasks a subject may be asked to sort black faces on the left
and white faces on the right. Similarly, another 2-choice task would be sorting associated
attributes, in this case sorting good words on one side, and bad words on the other.
The other two stages combine these two sorting tasks in a “shared-response task”. Here
the IAT might say good words AND white faces on the left. In this case either a face or a
word will show up and you sort it accordingly. Then the task flips the association to say good
words AND black faces on the left. This is a key distinction because the test is not eliciting
a matching or opinion from subjects. Rather, this is simply a joint sorting task, designed to
1It may be difficult to visualize the assessment from this description alone, for further understanding I
recommend visitingProject ImplicitR at http://implicit.harvard.edu.
2examples of good words: Joy, Love, Peace, Wonderful, Pleasure, Glorious, Laughter, Happy; examples
measure the strength of the association between concept and attribute. While this concept
of associations may seem foreign to economists, it actually finds its roots in early utilitarian
philosophies, wherein people seek not pleasure itself, but rather the objects associated with
[image:16.612.126.484.200.519.2]those pleasures (Mill, 1869). Table I.1 shows the the progression of IAT tasks.
Table I.1: Progression of IAT Tasks
Stage Name Description
Stage 1 Image Stimulus
Learning Trial
In this trial, the custom stimulus (either images, when present, or custom words) will be presented and paired with the response to either the ’e’ or ’i’ key.
Stage 2 Word Stimulus
Learning Trial
Most IATs that assess preference or stereotypes use positive or negative words as the associative stimuli. In this second trial, these words are presented.
Stage 3 Paired Test Trial #1 Stage 3 pairs the associations
learned in Stages 1 and 2 and ran-domly presents a stimulus sampled from either of those sets of stimuli.
Stage 4 Reverse Image or Word
Stimulus Learning Trial
Stage 4 is identical to Stage 1, except that the associations are learned with the opposite hand.
Stage 5 Paired Test Trial #2 Stage 5 combines the associations
learned in Stages 2 and 4.
Source: Meade (2009)
These IAT tasks are conducted at a computer terminal where responses are measured
by keystroke (e.g. E for left, I for right). The testing experience is comparable to a human
player interacting with a computer game. Empirical evidence has shown that the latent
sorting time of black faces and good words in the same column is longer than it is with white
faces and good words.
The standard scoring metric for the IAT is known as the D-Score (Greenwald et al.,
2003). It is similar to Cohen’s measure for effect size, d, and is calculated as the difference
blocks. For the purposes of IAT scoring only paired trials (stages 3 and 5 in this experiment)
are consideredtest blocks3. The equation for thisD-Score is illustrated in equation I.1 below:
D= x3−x5
SD3&5
(I.1)
Accordingly, the D-score can be either positive or negative. In the case of a Black-White
IAT, a positive score indicates a positive (automatic) preference for whites, and vice-versa
for a negative score4. A score of zero indicates little or no preference. The authors
fur-ther classify and interpret D-scores using the conventional measures for effect size (Cohen,
2013), with break points at±0.15,0.35,0.65 for ‘slight’, ‘moderate’, and ‘strong’ associations, respectively.
These authors and others have then used the IAT to make several claims. For instance,
these differences in latent sorting speed (and resulting D-scores) are measurements of
im-plicit bias (i.e. the strengths of the associations we hold) and these biases are persistent–with
extant anti-black biases even among minority groups (Nosek et al., 2002)! These are
inter-esting claims, with the benefit that if true, we can observe a personal bias which people may
not know, or may be unwilling to divulge. However, the claims are also dubious. While it is
understandable why the IAT and similar tests use the primitive of timing, we need something
stronger and more applicable in order to draw economic conclusions. As such, I ask what
is the IAT actually measuring? For instance, Norton et al. (2012) suggest not wanting to
appear biased (or wanting to appear race neutral) can cause a “race-paralysis” in this sort
of task.
My critique is twofold, in that questions of both internal and external validity remain
unanswered. Internally, consider the case of someone who may be particularly biased, but
also finds sorting tasks enjoyable. Inversely, consider a subject who is unbiased but maladroit
at sorting. Do we expect this sorting ability (or lack thereof) to offset the time differential?
3See e.g. table I.1.
4My critique notwithstanding, in this paper I will continue to use the terminology of preferences so as to
I formalize this aspect of my critique by adapting the notation of Borghans et al. (2008):
Ti,IAT =hi(fi, Vi) (I.2)
LetTi,IAT denote person i’s performance on the IAT task. Output in this task is generated by an individuals implicit associations, fi, as well as Vi, a vector of other determinants of task productivity, such as sorting ability.
Now consider, without loss of generality, the case of two individuals, i and j, with equivalent biases and productivity functions, yet one is better at sorting. That is fi = fj, and Vi > Vj, implying differential task performance hi(fi, Vi)> hj(fi, Vj)⇒Ti,IAT > Tj,IAT. When we allow for heterogeneity in either the bias or the production function (or both) it
becomes evident that implicit bias remains unidentified.
Further, some may be quick to point out that these subjects are unmotivated. As Grether
and Plott (1979) note, this lack of motivation can be a true cause for concern in the validity
of psychology experiments. However, when the outcome of interest is cheap talk (as in the
IAT), unmotivated subjects may still be valid. The question of interest, which remains to
be answered, is whether or not this IAT cheap talk predicts bias in marketplace behaviors.
That is, is the IAT mapping into economically relevant decisions—is it externally valid? If
so, what are the dosage implications? That is how much more do severe levels of implicit
bias map into these decisions as opposed to moderate or even slight bias?
I.2.2
Literature Review
As such, the true rub lies within the application of this test. Several studies suggest we
should be interested in implicit bias by claiming that it has an effect on economic
decision-making5. Again, Price and Wolfers (2010) argue implicit bias explains discriminatory
behav-ior amongst NBA referees, although they do not use an IAT explicitly. Select few studies in
5For a more thorough review of the recent psychology and management literature regarding the IAT see
economics do. Of them, Lowes et al. (2015) find evidence of ethnic homophily while Reuben
et al. (2014) and Rooth (2010) find predictive evidence of negative hiring conditions. The
former uses an experimental labor market for women in STEM fields, and the latter uses a
correspondence study with an IAT follow-up. It finds that implicitly associated stereotypes
(e.g. Arabs are lazy) forecast interview callbacks in Sweden. However, none of these papers
use a Race IAT, which is the standard and most common. The alleged interaction between
implicit bias and labor market decisions suggests a role for further economic analysis in other
areas of decision-making, such as pro-social behavior.
Thus far, the economic study of bias has primarily dealt with competitive models–those
in which individuals optimize their own behavior. These models date back to Becker (1957)
as well as Phelps and Arrow (1972; 1973, respectively) who developed models relating
taste-based (preferential) and statistical (informational) bias, respectively. Since these two models
have different policy implications it is particularly important to properly identify the
chan-nels of bias. Briefly, in Becker’s model employers may experience a disutility from hiring
minority workers. Consequently, these workers may have to accept lower wages or similarly
increase productivity to ‘compensate’ employers in-kind for this bias6. In Arrow’s model
firms have limited information about potential employees and are forced to infer
produc-tivity information from primitive observables. In the following discussion, I will talk about
discrimination as resulting from these biases.
In this vein of “primitive observables” our natural inclination as economists to identify the
effects of bias is to plug some outcome of interest (e.g. wages, employment) into a regression
with some likely covariates (e.g. sex, race), control for as many factors as possible, and
interpret the results, or relegate bias to a residual. Comprehensive works by both Yinger
(1998) and Altonji and Blank (1999) review this regression model of identification. The
consensus is that there are markets in which discrimination both exists and is prevalent.
The empirical challenges in these studies, however, are twofold. First, with these
reduced-6This does not necessarily imply an absence of discrimination, although with enough unbiased employers,
form models, we cannot identify the causal pathways for this discrimination (such as implicit
cognition). Secondly, the observed outcomes may be severely biased due to missing data.
Charles and Guryan (2011) further critique this regression approach by asking what is the
ideal experiment the regressions are mimicking.
In this sense, a natural solution to these shortcomings is to run experiments. A popular
method in this research has been fictitious tests in the form of either audit or
correspon-dence studies. Both audit studies, which use trained testers (e.g. Gneezy et al., 2012) and
correspondence studies, which use fabricated paper applications (e.g. Bertrand and
Mul-lainathan, 2004; Hanson and Hawley, 2011; Hanson et al., 2011) provide further evidence of
the existence of discrimination, though they are largely silent on the magnitude of the effect.
In this paper, I help to identify the magnitude (or lack thereof) of any differential treatment.
Furthermore, both audit and correspondence studies have the potential to produce spurious
evidence of discrimination (Neumark, 2012), and are subject to the Heckman (1998) critique
of auditor influence and inferences drawn that are based on otherwise unobservable factors.
These critiques suggest a role for other field and laboratory experiments. Evidence for
bias is consistently found in the field. Furthermore, this evidence is persistent across a
wide-variety of circumstances and domains, from excessive in-group cooperation amongst kibbutz
members, when compared to Israeli city-dwellers (Ruffle and Sosis, 2006) to Pigouvian price
discrimination amongst sports card traders (List, 2004).
However, laboratory experiments have not yet found significant consensus regarding the
presence of bias, and an open question is the role ofimplicit bias. Several of these studies use
the methodology of a Voluntary Contribution Mechanism (VCM henceforth) public goods
game (Brown-Kruse and Hummels, 1993; Cadsby and Maynes, 1998; Solow and Kirkwood,
2002; Castillo and Petrie, 2010). An outstanding issue is that VCM games study group
behavior and are not reflective of the one-on-one interactions of the audit and correspondence
studies described above. Furthermore, laboratory experiments should be more reflective of
this vein we consider experiments that incorporate power asymmetries that a standard VCM
game lacks, to mimic realms where bias is most present.
In response, several studies of note that have used 2-player games to measure
discrimi-nation. To study discrimination in culture, Ferraro and Cummings (2007) use the standard
ultimatum game with Hispanic and Navajo subjects in New Mexico. They find significantly
different behavior between the two groups. Furthermore, by eliciting subjective beliefs they
claim these different behaviors are indicative of statistical discrimination. Similarly,
Fer-shtman and Gneezy (2001) use a paired design to test for and disentangle channels of
dis-crimination in Israeli society. In their experiment, significantly less money was passed to
male Jews of Eastern origin in a trust game. However, this result was not replicated with a
dictator game, indicating statistical discrimination.
Slonim and Guillen (2010) use the design of a trust game to detect gender discrimination.
Further, to disentangle possible effects they include a treatment that allows for partner
selection. They find (almost) no discrimination without selection but significant taste-based
discrimination with selection. Finally, Eckel and Petrie (2011) use a trust game with a costly
option to see your partner’s picture and find both a demand for pictures, and increased
first-mover earnings under pictures.
These 2-player designs allow for much cleaner identification than the group play of a VCM
design, particularly when sorting or selection is used as a treatment cell7. The problem is this
set of games still involves strategic interactions. Thus, instead of trust or ultimatum, I find
a dictator game (the unique elements of which are described below) to be more appropriate
to studying bias in pro-social behavior. Here, since the second player is passive, any giving
is non-strategic and differences in giving can only be due to discrimination. This is discussed
further in the section on experimental design below. In his review of the dictator game
literature, Camerer (2003) notes that we tend to observe 10-30% of passed endowments.
These rates are problematic if they are only artefactual of the lab, and could be indicative
of experimenter demand effects or privacy concerns.
One check on the observed rates is to allow subjects to sort out of dictator giving, that
is offering dictators a potentially different payoff, $w0, to not play the dictator game (i.e. allocate $w). There are three notable papers that address sorting, and thereby motives for giving. In Dana et al. (2006) one third of subjects opted to take a private $9 payoff
instead of playing a $10 dictator game. Broberg et al. (2007) extend this design by eliciting
a subject’s willingness to pay to exit using a BDM mechanism. They find more subjects are
willing to exit, and for higher prices. Finally, and serving as the inspiration for this design,
Lazear et al. (2012) (LMW henceforth) examine both costly (exit) and subsidized (entrance)
sorting. Using a framework of social preferences, they find that sorting not only affectshow
many people share, but also what kinds of people share.
Though not yet used to examine bias, the motives for giving argument and the particulars
of a sorting design apply nicely to this field of inquiry. It is my intent to describe these kinds
of people not only by their giving behaviors, but potentially by their implicit biases as
well. Further, I examine how these biases affect their decisions. This naturally follows from
the behavioral finding that subjects are more likely to opt out of cross-race environments
necessitating a judgment of racial characteristics relevant to common stereotypes (Norton
et al., 2012).
In addition to addressing the above problems, this paper contributes to the literature in
several novel ways. It is the first to examine the psychological pathways of bias by using
the IAT. This is important because as stated above different pathways may have different
economic implications for behavior. This paper is unique in providing racial information of
the recipients and allowing a sorting option with varying property rights in a dictator game.
By comparing the observed rates giving and differential exits to IAT scores, this paper
investigates validity of the IAT in a way the research was previously lacking. Accordingly
I.3
Model Description
Assuming the IAT actually measures bias, it should also be able to predict economic
decisions reflecting that bias, such as giving and sorting behaviors. However, the directions
and theory underlying these decisions have not been fully explored. To that end I formalize
a model of giving under implicit bias.
LMW note that different kinds of sharers exist, and introducing a sorting environment
allows us to distinguish between these types, described as follows: Willing Sharers, who
prefer to share and enter into sharing environments; Reluctant Sharers, who prefer not to
share but do so to comply with social pressures, norms, or mores; and Non-Sharers who
simply do not share8.
In this vein, LMW aim to detect a reluctance to share. I revisit this analysis and extend
the definitions further by examining one potential pathway of this reluctance–conditional on
bias.
For the purposes of this experiment, consider a utility maximizing individual, henceforth
referred to as the dictator. The dictator is indexed by her level of bias, i, which I assume manifests as animus and perfectly correlates to the dictator’s IAT D-score 9. The D-score
which is drawn from a standard normal distribution, that is i∼N(0,1)10. In this model,
the dictator may be in an economic environment that allows sorting, and may also have
photographic information on her receiver. If the former, the dictator can take take up to
two possible actions. First, the sorting decision, that is the decision between allocating an
amount w (sorting in) or receiving an amount w0 (exiting out). Conditional on sorting in, she must now make the decision of how much to give, that is how to split the endowment w
between herself, x, and the recipient, y, such thatx+y=w.
I further hypothesize that individuals also sort based on who they are sharing with, and
8Formal definitions for these types can be found in Appendix B.
9This assumption that the test is registering bias as opposed to cultural knowledge of stereotypes is
consistent with accepted interpretations of the IAT (Nosek and Hansen, 2008).
this sorting also manifests itself as animus. As such, I also allow the dictator to consider
the race of the recipient r. This consideration only occurs if the dictator has photographic information. Thus, the dictator has preferences over her environment D, her payoff,x, the payoff to the recipientyand the similarity of the race of the recipientr. It is these preferences that determine sorting or not sorting, and potentially the giving decision:
Ui =Ui(D, x, y, r) (I.3) where D is an indicator variable such that D = 1 if the environment has sorting and 0 otherwise; and r is an indicator variable such that r = 1 if the dictator has photographic information and is the same race as the individual, and 0 otherwise.
Within subjects, the theory of animus dictates that not only is an individual’s utility
greater for an equal amount given to the preferred race11:
i≥0.15⇒Ui(D,x, w¯ −x,¯ 1)≥Ui(D,x, w¯ −x,¯ 0) (I.4) but also that a person is willing to take a utility hit to express his or her distaste. Here,
that means a willingness to sort out (even if the sort is costly) for the sole purpose of not
sharing:
i≥0.15∧(w < w0)⇒Ui(1, w0,0,0)> Ui(0, w,0,0) (I.5) This unwillingness to interact is a core concept of animus. As such, across subjects, the
model of animus predictions that greater bias should have more costly sorting, in addition
to less sharing across races. That is:
Ui(D,x, w¯ −x,¯ 0)> Uj(D,x, w¯ −x,¯ 0)⇒i < j,∀x < w¯ (I.6)
w < w0 ⇒Ui(1, w0,0,0)> Uj(1, w0,0,0),∀i > j (I.7)
In this experiment, I restrict my focus to the across subject design. Broadly speaking, I
ask two initial empirical questions based on this model. If the answer to either of these first
two questions is yes, it suggests that there is a clear pathway from the the hot-phase IAT
task to some of the cold-phase decisions it has been used to explain. Absent evidence of this
pathway, I ask a final question concerning meta-awareness of bias:
1. Does the IAT predict giving behavior?
2. Does the IAT predict sorting out of giving environments?
3. Do biased givers attempt to mitigate their bias with small gifts?
I.4
Experiment
I.4.1
Procedures
Given that previous lab experiments have demonstrated that these different types of
individuals exist, I ask what are the IAT’s implications for both laboratory and naturally
occurring behavior. I use the toolbox of experimental economics to see if IAT performance is
related to differential treatment of receivers and if so, to what extent. In doing so, I examine
the IAT as a predictor of pro-social behavior in an experimental market. This behavior
includes giving as well as sorting out of potential giving environments.
To properly ask (and answer) these questions this experiment necessarily progresses in
two stages: first the dictator game (potentially with a sorting option), and second with the
IAT. Upon arriving at the lab subjects are randomly split into receivers and dictators. I will
now explain the two roles in turn.
In a standard dictator game, a first mover is given $10 and asked how much she would
like to give to a paired (and passive) player; her choice ends the game. Thus, giving in
this game is non-strategic. I begin with this standard (no information) treatment to gauge
From here, I differ from a standard game in that some treatments employ a sorting
environment. Specifically, I offer some dictators an exit option as in LMW. In other words,
dictators are given a chance to leave the game in such a way that the passive player never
knows he or she was playing a dictator game. In doing so, I aim to disentangle social pressure
as a motive for giving. This opportunity (choice) can be either costly or free. The costly
option is necessarily payoff dominated by at least one dictator game choice.
Finally, these treatments are run in two types of sessions: Ones with no information
(anonymous), and pictures sessions, where dictators can see who they are passing to, and
use that picture as a proxy for race. For the most part, we are concerned with outcomes in the
“Pictures” sessions. However, the anonymous treatments serve as an interesting comparison
and are necessary for commenting on the social closeness afforded by a picture. Further,
the cross between pictures sessions and sorting treatments allows us to see whether implicit
bias is affecting behavior on either the extensive or intensive margin. That is, the decision
to engage in giving as well as how much to give.
Table I.2: Dictators by Treatment
Sorting
Baseline Costly Free No Information 20 13 20
Pictures 48 68 59
Total 68 81 79
Source: Author’s calculation
As such, this experiment necessitates a 2x3 design. The treatment cells are as follows:
A standard (baseline) dictator game, and two dictator games with sorting: costless and
costly. In costless sorting, the dictator receives the same amount in entry and exit ($10).
In costly sorting, the dictator receives $9 upon exit. These dictator games are all played
across both anonymous and pictured sessions. The treatment cells and number of dictators
that participated in each treatment are described further in table I.2 as well as in the data
After roles are assigned, the dictators are randomly paired with a receiver, and in the
Pictures treatments shown a picture of that receiver’s face. The photos serve as a proxy for
race. In theNo Information treatments dictators are not informed about their receivers. In
both versions, dictators are then explained the rules of the dictator game. In all but the
baseline treatment, they are asked whether or not they choose to participate. In the event
that a dictator elects to not participate (takes the exit option), their receiver is not given
any information about allocation task, and the dictators are given their exit fee ($9 or $10,
depending on treatment). Otherwise, dictators decide how to allocate a sum of $10 between
themselves and their receiver.
Meanwhile, the receivers are passive in their role. They have their pictures taken, are
guaranteed a show-up fee, and asked to participate in a different task. In this case, that
task is a real-money, 1x risk-preference elicitation (Holt and Laury, 2002), the results of which I discuss in a companion paper (Lee,in-progress). The receiver task is constant across
treatments.
The next task in the experiment is a race IAT (as described above) on all subjects. I run
this task second because an IAT can possibly influence amounts passed. However, knowing
they have just participated in a dictator game should not influence IAT score, as evidence
shows it is difficult to fake or otherwise manipulate (Fiedler and Bluemke, 2005). I then
close by collecting demographic data in the form of a survey, and pay subjects privately.
Complete subject instructions and survey questions can be found in Appendices C and D,
respectively.
I.4.2
Data
These experiments were conducted during the summer and fall of 2015 at the Center for
Experimental Economics at Georgia State University (ExCEN). Subjects were recruited via email using the center’s recruiter. While I strove for sessions to be racially balanced, this
non-Table I.3: Dictator Summary Statistics
Variable Mean Std. Dev. N
Male 0.399 0.491 228
Black 0.724 0.448 228
Catholic 0.092 0.29 228
Previous Experience 0.794 0.405 228 Business or Econ Major 0.268 0.444 228
Age 21.775 4.838 227
Year in School 3.149 1.07 221
GPA 3.302 0.448 189
Source: Author’s calculation
problematic given the experimental design, as well as the evidence cited above on implicit
attitudes and minority groups.
Table I.4: Baseline Comparison of Roles in the Experiment
Panel A: χ2 Tests
Covariate Dictator % Receiver % p-Value
Male 40.08 51.54 0.014*
Black 72.24 67.84 0.306
Catholic 9.257 9.69 0.873
Previous Experience 79.29 76.21 0.430
Business or Economics Major 26.87 21.59 0.189 Panel B: Rank-Sum Tests
Covariate Dictator Mean Receiver Mean p-Value
Age 21.78 21.15 0.216
Year in School 3.15 3.10 0.835
GPA 3.30 3.26 0.563
Notes: * Significant at the 5% level
Source: Author’s calculation
Overall, I ran 17 experimental sessions across the 6 treatments, with a roughly equal
balance of subjects across treatment rows12. In total, 227 dictators (i.e. 454 subjects)
par-ticipated in the experiment. Table I.3 describes the demographic breakdown of the dictators.
Dictators in this experiment are (on average) 22, with a 3.3 GPA. Roughly 72% are Black
and 40% are Male. Most have previous experience in economics experiments, and the modal
12Given my power analysis and the fact that receiving in theNo-Information treatments is anonymous, I
Table I.5: Experimental Summary Statistics
Variable Mean Std. Dev. N
Passed to Male 0.513 0.501 228 Passed to Black 0.675 0.469 228 Amount Passed 2.692 2.238 228 Opted Out (Total) 0.186 0.389 167 Opted Out (Costly) .148 0.357 81 Opted Out (Costless) 0.202 0.404 99
IAT D-score 0.054 0.495 225
Source: Author’s calculation
year in school is senior13.
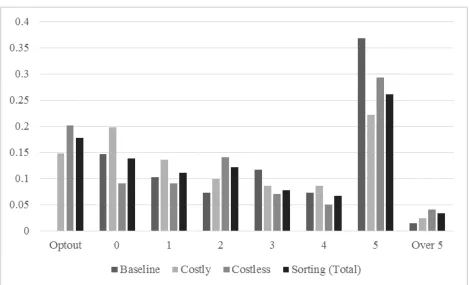
Figure I.1: Distribution of Amounts Passed
Source: Author’s illustration
Non-parametric analyses in the form ofχ2and Rank-Sum tests examine covariate balance between roles. For the most part, I find no significant difference across them, and conclude
13This is perhaps an artifact of running a summer experiment, where both former juniors and recent grads
that the sample is balanced14. These results are reported in full in table I.4.
Finally, table I.5 provides a brief description of dictator choices and performance in the
experiment. On average, 27% of the endowment was passed, and a little more than 18% of
those offered an exit option opted out, with more people exiting when it is costless. Rank
Sum tests show sorting significantly decreases sharing, even when sorting is costly (Sorting:
z = 2.146, p < 0.05; Costly Sorting: z = 2.370, p < 0.05). These numbers are roughly similar to previous findings. Full distributions of amounts passed are illustrated further in
[image:30.612.73.540.287.645.2]figure I.1.
Figure I.2: Distribution of IAT D-scores
Source: Author’s illustration
14There were significantly more males in the receiver role (117 as opposed to 91), but this is likely a
Regarding the IAT, the average D-score was 0.05, suggesting little to no automatic bias.
I depict these scores in figure I.2 for further exploration. The scores follow a fairly normal
distribution, consistent with both model assumptions and extant results across a variety
of subject pools. The modal score is in the bin 0-0.15 (no automatic bias). However,
there is significant implicit bias in the sample. Over 44% of dictators have an IAT D-score
greater than or equal to 0.15, indicating a pro-white implicit bias. Consonant with the above
evidence, this bias is present and perhaps stronger in subjects identifying as black, with a
mean IAT score of 0.162.
I.5
Discrete Results
We have seen descriptively that sorting environments affect giving behaviors. However,
given the empirical questions asked above, I now turn my focus to the role of the IAT
in making these economic decisions. I first explore this role by simply looking at average
amounts passed, broken up by the dictator’s bias. Specifically, table I.6 shows the mean pass
broken down by both the strength of the association, and the recipient. First of all, these
differences are not significant. Secondly, if implicit bias had a one-to-one mapping into giving
behaviors, we would expect passes to black subjects would get smaller as we move down the
table (strengthen the bias towards whites), and the opposite pattern for whites. However,
these directional patterns do not emerge, particularly in the black recipient column. Here,
those who have dictators biased against them end up earning more on average.
Next, I take what we learned in table I.6 and discretize IAT score into the blunt question
of “do I (implicitly) like or dislike my recipient?”
I express this question in equation I.8:
Table I.6: Average Amount Passed by IAT score and Race of Receiver
Passed to:
Strength of Implicit Bias Black White Anonymous
Strong for Blacks 2.07 1.67 2.5 Moderate for Blacks 2.28 2.33 2.75
Slight for Blacks 3.43 1.67 2.83 Little to None 2.18 2.55 2.33 Slight for Whites 3.13 3.5 3.33 Moderate for Whites 2.47 2.33 2.54 Strong for Whites 2.68 3.33 2.4
Source: Author’s calculation
the form of either a continuous variable representing the percent of endowment shared, or
a binary variable indicating whether a dictator took an exit option. The two variablesLike
and Dislike are essentially binary interaction terms defined formally as follows in equation
I.9: Like=
1 when IAT ≥0.15 and Receiver is White 1 when IAT ≤ −0.15 and Receiver is Black 0 otherwise Dislike=
1 when IAT ≤ −0.15 and Receiver is White 1 when IAT ≥0.15 and Receiver is Black 0 otherwise
(I.9)
That is to “like” your receiver means to either hold a pro-white bias and pass to a white
receiver, or hold a pro-black bias and pass to a black receiver. I later decompose the variable
into these two components (pro-white, white receiver and pro-black, black receiver).
Sim-ilarly, to “dislike” means to have the one of same IAT scores as above, but with the race
of your receiver flipped. Accordingly, the intercept term, α, represents those dictators who hold little to no implicit bias (−0.15< IAT < 0.15).
Table I.7: Discrete IAT Estimations
OLS–Percent Shared Probit–Opted Out
VARIABLES (1) (2) (3) (4)
Like Receiver 0.0696 0.0783
(0.0469) (0.336)
Pro-White, White Receiver 0.0529 -0.578
(0.0593) (0.568)
Pro-Black, Black Receiver 0.0774 0.292
(0.0507) (0.358)
Dislike Receiver 0.0291 0.166
(0.0492) (0.322)
Pro-White, Black Receiver 0.0423 0.0955
(0.0498) (0.337)
Pro-Black, White Receiver -0.0289 0.456
(0.101) (0.504)
Constant 0.229*** 0.229*** -0.887*** -0.887*** (0.0391) (0.0391) (0.257) (0.257)
Observations 172 172 126 126
Robust standard errors in parentheses *** p<0.01, ** p<0.05, * p<0.1
Source: Author’s calculation
find that unbiased givers share about 23% of their endowment, and being biased against (or
in favor of) your receiver does not significantly alter this giving pattern. Furthermore, both
directions of bias remain insignificant when decomposing the Like and Dislike variables into
their respective components in column 2.
Similarly, table I.7, columns 3 and 4 look at how bias influences the probability of opting
out. In both the blunt (column 3) and decomposed (column 4) measures, neither liking nor
disliking one’s receiver has any significant impact on giving.
These results indicate that bias does not affect the decision giving on average. However,
a relevant question is do dictators who are biased against black (white) receivers behave
differently than the average dictator with a black (white) receiver. To answer this question,
I conduct an exercise similar to the one outlined in equation I.8, but restrict the sample
Table I.8: Discrete Estimations, Conditional on Race of Receiver
Black Receiver White Receiver VARIABLES (OLS) (Probit) (OLS) (Probit)
Dislike Receiver -0.00310 -0.132 -0.0727 0.952* (0.0407) (0.290) (0.100) (0.576) Constant 0.274*** -0.659*** 0.273*** -1.383***
(0.0267) (0.191) (0.0381) (0.374)
Observations 127 93 45 33
Robust standard errors in parentheses *** p<0.01, ** p<0.05, * p<0.1
Source: Author’s calculation
Even when we isolate the sample by race of receiver, biased dictators are not behaving
in ways that are not statistically different than the average dictator, nor is this difference
economically significant. While the above results are indicative that implicit bias fails to
overcome selfish concerns, they have mostly examined the effect of IAT score on economic
behaviors. Another way of looking at the question is to treat the data as observational, and
ask (with some abuse of notation) what is the treatment effect of being paired with someone
you hold a bias against?
To answer this question I exploit the random assignment of roles and partners and
im-plement propensity score matching. Here, I treat each person as having a particular bias
strength and direction, ranging from strongly pro-black to strongly pro-white (e.g. see table
I.6). I match on the strength and direction of this bias as well as covariates describing the
dictator’s age, race, and sex, and specify the treatment as passing to someone you hold a
bias against. That is, passing to a black person if you hold a pro-white bias and vice-versa. I
find no significant treatment effect of passing to someone you are biased against (ATT=0.14,
p=0.625).
I.6
Continuous Results
However, we measure IAT score as a continuous variable, and are able to comment not
only on the existence of implicit bias, but also the strength of that bias. As such, one
would think that more severe biases would exert more influence on the giving and sorting
decisions. To address this dosage question, I standardize the IAT score and outline the
following reduced form empirical specification:
Outcomei =β0+β1IATi+β2(IATi∗Racej) +β0X+εi (I.10) This standardization allows me to interpret coefficients as the effect of a one standard
de-viation increase in IAT score. In this specification I again regress an outcome variable on
two variables of interest: that dictator’s IAT score and an interaction term of dictator’s IAT
score with the race of her recipient, as well as a vector of demographic controls for both
dictators and receivers. The interaction term allows us to examine this giving conditional on
being paired with the object of one’s bias. This interaction is also consistent with the model
assumption that the IAT manifests as animus. The controls are necessary because observed
differences in the outcome variable may be driven by factors unrelated to a dictator’s implicit
bias. Different specifications below may highlight different sets of these parameters in my
analysis.
I.6.1
Dictator Giving
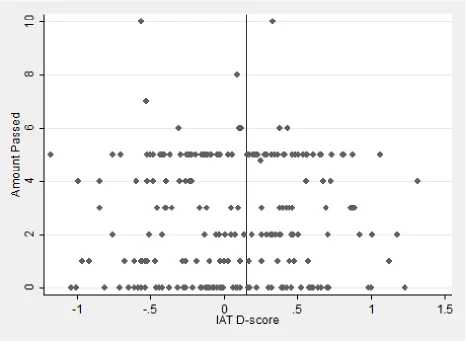
I continue with a graphical exploration of the IAT’s relationship to giving. Figure I.3
shows the amount passed given a dictator’s IAT score. Despite the IAT’s popularity in
academic work, there is no clear linear relationship between IAT score and amount passed
(ρ=−0.01). Further, in each “column” of IAT score there appears to be a similar bimodal distribution of amount passed. This suggests that levels of implicit bias do not necessarily
Figure I.3: Scatter Plot of IAT Score and Amount Passed
Notes: The solid line indicates the IAT-D ”bias” threshold of 0.15 Source: Author’s illustration
To confirm these findings econometrically, we turn to table I.9 which presents this paper’s
main estimates. In these models I restrict the sample to only the dictators in sessions with
photographs, although the results hold when expanded to the full sample. Additionally, I
have used both dictator and receiver dummies for African-American, rather than which race
a subject is biased against. While this may be a coarse measure, this modeling technique
makes more sense in terms of coefficient interpretation since IAT score is increasing in the
level of anti-black bias. Further, these results are consistent with the discrete estimations
from section V and robust to the alternate specification of “biased against receiver”15.
In panel A of table I.9 I start with a simple OLS and regress percent shared on the
parameters of interest. We see that neither implicit bias nor its interaction with a black
receiver yields a significant predictor of giving. These results hold true in specifications that
control for race and gender of dictator, the receiver, and both. Further, these controls also
have no significant effect on giving.
However, the presence of a sorting option consistently and significantly decreases the
amount shared by around 10%. This result suggests that in terms of giving behaviors,
people aren’t acting on their implicit biases, and perhaps are able to control any bias they
may hold. Instead, social preferences unrelated to the IAT, especially pressure to give,
appear to be strongly influencing these pro-social behaviors (or lack thereof).
Next, to account for the 27% of dictators who either gave nothing or opted out, I replicate
the OLS results with a left-censored Tobit model16. These results are shown in table I.9,
panel B, and are not categorically different than the OLS results. That is, IAT score is
positive but insignificant, the interaction term is negative but not significant, controls lack
significance, and the presence of a sorting option is strongly and negatively significant.
Following LMW, I assess the determinants of sharing in table I.10. Specifically, I compare
the relative importance of implicit bias (in column 1) to the presence of the sorting option,
as well as self-reported demographics that could potentially affect sharing (in column two).
Again, one’s amount of implicit bias does not significantly determine sharing. Magnitudes
of these results are similar when I run the full model, including IAT score with demographic
controls (column 3). Additionally, I calculate coefficients of partial determination17. This
measure shows that not only does implicit bias lack statistical significance, but one’s IAT
score accounts for less than 4% of the unexplained variance and lacks economic significance
as well.
The above exercises hold true when instead of looking at the coarse measure of race of
receiver, I look at the finer measure of being biased against one’s receiver. In figure I.4, I
16Robust standard errors are calculated using jackknife estimation. A double-hurdle model (Cragg, 1971)
would be inappropriate here because to account separately for the opt-out process requires restricting the sample to only those in sessions with sorting. Results from this model are presented in Appendix E.
17(R2
−R2
Figure I.4: Sharing When Dictator is Biased
(a) Whole Sample
(b) Conditional on Staying In
Table I.9: The IAT’s Effect on Percent Shared
Panel A: OLS
Variable (1) (2) (3) (4) (5)
IAT D-score 0.0197 0.0169 0.0286 0.0262 0.0389 (0.0353) (0.0351) (0.0450) (0.0385) (0.0366) IATxPassedBlack -0.0617 -0.0439 -0.0494 -0.0595 -0.0665
(0.0805) (0.0795) (0.0797) (0.0867) (0.0843) Sorting Option -0.101*** -0.0960*** -0.0944*** -0.0867**
(0.0355) (0.0368) (0.0361) (0.0377)
Dictator Controls X X
Receiver Controls X X
Constant 0.269*** 0.343*** 0.388*** 0.339*** 0.382*** (0.0176) (0.0278) (0.0509) (0.0460) (0.0641) Panel B: Tobit
Variable (1) (2) (3) (4) (5)
IAT D-Score 0.0298 0.0251 0.0361 0.0426 0.0549 (0.0485) (0.0481) (0.0483) (0.0535) (0.0516) IATxPassedBlack -0.0854 -0.0574 -0.0632 -0.0883 -0.0959
(0.110) (0.109) (0.109) (0.120) (0.117) Sorting Option -0.145*** -0.138*** -0.132*** -0.122**
(0.0448) (0.0462) (0.0452) (0.0469)
Dictator Controls X X
Receiver Controls X X
(0.0478) (0.0495) Constant 0.222*** 0.327*** 0.366*** 0.323*** 0.359*** (0.0254) (0.0336) (0.0688) (0.0576) (0.0849)
Observations 172 172 172 172 172
Robust standard errors in parentheses *** p<0.01, ** p<0.05, * p<0.1
Source: Author’s calculation
graph box plots for a further analysis of what happens when a dictator is biased against the
race of his or her receiver. For these figures that means both passing to a black receiver when
biased against blacks (Receiver=Black|IAT ≥0.15) as well as passing to a white receiver when biased against whites (Receiver=Black|IAT ≤ −0.15).
Clearly there is no difference in giving when I consider the whole sample in figure I.4a.
Table I.10: Determinants of Sharing
Partial
Variable (1) (2) (3) R2’s
IAT D-score -0.00247 0.00850
(0.0169) (0.0195) 0.036 Sorting Option -0.0847** -0.0830*
(0.0423) (0.0448) 0.158
Age 0.00642*** 0.00614**
(0.00245) (0.00253) 0.148
Male 0.00345 -0.00223
(0.0407) (0.0426) 0.005
Black -0.0992* -0.107**
(0.0502) (0.0519) 0.185
Catholic -0.000280 0.00947
(0.0708) (0.0761) 0.012 Previous Experience -0.0258 -0.0277
(0.0466) (0.0468) 0.047 Major: Business or Econ 0.00407 0.00614
(0.0420) (0.0429) 0.012
GPA -0.112*** -0.110***
(0.0409) (0.0411) 0.219 Constant 0.268*** 0.657*** 0.659***
(0.0176) (0.164) (0.164)
Observations 172 146 143
R-squared 0.000 0.138 0.136
Robust standard errors in parentheses *** p<0.01, ** p<0.05, * p<0.1
Source: Author’s calculation
option in figure I.4b. We will see a similar result regarding dictators choosing to opt out in
the following subsection on Dictator Sorting.
Finally, I compare the picture treatments to the anonymous ones. Using rank-sum tests,
amounts given by the dictator do not appear to be different across these two treatment rows
into play in this sharing decision. The lack of difference between the two treatment rows
here is further indicative of the null results above.
Given the overwhelming evidence above, I now declare the first result, regarding implicit
bias and dictator giving:
Result 2 Amount of Implicit Bias (as indicated by IAT D-score) does not predict dictator
giving
[image:41.612.72.541.311.653.2]I.6.2
Dictator Sorting
Figure I.5: Bar Graph of IAT Scores and Sorting
Notes: The solid line indicates the IAT-D ”bias” threshold of 0.15 Source: Author’s illustration
regard to these biases or otherwise self-aware enough to recognize their biases. If so, they may
be simply choosing not to enter sharing environments where they can express this distaste,
or similarly choosing to express this distaste through their opt-out. However, we see in figure
I.5 the average IAT score for dictators in treatments with an exit option. Under costly and
costless sorting schemes, the mean IAT score is descriptively smaller amongst those who
stay in (as compared to those who opt out), whereas in costless sorting the mean IAT score
is essentially the same. However, in both cases, this difference is not significant (Costly:
t= 1.04, p= 0.30; Costless: t= 0.03, p= 0.98).
Accordingly, I estimate the probability of opting out in table I.11. This model uses a
probit regression and necessarily restricts the sample to only those dictators with an exit
option (that is, those in sorting treatments, n=159,). The variable structure is intended to
mimic the experimental design, using dummy variables for treatment and a measurement
variable to indicate IAT score. In this model, there are no significant coefficients, suggesting
that overall, one’s IAT score does not seem to influence the decision to sort out, with this
result holding even when controlling for both the financial and social costs of sorting.
Nonetheless, this exploration again calls for a deeper analysis. Following equation I.10 I
look at the econometric results to confirm. In this case I ignore the anonymous treatments
(n = 127) and run probit estimations to determine what effect (if any) IAT score has on the probability of opting out. Table I.12 shows the marginal effects of these estimations.
Consistent with the results above, the IAT has no significant effect on sorting. This holds
when I control for whether the sorting is costly and for race and gender of the dictator,
receiver, and both. Similar to the analysis under dictator giving, the signs of these coefficients
are also unexpected. We see that more biased dictators opt out less. Specifically, an increase
in IAT score by 1 standard deviation leads to roughly an 11% smaller chance of opting out.
As a check, I examine what happens to sorting when a dictator is biased against the race
Table I.11: The Probability of Opting Out
Probit Regression
Variable Coefficient
IAT D-score -0.095
(0.114) Costless Sorting (Pictures) 0.369
(0.253) Costly Sorting (Anonymous) -0.463
(0.547) Costless Sorting (Anonymous) 0.116
(0.370)
Constant -0.976***
(0.184)
Observations 159
Robust standard errors in parentheses *** p<0.01, ** p<0.05, * p<0.1
Source: Author’s calculation
Table I.12: The IAT’s Effect on Sorting
Probit Marginal Effects
Variable (1) (2) (3) (4) (5)
IAT D-score -0.114 -0.105 -0.108 -0.111 -0.115 (0.0727) (0.0744) (0.0814) (0.0871) (0.0933) IATxPassedBlack 0.234 0.206 0.214 0.201 0.207
(0.175) (0.177) (0.185) (0.194) (0.202) Costly Sorting -0.0949 -0.0977 -0.0960 -0.102
(0.0731) (0.0730) (0.0721) (0.0722)
Dicator Controls X X
Receiver Controls X X
Observations 126 126 126 126 126
Robust standard errors in parentheses *** p<0.01, ** p<0.05, * p<0.1
Source: Author’s calculation
holds an implicit bias against the receiver’s race.
Finally, we extend the cross-treatment exercise from above and compare anonymous
sorting to sorting when photo information is present, by way of Pearson’s test. Again, there is
This holds in costly sorting
Figure I.6: Sorting When Dictator is Biased
Source: Author’s illustration
(χ2 = 0.623, p= 0.430), and when passing to someone who’s race you are biased against
(χ2 = 0.707, p= 0.400), As such it is also unlikely that implicit bias is influencing giving on
the extensive margin, inclusive of sorting decisions.
Result 3 Amount of Implicit Bias (as indicated by IAT D-score) does not predict sorting
I.7
Small Gifts, a Robustness Check
Thus far, I have suggested that the IAT does not predict giving or sorting behaviors.
However, I have also left the door open for dictators to have awareness of their biases,
meta-cognitive abilities with respect to it, or both. This may suggest that differences in giving
are more subtle than the ones suggested above. For instance, what if biased dictators are
giving, but their giving is concentrated in small(er) gifts?
To test for this concentration, I utilize the Dislike variable from equation I.9 above,
noting that this variable highlights cases of both pro-white and anti-white bias. I also
generate dummy variables for various small gift amounts. I then run Pearson’s χ2 tests to
see if giving in those small amounts is different for biased and non-biased dictators in each
of the pictures treatments. Full results from these tests are depicted in table I.13.
Table I.13: The IAT and Small Gifts
p-value for Gift Size:
0 ≤1 ≤2 N
No Sorting 0.738 0.209 0.369 48
Sorting 0.646 0.319 0.968 127
Receiver is Black 0.367 0.256 0.647 130 Sorting & Receiver is Black 0.310 0.181 0.753 94 Whole Sample 0.927 0.893 0.496 175 *** p<0.01, ** p<0.05, * p<0.1
Source: Author’s calculation
Small giving is not different between biased and unbiased dictators in every specification.
This result suggests that biased giving is not concentrated in small giving, and lends further
credence to the above discussion of dictator giving as a whole.