THE RESPONSE OF P-Y CURVE OF SOIL-PILE CHARACTERIZED
BY THE DESIGN PARAMETERS IN LIQUEFIABLE SAND
Baydaa Hussain Maula
1, Hayder Hussein Moula
2, Hussein Yousif Aziz
3and Qais Mikhael Bahnam
11
Institute of Technology, Middle Technical University, Baghdad, Iraq
2Ministry of Higher Education and Scientific Research, Baghdad, Iraq 3
College of Engineering, Muthanna University, Samawa, Muthanna, Iraq E-Mail:baydaahmaula_2016@yahoo.com
ABSTRACT
This paper proposed the establishing procedure and introduced an OpenSessPL for investigating dynamic p-y curves in liquefying ground based on the simulated shaking table tests for pile-soil-bridge structure were conducted successfully corresponding to liquefying ground covered with clay layer simulated as a middle circumference of three layers adopting reinforced concrete single pile-pier exposed by a series of sinusoidal and EI centro earthquake events wave of different amplitudes and frequencies. A series of numerical simulations based on the established 3D finite element analysis method was carried out by including earthquake events to investigate the deveplod of p-y curves due to the effect of design parameters such as; pile stiffness, the internal angle of sand and the depth of pile insertion. The mentioned parameters beside seismic motion shape, peak acceleration (g) and degree of ground inclination have a certain theoretical and practical significance for seismic design related to lateral resistance and pile displacement.
Keywords: pile-soil stiffness ratio, depth of Insertion, dynamic pile response, dilation angle.
1. INTRODUCTION
It was a familiar event that pile foundations Suffered damage by soil liquefaction due to earthquakes [1, 2]. In fact, most of the footing destruction was supposed to be connected with the effects occurred to the ground prompted by liquefaction and / or lateral ground spreading. This suggests that the effect of soil displacement should be properly taken into consideration when determiningsafely seismic design pile foundations. An expectation of the dynamic p-y behaviors in liquefiable soils is difficult, but achievable [3]. There are some methods, like collecting data from investigational test and NFEMS, which can be anticipated such manners defined as the relationship of lateral resistance with relative displacement between soil and pile, using a large number of experimental data [4-9].
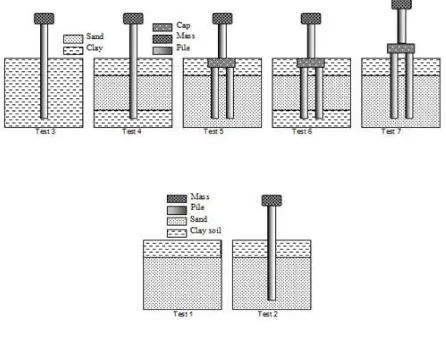
China since 2002, were performed to understand the basic mechanisms of SSPSI in Liquefiable ground, including the cases of single piles and pile groups, low/ elevated cap pile groups, pile groups, liquefiable / non-liquefiable ground, different soil profile involved of two ( horizontal /slope) [2]. Soil layers with the upper layer of thick normally consolidated silty clay and the lower layer of thick saturated sand beside experimental test of three horizontal soil layers with the upper layer of thick normally consolidated silty clay, with middle layer of deep thick saturated sand and the lower layer of thick soft clay, synoptically described in Figure-1.
These works have gotten the excessive value of finding observation on the pile performance, mostly in the soil of liquefiable trend, and have shown that the design parameters have a significant effect on dynamic p-y behaviour during liquefaction; however, it is indefinite how the shape and amplitude of the diminution of p-y curves develop through various design parameters.
Variations in soil lateral resistance during the generation of p-y curves are required for the safe design of pile foundations in an area subjected to tremble -induced lateral spreading.
[image:1.595.58.281.558.727.2]driven into composing soil strata of liquefiable sand and overlying soft clay. Due to the well-instrumented gauges and sensors to the pile, bending moments imparted on the pile shaft was measured. The Mathematical expression represented by double integration, the moment divided by EI concerning the length of the pile could generate soil displacement ysoil, while double differentiation of the
bending moment achieved lateral resistance p concerning the length of the pile.
Numerous studies and experimental researches have been carried out at centrifuge and 1-g scalesto assess the unique behavior of the soil during liquefaction [2, 10]. Many studies; researchers realized that liquefaction lowered the hardness and stability of the liquefiable layers. However, such a depression was noticed. There is an insufficiency of understanding on the shapes of the p-y curves generated at liquefaction or during subsequent events, for example, tests [11-12] adoption a turned S-shaped p-y curve convex up, rather than convex down when the surrounding soil is liquefied. Such behavior of p-y curve designates low adjacent stabilitp-y at minor to reasonable ysoil, whereas successively gives hardening at
greater one. Liquefaction sources, deviation in p-y manners, and the phases leading up to widespread liquefaction have not been sufficiently examined to contract with the p-y features.
3. NUMERICAL MODELLING OF SHAKE-TABLE TEST
3.1 Model design and layouts
The test plan was fixed via a shake-table reported by [2]. Including a 3D model of the soil-pile system, shown in Figure-2, was created with OpenSeesPL. The model dimensions are 2.0 m (long) 1.5 m (transverse) 1.9 m (height) with the same constitutive model of soil (three layers) and (Rc) pile of 2.52m, 0.62 m part left free above the examination system (soil-pile), with D= 0.1m as reported by [1, 2]. The bottom of the soil domain is y m below the pile tip. The ground surface inclination is 0, 2, 4°. Figures 2 (a) and 2 (b) and Figure 3 show the plane XZ with an isometric view of the model, with numerical elements respectively.
The limitation settings are factored in the evaluating: (1) the base of the soil domain is immovable in the three directions; (2) the boundary condition for all planes of the model is Laminar Container and; (3) Plane of symmetry is fixed in the y-direction and free in Z and X direction. The base-shaking analysis is used to assess the pile and soil behavior. Variation motion event is used as an input motion in the longitudinal (X) direction.
The test program was exposed to a set of El Centro and sinusoidal earthquake events with a changeable level of shaking as characteristic ground indication response, listed in Table-1.
Table-1. Set of seismic events.
Step event Motion Peak
acceleration (g)
A Sinusoidal 0.10g
B El Centro 0.10g
C Sinusoidal 0.20 g
(a) Plane View (b) Isotropic View
Figure-2. FEM of the SP system.
a) EDOF number b) node DOF
Figure-3. Brick element “Solid-fluid coupled 20-8 node”.
3.2 Simulation results
3.2.1 Results and interpretation
Figure-4 shows free-field displacement; pore water pressure time histories, along with horizontal ground displacements measured at the surface, 0.4 m, and 1.2 m depth. Generally, the Figure shows that the soil is less displaced under case A and B.
Soil lateral displacement focuses on the surface and the top 0.4 m of depth, as a result of liquefaction in this area. The lowest level of liquefiable sand layer confirmation minor effects performed comparable to an inflexible bulk, and it's hard to slip along the base. The upper part of the sandy soil field deforms correspondingly.
1 2
3 4
5 6
7 8
9
10 11 12
13
14 15 16
17
0 2 4 6 8 10 12 14 16 18 20 22 -0.06
-0.03 0.00 0.03 0.06
Soil surface
Dis. (mm)
0 2 4 6 8 10 12 14 16 18 20 22
-0.06 -0.03 0.00 0.03 0.06
0.4 m depth
Dis. (mm)
0 2 4 6 8 10 12 14 16 18 20 22
-0.06 -0.03 0.00 0.03 0.06
1.2 m depth
Dis. (mm)
0 2 4 6 8 10 12 14 16
0.0 0.2 0.4 0.6
0.4 m depth
ru
0 2 4 6 8 10 12 14 16
0.0 0.2 0.4 0.6
1.2 m depth
ru
Time (s)
a) Case A
0 2 4 6 8 10 12 14 16 18 20 22
-0.06 -0.03 0.00 0.03 0.06
Soil surface
Dis. (mm)
0 2 4 6 8 10 12 14 16 18 20 22
-0.06 -0.03 0.00 0.03 0.06
0.4 m depth
Acc.
(g)
0 2 4 6 8 10 12 14 16 18 20 22
-0.06 -0.03 0.00 0.03 0.06
1.2 m depth
Dis. (mm)
0.0
0.3 0.6 0.9 1.2
1.2 m depth
ru
0 2 4 6 8 10 12 14 16
0.0 0.3 0.6 0.9 1.2
0.4 m depth
ru
Time (s)
b) Case B
Figure-4. Times-histories of free-field [2].
3.2.2 Liquefaction characteristics of the ground
The noticeable movements in the soil skeleton, that yield liquefaction "are as follows: Seismic influences mainly shear waves, passing through saturated granular layers, distort the granular structure, and cause loosely packed groups of particles collapse. Disruptions to the particulate structure generated by these collapses cause transfer of load grain-of grain contacts in the pore water" [13]
Test phenomena are shown in Figure-4 (b). The following phenomena summarized as the most significant moment of the OpenSess PL due to shaking that was present at the boundary between sand and clay layers; ground displacement, were almost the same peak, only slightly larger than the calculated value of the surface in the case B value. By comparing the event A and event B,
3.3 The progress of p-y curves
As cited previously, the strategic objective of this paper was the p-y curves at the achievement levels of pore
water pressure ≤ 1.0. To generate these curves, design
parameters will be involved explaining the behavior of these curves.
3.3.1 Initial pile-soil stiffness ratio
The simulation result of Figure-6 coordinates that the flexibility of the pile; displacement of the pile head and the displacement along the pile in the lateral load direction were more significant. The pile displacement was not profound to its connected stiffness, which may be correlated to the inelasticity of the pile.
-16 -14 -12 -10 -8 -6 -4 -2 0 2 4 6 8 -2.0
-1.5 -1.0 -0.5 0.0 0.5 1.0
E=1e010 kPa E=5e005 kPa E=5e006 kPa E=1e008 kPa
Bending moment (kN.m)
2° sloping ground
D
e
p
th
(
m
)
Figure-5. Bending moment vs. Pile length for different EI.
-0.5 0.0 0.5 1.0 1.5
-1.5 -1.0 -0.5 0.0 0.5 1.0
Dis. (mm)
2° sloping ground
E=1e010 kPa E=1e008 kPa E=5e006 kPa E=5e005 kPa
D
e
p
th
(
m
)
Figure-6. Impact of stiffness of the pile in Event B.
Consistent to Figure-6, it is remarkable to note that the pile displacement is very unaffected with pile stiffness. That is, the high stiffness pile experienced about the same total movement as the low stiffness pile; however, the final bending moments, as shown in Figure-5, are vastly different. Here, the low stiffness pile produced the highest bending moment.
The results from Figure-7 specified that the stiffness of the pile had some effect on the p-y curve of the single pile in the inclined shallow soil.
-0.04 -0.02 0.00 0.02 0.04 0.06 -6
-4 -2 0 2 4 6 8
E=1e010 kPa
p
(
k
N
/m
)
-0.02 -0.01 0.00 0.01 0.02
-2 -1 0 1 2 3
E=1e008 kPa
p
(
k
N
/m
)
-0.0030 -0.0015 0.0000 0.0015 0.0030 0.0045 -1
0 1 2
y (mm)
E=5e 006 kPa
p
(
k
N
/m
)
-0.003 -0.002 -0.001 0.000 0.001 0.002 0.003 -1.0
-0.5 0.0 0.5 1.0 1.5 2.0
E=5e 005 kPa
y (mm)
p
(
k
N
/m
)
Figure-7. Effect of the stiffness of the single pile on the p-y curves of the pile at depth 0.5 m in Event A.
3.3.2. Depth of insertion effect
Considering previous lectures and research [16] the lateral response with increasing depth interval was investigated as shown in Figure-8. Response at showllar
-0.8 -0.6 -0.4 -0.2 0.0 0.2 0.4 0.6 0.8 -60 -30 0 30 60
2D = 0.4m depth 3D = 0.6m depth
p ( k N /m ) y (mm)
-1.0 -0.5 0.0 0.5 1.0
-15 -10 -5 0 5 10 15 y (mm)
4D = 0.8 m depth 5D = 1.0 m depth
p ( k N /m )
(a) Horizontal grounds (0°)
-0.4 0.0 0.4 0.8 1.2 1.6
-40 -20 0 20 40 60 80 100
2D = 0.4m depth 3D = 0.6m depth
p ( k N /m ) y (mm)
-0.4 0.0 0.4 0.8 1.2 1.6
-15 -10 -5 0 5 10 15 y (mm)
4D = 0.8 m depth 5D = 1.0 m depth
p
(k
N
/m
)
(b) 2° sloping ground
0.0 0.4 0.8 1.2 1.6 2.0 2.4
-40 0 40 80 120
2D = 0.4 m depth 3D = 0.6 m depth
p ( k N /m ) y (mm)
0.0 0.4 0.8 1.2 1.6 2.0 2.4
-15 -10 -5 0 5 10 15 y (mm)
4D = 0.8 m depth 5D = 1.0 m depth
p ( k N /m )
(c) 4° sloping ground
Figure-8. Lateral response with depth concerning pile diameter in Event C.
The p-y curves for 4° sloping ground shown in Figure-8(c) describe different types of response. For example, the first curve at a depth of 0.4 m below the ground surface displays greater resistance than the curves immediately below it. The four curves from (0.4 to 1.0 m) depth show the same manner. The two ground cases (0°) and (2°) curves from (0.8 and 1.0 m) depth match with each other. It’s produced greater lateral displacement, consistent with the two cases.
The large displacement levels are more noticeable in shallow depth than in deeper one. The reason for this happening is due to "As the shaking continues, the effective resistance of the soils has been reduced due to gapping and inherent strength degradation (the latter of
which is exhibited in the curves by the lower-than-static peak strengths for a given displacement)" [18].
3.3.3 Effect of difference between the (peaks - critical state) friction angles
-0.03 0.00 0.03 0.06 -4
-2 0 2 4 6
y.(mm)
2°sloping ground
28° 30° 32°
p
(
k
N
/m
)
-0.03 -0.02 -0.01 0.00 0.01 0.02 0.03
-4 -3 -2 -1 0 1 2 3 4 5
y.(mm)
2°sloping ground
35° 38° 40°
p
(k
N
/m
)
Figure-9. Dynamic pile response with changing dilation angle (at depth 0.5m) in Event B.
4. CONCLUSIONS AND SUMMARY
a) Design Parameter analysis shows that under the conditions of liquefaction with the increasing pile stiffness the peak (y) & (p) are reduced. Even the peak pile bending moment will be decreased; internal friction angle for sand layer decrease lateral displacement. With the depth decreases, the peak displacement of the pile increases.
b) The p-y curves and the relative displacement (y) are not strongly dependent on the groundwater table, but the relative displacement (y) is strongly dependent on the ground surface slope and pile length
c) Construction of p-y curves for inclined pile and for pile groups (horizontal & inclined) are highly recommended to capture the response. Effect of ground motion parameters on p-y need to be investigated as well.
REFERENCES
[1] Maula B.H., Ling X.Z., Liang T. & Xu P.J. 2011. 3D FEM numerical simulation of seismic pile-support bridge structure reaction in liquefying ground. Research Journal of Applied Sciences, Engineering, and Technology. 3(4): 344-355.
[2] Maula B.H., Xian Zhang L. & Liang T. 2011. Study on dynamic behavior for pile-soil-bridge structure seismic interaction in liquefying ground under strong earthquake. Journal of Emerging Trends in Engineering and Applied Sciences. 2(2): 239-244.
[3] Maula B.H. 2016. Behavior of seismic soil-pile foundation in liquefying sloping ground controlled by mechanical aspect. Journal of Emerging Trends in Engineering and Applied Sciences. 7(1): 45-55.
Department of Structural Engineering, University of California San Diego, La Jolla, U.S.A.
[5] Elgamal Ahmed, et al. 2006. Liquefaction induced lateral on the piles. In: Proceedings of the Fourth Interational conference on earthquake engineering. Taipei, Taiwan.
[6] Jinchi Lu, Zhaohui Yang, and Ahmed Elgamal. 2010. OpenSeesPL 3D Lateral Pile-Ground Interaction, Version 0.6 User Manual, University of California, San Diego, Department of Structural Engineering.
[7] Ling X.Z., Wang C. and Wang C. 2005. Scale modelling method of shaking table test of dynamic interaction of pile-soil-bridge structure in ground of soil liquefaction. Chinese Journal of Rock Mechanics and Engineering. 23(3): 450-456 (in Chinese).
[8] Xian Zhang, L. I. N. G., et al. 2004. Large-scale shaking table model test of dynamic soil-pile-bridge structure interaction in ground of liquefaction. China Civil Engineering Journal. 37.11: 67-72.
[9] Liang Tang, Pengju Xu, Ling Xian Zhang, Gao Xia. 2008. Shaking Table Test and Numerical Simulation for seismic soil-pile-bridge structure interaction in liquefiable ground. The 14th World Conference on Earthquake Engineering, Beijing, October.
[10]Tao Bo, NaI Lei, Wu Faquan. 2005. Distributive law of forces between the anti-sliding pile and the surrounding soil mass. Journal of Jilin University: Earth Science Edition. 35(2): 201-206.
Curves Considering Liquefaction during Earthquakes. Research Journal of Applied Sciences, Engineering and Technology. 7.24: 5163-5171.
[13]Samuel Tadesse. 2000. Behaviour of saturated sand under different triaxial loading and liquefaction (Doctoral dissertation. Norwegian University of Science and Technology).
[14]Hussain Maula, Baydaa. 2013. Dynamic response and simplified analysis method for bridge pile foundations in the liquefiable sloping ground (Doctoral dissertation, Harbin: Harbin Institute of Technology).
[15]Zhao-Ran, Xiao; Junlin, Wang. 2007. DEM in 3D Simulation of Influencing Factors of Deformation Properties and py Curves of a Laterally Loaded Pile. In: International Conference on Computational Science. Springer Berlin Heidelberg. pp. 1214-1222.
[16]Varun, Dominic Assimaki. 2011. A nonlinear microelement for dynamic soil-structure interaction analyses of pile foundations in liquefiable soils. January, 10-13 5th International Conference on Earthquake Geotechnical Engineering.
[17]Varun A. 2010. Non-Linear Dynamic Microelement for Soil Structure Interaction Analyses in Liquefiable Soils, PhD Dissertation, in: Civil and Environmental Engineering, Georgia Institute of Technology, Atlanta.