AN ANALYSIS OF PASSENGERS’ SEGMENTATION AND SATISFACTION
REGARDING THE DEVELOPMENT OF THE MISCELLANEOUS SERVICES
BUSINESS OF MERAK FERRY PORT
Yaya Abdul Malik*, Budhi Hascaryo Iskandar**, Kirbrandoko***
*) Post Graduate School of Business, Bogor Agricultural University, Indonesia.
**) Member of Advisory Committee and Business Management , School of Business, Bogor Agricultural University, Indonesia. ***) Member of Advisory Committee and Business Management , School of Business, Bogor Agricultural University, Indonesia.
With the increasing mobility of people and goods, the time will come when they demand transportation services with higher level of safety, security, speed, smoothness and comfort. If a transportation company or a certain form of transportation always provides services with quality that satisfies the users, the consumers will become loyal customers. Good quality of the services will increase a company’s image in the customers’ eyes. Ferry ports are vital when it comes to distribution of goods or people from one place to another. Because ferry ports are places where people shift, port areas are strategic places to extend businesses. Economic development needs transportation services that are adequate and sufficient. Without transportation as the supporting tools, we cannot expect good results in terms of the economic development of a nation. A strategy is a activity plan to reach the goals. A strategy as an activity that is incremental and, in the implementation, refers to the customers’ expectations in the future. A strategy is a vital tool in terms of creating competitive strengths. A strategy is a plan that is designed to reach targets and goals. Planning is an organization’s anticipation, what needs to be done in order to reach the goals. The purposes of this research are (1) To identify the segmentation of the passengers of Merak Ferry Port, (2) To analyze the passengers’ level of satisfaction regarding the various services business of Merak Ferry Port and (3) To analyze and formulate the proper various services business strategy to be implemented. The research method that is used is descriptive tabulation which is a statistic analysis process that includes attempts to investigate and reveal information that is relevant that the data contains. Analysis Cluster is used to reduce the data in the research into clusters. The purpose is to show the differences among the clusters created and unite the similarities based on the data achieved. Importance Performance Analysis as an indicator of the quantitative measurement scale for level of importance based on the customers’ perception and level of performance in real of a product is expressed in a form of consumers’ response regarding satisfaction in the form of Likert scale. This scale allows the respondents to express the identity of their feelings about a product’s characteristics by deciding the score of every indicator from variables X and Y, by shifting the whole data frequency with the weight.
Keywords: segmentation, consumers’ satisfaction, business strategy, Importance Performance Analysis, Analysis Cluster
I. INTRODUCTION
The water transportation sector, which includes ports and ships, has a role in connecting an island with another island so that the economic activities can be run smoothly. Besides that, the water transportation sector also has a role in supporting the economic growth of underdeveloped regions and as a tool that supports the economy of developing regions. In other words, transportation has a role in triggering the dynamic of the development through the mobility of people, goods and services as well as supporting the national distribution pattern. With the increase of the mobility of people and good, the time will come when people demand transportation services with higher level of safety, security, speed, smoothness and comfort. If a transportation company or a certain form of transportation always provides services with quality that satisfies the users, the consumers will become loyal customers. Good quality of services will make the company’s image better in the eyes of the customers.
Ferry ports are vital in the distribution of goods and people from one place to another. Because ferry ports are places where people shift, port areas are strategic places to extend businesses. Economic development requires transportation services that are adequate and sufficient. Without transportation as the supporting tools, good results in the attempts to develop the economy of a nation cannot be expected. In order to develop a nation’s economy, optimal transportation capacity is needed. However, we need to consider the fact that the determination of the capacity and the level of investment are not easy. PT ASDP is a company that runs in the field of transportation and ferry ports. Ferry ports are divided into two, which are commercial ferry ports and pioneering ferry ports. Commercial ferry ports are ports that receive benefits from their business. Merak Port is the busiest ferry port in Indonesia. The data regarding the production of passengers of Merak Ferry Port can be seen in Table 1 :
Table 1 Merak port’s passenger production data in years 2011 until 2015
Year Amount Passengers
Children Adults
2011 1.358.927 126.143 1.232.784
2012 1.414.155 130.786 1.283.369
2014 1.325.384 126.663 1.198.721
2015 1.282.660 119.434 1.163.226
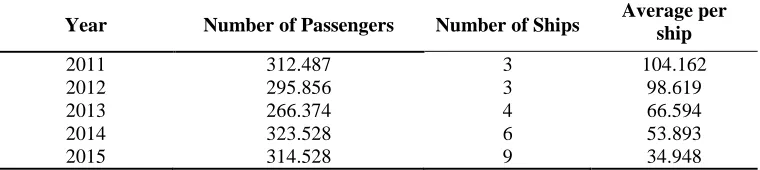
[image:2.612.117.497.178.263.2]PT ASDP is tasked by the government to be the operator of ferry ports and one of the operators of the ferries that operate in Merak Port. The number of ferries owned by PT. ASDP increases every year, but the data of the passengers who use PT. ASDP’s ferry services is not in line with the addition of the ships. In terms of the number of passengers, there is an increase, but if it is compared to the increasing number of ships, then there is a decline in the number of passengers. The data regarding the production of the passengers of Merak Ferry Port can be seen in Table 2
Table 2 The data regarding the passengers of the ships of ASDP in Merak Port in years 2011 until 2015
Year Number of Passengers Number of Ships Average per ship
2011 312.487 3 104.162
2012 295.856 3 98.619
2013 266.374 4 66.594
2014 323.528 6 53.893
2015 314.528 9 34.948
PT. ASDP as the operator of the ferry ports owns the port areas that can be used to extend their business. Business in the provision of port services to create benefits in order to enhance the value of the company by applying the principles of limited companies. There are various port services business that manages businesses in both ports and ferries. However, the various services business is currently operating in the ports only.
Based on the background and the problem formulation above, the purposes of this research are (1) to identify the (1) to identify the segmentation of the passengers of Merak Ferry Port, (2) to analyze the passengers’ level of satisfaction regarding the various services business of Merak Ferry Port and (3) to analyze and formulate the proper various services business strategy to be implemented.
II. RESEARCH METHOD
The determination of the respondents is done using the non-probability sampling which uses that convenience sampling. Convenience sampling is a sampling technique that uses the elements that are easy to be contacted, recognized and willing to cooperate in accordance with the criteria in the research.
This research includes primary data which is the data that acts as the main source of information in answering the purposes of the research. Besides that, secondary data is also needed, which is the data that acts as complement to the main data in answering the purposes of the research. There are 2 data sources which are (1) Primary Data which includes the passengers’ behaviors, passengers’ demography, passengers’ satisfaction and benchmarking data received from the results of questionnaires distributed to the passengers and interviews with the company. (2) the secondary data includes the company profile, the number of passengers and the number of business production received from the company’s documents.
The population of the research is all of the passengers of Merak Ferry Port and the passengers of the ferries owned by PT ASDP in Merak Ferry Port in 2015 whose age was 17 or above. The sampling for the research refers to the following Slovin Formula:
Note :
n : number of samples
N : number of population e : limit for error tolerance
The data analysis of this type of research is quantitative and qualitative descriptive, which identify the problem using analysis measurement tool and field observation. The data collected in the data collection phase needs to be processed first, in order to simplify the whole data collected and presented in a good and neat arrangement to be analyzed afterwards. Data processing is needed to translate the numbers received from the research results.
The data processing methods used in this research are
(1) Descriptive tabulation is an statistical analysis process that includes attempts to investigate and reveal relevant information contained in the data,
(3) Index Performance Analysis as a quantitative measurement scale indicator for level of importance based on the customers’ perception and level of performance in real of a certain product expressed in the form of consumers’ response regarding satisfaction in the form of Likert scale. This scale allows the respondents to express the identity of the respondents’ feelings regarding the characteristics of a certain product by determining the total score of every indicator from variables X and Y, by shifting the whole data frequency with the weight (Simamora, 2004).
Table 3 Weight value from the respondents’ answers
Performance Option Weight Importance Option
Very Good 5 Very Important
Good 4 Important
Adequate 3 Quite Important
Poor 2 Not Important
Very Poor 1 Not Important at all
Next, the total weight is divided by the number of respondents, the result is the mean of the weight (X) for performance and the mean of the weight (Y) for importance. In the simplification of the formula, then for every end of a factor that influences satisfaction with:
Where:
X = The average value of the performance level of the i attribute Y = The average importance of the i attribute
∑Xi = The total score of the performance level of the i attribute ∑Yi = The total score of the importance level of the i attribute N = The number of consumers’ data
Making a Cartesian diagram which is a form that is divided into four parts confined by two lines that intersect perpendicularly with the (X,Y) spot where X is the mean of the average score of the level of importance of the whole importance factors. Next, the level of the elements will be elaborated and divided into four parts into a Cartesian diagram as seen in the figure below:
Kepentingan = Importance
PrioritasUtama/Konsentrasi = Main Priority/Concentration Prestasi yang Baik (pertahankan) = Good achievement (maintain)
Prioritasrendah = Low priority Berlebihan = Excessive
Kinerja = Performance
Figure 1 IPA Cartesian Diagram (4) Customer Satisfaction Index
Where:
n = Number of consumers
Yi = Importance score of the i Y service product
Second, making the Weight Factors (WF). This weight is the MIS value percentage per service product on the total MIS of all the service products.
Where: p = the p importance service product
Third, making the Weight Score (WS). This weight is the multiplication between WF and the mean satisfaction score (X) (MSS)
Fourth, determining Customer Satisfaction Index (CSI)
Where:
p = the p importance service product
HS = (Highest Scale) The maximum scale used
The range of the customers’ satisfaction is between 0 and 100 percent. The scale range formula used is based on Simamora (2004) which is as follows:
[image:4.612.97.521.619.741.2]Based on the scale range above, the satisfaction criteria used in this research is: Table 4 Criteria of consumers’ satisfaction
Satisfaction Scale Range Satisfaction Option (0%) < CSI < (20 %) Very Dissatisfied (20%) < CSI < (40%) Dissatisfied (40%) < CSI < (60%) Quite Satisfied (60%) < CSI < (80%) Satisfied (80%) < CSI < (100%) Very Satisfied
The attribute of passengers’ satisfaction regarding the miscellaneous services business of Merak Ferry Port used in this research consists of 26 attributes. The determination of these attributes is done using the judgment method that is based on the dimension of the quality of services in previous researches and input from the representatives of the Merak branch of PT ASDP.
III. RESEARCH RESULTS
Merak Port Passengers’ Demography Segmentation
Segmentation of the passengers of Merak Port is meant to facilitate the administrators in determining the priorities in designing a marketing strategy for the port’s service business. In this research, the division of passengers segments is done using the analysis tool of Agglomerative Hierarchical Clustering (AHC), where the number of groups formed from the passengers is still unknown.
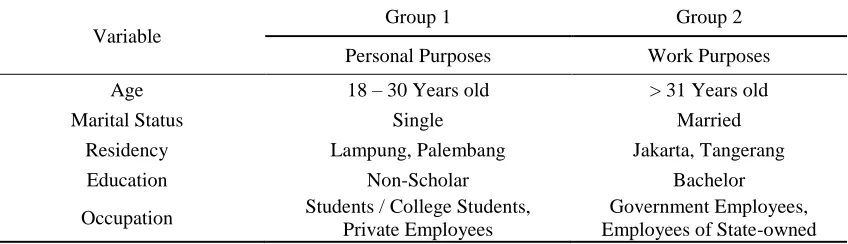
Based on the data and information received, the passengers of Merak Ferry Port are demographically divided into two groups whose grouping variables include age, marital status, residency, education, occupation, income, ferriage purpose, ferriage frequency, ferriage partners, number of ferriage partners and reasons for using ships for transportation.
Table 5 Groups of the passengers of Merak Port based on the visitors’ profiles
Variable
Group 1 Group 2
Personal Purposes Work Purposes
Age 18 – 30 Years old > 31 Years old
Marital Status Single Married
Residency Lampung, Palembang Jakarta, Tangerang
Education Non-Scholar Bachelor
Variable
Group 1 Group 2
Personal Purposes Work Purposes
Enterprises, Enterpreneur
Income < 1 million – 3 million > 3.1 million
Ferriage purpose Family business, vacation Official travel/business trip and business
Ferriage frequency < 3 times 3 times – 5 times
Ferriage partners Alone, Family members Work partners, Business partners Number of ferriage partners 1-2 people 3 people - 10 people
Reasons for using ships Sea views, Ticket price The destination is close, The complete facility
Group members 52 people 48 people
The Personal Purposes Segment
Based on the data above, 52% of the passengers of Merak Ferry Port and the ferries owned by PT ASDP belongs to the first group, which are the passengers who, on the average, are 18-30 years old, single, reside in Lampung-Palembang, non-scholars (only went to Elementary Schools, Junior High Schools, High Schools and Diploma), Students/Scholars and Private Employees. This group tends to undergo ferriage for family business and vacation for less than 3 times a month. When they travel, they generally go alone or with their family members. The sea views and the affordable ticket price are the reasons why this group uses ferries. This group has a proportion that is bigger than the other group (52 people). Based on the profile of this passenger group, the writer uses the term personal purposes segment. The use of the term personal purposes is based on the approach of the passengers’ characteristics which tend to have the affordable ticket price as the reason. Family business and vacation as the reasons behind the travel are the reasons why the term is used.
Work Purposes Segment
48% of the Merak Ferry Port passengers and the ferries owned by PT ASDP belongs to the second group, which is the passengers who, on the average, are above 30 years old, are married, reside in Jakarta-Tangerang, have a degree (Bachelor, Master, Doctoral) and work as employees in state-owned companies, government companies and entrepreneurs. This group tends to travel for official travels and business trips for less than 3-5 times a month. When they travel, they are generally accompanied by their business partners and work partners. Close destinations and complete facilities are the reasons why this group use ships to travel. This has a smaller proportion when compared to the other group (48 people). Based on the profile of this passenger group, the writer uses the term of work purposes. The use of the term work purposes segment is based on the approach of the passengers’ characteristics which tend to have official travels and business trips as their reasons for traveling.
Level of Importance and Passengers’ Satisfaction Importance-Performance Analysis
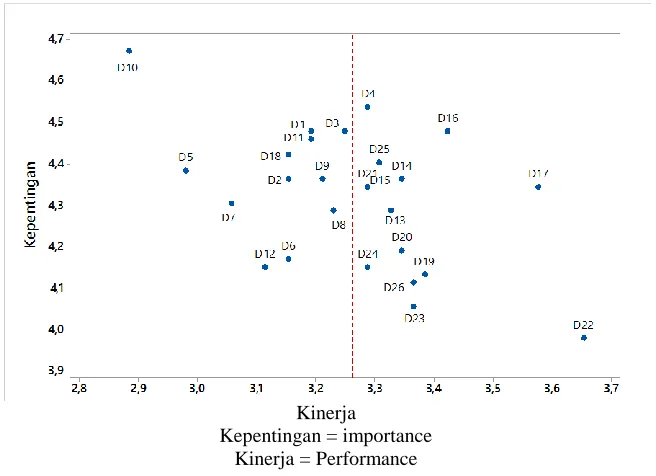
Research is done on the dimension of the quality of the services of Merak Ferry Port and the ferries owned by PT ASDP using Importance Performance Analysis to see the level of performance and importance of the dimension of quality of services. Importance Performance Analysis (IPA) is started by measuring the conformity by mapping it into a Cartesian diagram. Mapping it into a Cartesian diagram is meant to figure out which service dimension variables are included in the main priorities, maintained, low priorities and excessive. The results of this research are expected to become suggestions for the company in making policies, especially ones that are related to the service dimension discussed in this research. The research is done to 100 passengers who undergo ferriage in Merak Ferry Port and uses the ferries owned by PT ASDP using the 26 attributes asked in the questionnaire for the passengers.
Kinerja
[image:6.612.152.462.48.267.2]Kepentingan = Importance Kinerja = Performance
Figure 1 The results of IPA on the attributes of Merak Ferry Port
Custimer Satisfaction Index (CSI) Analysis
Consumers’ satisfaction is consumers’ happiness or disappointment achieved by comparing their impression regarding the performance of a product/service and their expectations regarding the performance of the product/service. If the reality is equal to or exceeds the expectations, then the consumers will be satisfied. On the contrary, if the consumers feel that the reality is not good enough, there will be dissatisfaction.
In this research, the level of passengers’ satisfaction in Merak Ferry Port is 64,05%. A Customer Satisfaction Index value that is this high belongs to the satisfied category. This indicates that the passengers of Merak Ferry Port are satisfied with the service performance of Merak Ferry Port, even though there are some attributes that need to be improved by the management party. The service attribute that needs to be improved in the future can be seen from the mapping results of each service attribute with the Importance Performance Analysis method.
Benchmarking Analysis
Benchmarking is a process of comparative study and measuring an activity of a company/organization on the best operational process in its class as an inspiration in enhancing the performance of a company/organization. This benchmarking analysis uses competitive benchmarking which provides a comparison of the competitors of a specific product or service. The purpose of this benchmarking is to determine the key of success of the strongest competitors, and then to adapt and improve it to make it better to apply. The companies used for the benchmarking are similar companies that have better services.
Table 6 Benchmarking results
DATA DESCRIPTION ABCD ASDP
Toilets’ hygiene in ships (D10)
Standard Operating Procedure regarding Toilet Manamgement 10 10 Employees maintain toilets’ hygiene in accordance with the
Standard Operating Procedure
10 8
Employees’ concern regarding the toilets’ hygiene 10 7 Employees’ responsiveness
and quickness in responding to passengers’ complaints (D18)
Standard Operating Procedure regarding Employees’ Services to Passengers
10 10
Implementation of standard operating procedure by Employees 10 9 Employees’ performance evaluation regarding the service to
passengers
10 6
Convenience of passengers’ seats in ships (D9)
Standard Operating Procedure regarding passengers’ seats 10 10 Employees ensure that the seats are in accordance with the
standard operating procedure
10 8
Employees’ quickness in repairing damaged seats 10 6
The coolness of air conditioners in ships (D11)
[image:6.612.29.581.521.743.2]DATA DESCRIPTION ABCD ASDP Employees’ quickness in repairing or replacing damaged air
conditioners
10 6
Employees ignore
passengers’ social status and treat them with respect and politeness (D25)
Standard Operating Procedure regarding employees’ treatment to passengers in relation with social status, respect and politeness
10 10
Employees treat all the passengers regardless of their social status 10 8 Petugas memberlakukan penumpang dengan hormat dan sopan
Employees treat the passengers with respect and politeness
10 8
Employees ability to provide information regarding the ships (D14)
Standard Operating Procedure regarding the provision of information about the ships by employees
10 10
Complete information facilities in the ships 10 10 Employees provide information regarding the ships to the
passengers
10 8
Importance-Performance Analysis of the Segment of Personal Purposes
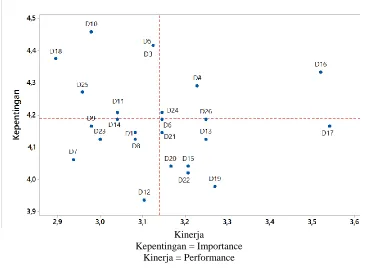
The following are the results based on the segment of personal purposes that have the ferriage purposes of doing family and vacation activities. Service quality dimension of Merak Ferry Port Services by using Importance Performance Analysis to see the level of performance and importance of the service quality dimension.
Kinerja
[image:7.612.143.471.304.542.2]Kepentingan = importance Kinerja = Performance
Figure 2 The results of the IPA analysis on the attributes of the personal purposes segment
Customer Satisfaction Index (CSI) Analysis of the Personal Purposes
Consumers’ satisfaction is consumers’ happiness or disappointment received by comparing their impression regarding the performance of a product/service and their expectations regarding the performance of the product/service. If the reality is equal to or exceeds the expectations, the consumers will be satisfied. In this research, the passengers’ level of satisfaction in the personal purposes segment in Merak Ferry Port is 65.1943%. A Customer Satisfaction Index value this high belongs to the satisfied category. This indicates that the passengers in Meraj Ferry Port are satisfied with the services of Merak Ferry Port, even though there are some attributes that need to be improved by the management party.
Importance-Performance Analysis of the Work Purposes Segment
meant to figure out which service dimension variables are included in the main priorities, maintained, low priorities and excessive. The results of this analysis are expected to become suggestions for the company in making policies, especially the ones related to the service dimension variables discussed in this research.
Kinerja
[image:8.612.117.497.88.357.2]Kepentingan = Importance Kinerja = Performance
Figure 3 The results of the IPA analysis on the attributes of the Work Purposes Segment
Customer Satisfaction Index (CSI) Analysis of the Work Purposes
Consumers’ satisfaction is consumers’ happiness or disappointment received by comparing their impression regarding the performance of a product/service and their expectations regarding the performance of the product/service. If the reality is equal to or exceeds the expectations, the consumers will be satisfied. On the contrary, if the consumers feel that the service is not good enough, there will be disappointment.
In this research, the level of satisfaction regarding the Work Purposes passengers segmentation in Merak Port is 62.810%. A Customer Satisfaction Index value this high belongs to the satisfied category. This indicates that the passengers of Merak Port are satisfied by the performance of Merak port’s services, even though there are some attributes that need to be improved by the management party. The service attributes that need to be improved in the future can be seen in the mapping results of each service attribute using the Importance Performance Analysis method.
IV. CONCLUSION
There are two segments in the identification results of the segmentation of passengers in Merak ferry port which are personal purposes and work purposes. The use of the term work purposes is based on the approach of the passengers’ characteristics that tend to undergo ferriage for the purposes of official travels, office trips and business activities. This group tends to work as government employees, state-owned enterprises employees and entrepreneurs. When they travel, they are generally accompanied by their office mates and work partners.
In this research, the level of satisfaction of all the passengers who undergo ferriage in Merak Ferry Port and use the ferries owned by ASDP is 64.05%. A Customer Satisfaction Index value this high belongs to the satisfied category. This indicates that the passengers in Merak Ferry Port and the ferries owned by ASDP feel satisfied by the performance of the services provided, even though there are attributes in the main priorities that need to be improved by the management party. The level of satisfaction of passengers in the personal purposes segment whose reasons for traveling are family issues and vacation purposes is as much as 65.19% and the level of satisfaction of the passengers from the work purposes segment whose reasons for traveling are work purposes and business purposes is as much as 62.81%. Passengers with the work purposes segment have the lowest level of satisfaction when compared to the satisfaction of the segment with personal purposes and the satisfaction of the whole passengers.
the existence of the segments of personal purposes and work purposes, the strategy that needs to be done by the company is ensuring all the available facilities in the port and the ships operate well and adding facilities for both segments in order to enhance the company’s income and enhance the passengers’ convenience. For the personal purposes segment, the company can provide facilities that can be enjoyed by families and facilities that support passengers in enjoying tourism activities in SelatSunda. For the work purposes segment, the company can provide facilities that bring convenience and do not decrease the office and business activities in enjoying the ferriage by providing rooms that completed with good internet connection and equipment which can make the ferries comfortable places to do office and business activities. They can also ensure that all the employees perform the standard operating procedures that have been made by the management party nicely so that the service to the passengers can bring comfort, safety as well enjoyment in undergoing ferriage using the ferries owned by ASDP.
BIBLIOGRAPHY
[1] Boonlertvanish K. 2009. Consumer buying and decision making behavior of a digital camera in Thailand. RU International Journal. 3(1):57-66.
[2] Engel JF, Blackwell RD, Miniard PW. 1994. PerilakuKonsumen. 1st Volume. Budiyanto, Translator. Jakarta (ID): BinarupaAksara. Translation of : Consumer Behavior.
[3] Engel JF, Blackwell RD, Miniard PW. 1995. PerilakuKonsumen. 6thed Volume 2. Budijanto, translator. Jakarta :BinarupaAksara. [4] Gagliano KB, Hatcote J. 1994. Customer expectations and perceptions of service quality in retail apparel speciality stores.
Journal of Services Marketing. 8 (1):60-69
[5] Ghufroni AZ. 2012. An Analysis of Service Performance And Passengers’ Response Regarding the Services of Jangkar Ferry Port. ournal. Malang. UNM.
[6] Griffin J. 2005. Customer Loyalty (Growing and Maintaining Customers’ Loyalty). Jakarta : PT Erlangga.
[7] Gunay GN, Baker MJ. 2011. The factors influencing consumers behavior on wine consumption in The Turkish wine market. Euromed Journal of Business. 6(3):324-341.
[8] Hamel, G danPrahalad, C, K, 1995. Future Competitions. Jakarta :BinaRupaAksara.
[9] Husein U. 2002. Marketing & Consumers’ Behaviors Research. Jakarta : PT. GramediaPustakaUtama. [10] Kasali (1998). Aiming Indonesia’s Market, STP. Jakata: GramediPustakaUtama.
[11] Kotler P. 1997. Marketing Principles. Third Edition. Jakrata : PT. Prehallindo. Kotler P. 2005. Marketing Management Eleventh Edition Volume 1. Jakarta : PT. Media KomputindoGramedia
[12] Kotler P, Keller KL. 2009. ManajemenPemasaran. Jilid ke-1. Bob Sabran, translator. Jakarta (ID): Erlangga. Translation of: Marketing Management.
[13] Kotler P, Keller KL. 2009. ManajemenPemasaran. Jilid ke-2. Bob Sabran, translator. Jakarta (ID): Erlangga. Translation of: Marketing Management.
[14] Massnick F. 1997. The Customer is CEO: How to Measure What your Customer Want and Make Sure The Get It. New York (US): American management Association.
[15] Porter, Michael E, (1996), Competing Strategy : Techniques to Analyze the Industry and the Competitors, Erlangga, Jakarta. [16] Rangkuti, Fredy. (2003). Measuring Customer Satisfaction: Gaining Customer Relationship Strategy. Second Printing.
GramediaPustakaUtama, Jakarta.
[17] Simamora B. 2004. PanduanRisetPerilakuKonsumen Consumers’. Jakarta (ID): GramediaPustakaUtama. [18] Sumarwan, 2011. PerilakuKonsumen: TeoridanPenerapannyadalamPemasaran. Bogor (ID): Ghalia Indonesia. [19] Umar H. 2000. RisetPemasarandanPrilakuKonsumen. Jakarta (ID): GramediaPustakaUtama.
[20] Zeihmal VA, Bitner MJ. 2000. Services Marketing : Integrating customer focus across the firm. 2nd Ed. New York (US): McGraw Hill.
AUTHORS
First Austhor – Yaya A Malik ST. Yaya A Malik was born in Ciamis, October 6th 1989. He is a bachelor degree of Information Engineering from Siliwangi University 2012, and Bogor Agricultural University. This author became a Member (M) of PT ASDP Indonesia at Central Jakarta, Indonesia in 2013. Post Graduate, School of Business, Bogor Agricultural University, Indonesia.
Email: [email protected]
Second A. Author – Dr. Ir. Budhi H IskandarMSi Member of Advisory Committee and Business Management Management , School of Business, Bogor Agricultural University, Indonesia
Email : Email: [email protected]
Third A. Author – Dr. Ir. Kirbrandoko MSM, Member of Advisory Committee and Business Management Management , School of Business, Bogor Agricultural University, Indonesia.
Email: [email protected]