Balancing Current and Efficiency Modelling of Single
Switch Active Balancing Systems for Energy Storage
Systems
I. Aizpuru, U. Iraola, J.M. Canales, A. Goikoetxea, E. Garayalde
University of Mondragón, 20500 Mondragón, Spain
Abstract- High Power battery packs are a series/parallel connection of single energy storage cells.The series connection of cells affects in the whole battery pack energy and power due to the unbalancing behavior of each different cell. To improve the whole battery pack energy a balancing system is connected. Passive balancing systems are wasteful and do not increase the Battery pack energy during discharge. Active balancing systems are efficient but most topologies add big complexity to the BMS
work. Single switch active balancing systems are simple and reliable. During this work the main balancing current modelling and efficiency equations are presented for the most important single switch active balancing systems. These expressions permit to evaluate the balancing power of the system, and to know how much energy is balanced during the balancing system process between the Weak cell and the Strong cells. Experimental validation of each balancing system is implemented to compare balancing power, efficiency and behavior.
Index Terms- Active balancing systems, Battery management systems, Energy conversion, Energy efficiency, Energy storage.
Nomenclature
n Number of series connected cells []
VPACK Battery Pack voltage [V] VB,i ithcell voltage [V] VB,W Weakcell voltage [V] VB,S Strongcell voltage(s) [V] Dcri Critical duty cycle ratio[] D Working duty cycle ratio[]
Ts Switching period [s]
IB,i ith cell ideal balancing current [A] IB,S Strongcell ideal balancing current [A] IB,W Weak cell ideal balancing current [A] PB,i ith balancing system ideal power [W] PB,T Total ideal balancing system power [W] I*B,i ith cell real balancing current [A] I*B,S Strongcell real balancing current [A]
I*B,W Weak cell real balancing current [A] P*,B,i ith balancing system real power [W] P*B,T Total balancing system real power [W] PLoss,T Total balancing system power loss [W] η Balancing system efficiency [%]
VPS,i ith power supply voltage [V] IPS,i ith power supply current [A]
I. INTRODUCTION
riven by nowadays increase of power and energy demand several continental, national and regional energy strategy plans have been developed with the main issue of decreasing primary energy sources and increase insertion of renewable energies, decrease CO2 emissions and increase energy efficiency [1], [2].
Energy storage systems ESS are the main technology to help increasing the impact of renewable energy, as wind energy and photovoltaic generation[3]–[15], or the insertion of the hybrid and electric car[16]–[21].
Inside ESS systems battery based energy systems are one of the most promising technologies. High power battery packs are a series/parallel connection of single battery cells or small battery modules[22]–[27].
Series connection of battery cells have an unbalancing effect in the battery pack, due to differences between cells [28]– [31], inducing a total battery energy and performance reduction[32], [33].
Passive balancing is the most used balancing technique, but it is wasteful and the balancing procedure is only useful during charge process[34]–[36].
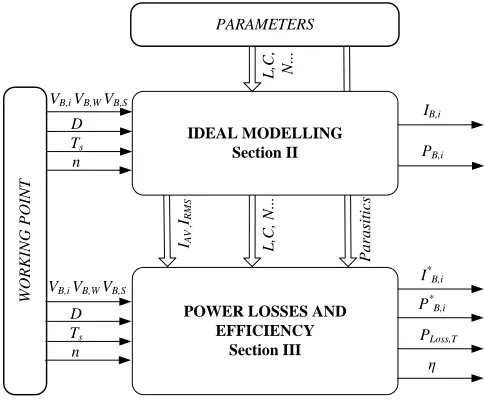
Active balancing systems are more efficient but are complex, with high number of switching devices, which increase the price and decreases the competitiveness of these devices[37]– [44].To decrease the complexity of active balancing systems single switch balancing topologies are a great option[45], [46]. A single switch is used to balance all the cells, with the possibility of controlling the active switch with an open loop strategy. In the present work, a generalized description of main single switch topologies for active balancing systems will be given. The main goal of the present work is to model the current of the active balancing systems shunted from each single cell. It is the main parameter in the design and sizing of the balancing system. The efficiency of the balancing system is also modelled, to know the power loss respected to the ideal current model. As the first step in section II, main single switch balancing topologies and modelling equations will be presented. These equations are the main part for the balancing system sizing. In section III, power losses of the single switch balancing circuits are modelled. The power losses of balancing circuits are of great impact and interest in balancing systems because they
manage low balancing power and the losses have big influence on the balancing currents. With the power losses the balancing currents are recalculated.
During section IV, experimental results of real prototypes will be presented and compared to modelling results. Special interest will be presented regarding power losses and efficiency of the prototypes.
Ideal modelling of single switch balancing topologies Opel loop switching control (no feedback control) is possible in single switch balancing systems guaranteeing the Discontinuous Conduction Mode DCM during the full working range. During the first step the most important issues to guarantee the DCM will be presented. After the main issues of current balancing will be presented to finish with the ideal balancing current models.
Open loop Discontinuous Conduction Mode DCM
Single switch active balancing topologies must guarantee the DCM to work in an open loop control mode.
1 2 1 2 2
1 DCM
0
ON OFF OFF S
T T T T
D D D
D
+ + =
+ + =
≥
(1)
The critical duty cycle ratio Dcri is the maximum working
duty cycle Dto guarantee the DCM. Dcri is defined when the
value of the zero current period D2 is zero.
1 2
1 , for 0 cri
D = −D D = (2)
The only requirement to guarantee the DCM mode is to keepD behind or equal to Dcri.
, for DCM cri
D≤D (3)
I
deal current modelling of single switch balancing topologies
Single switch balancing system topologies perform voltage based balancing. The balancing system equals all the voltages of the series connected cells by the natural topology behavior. When the voltage is equal in all nseries connected VB,icells, no
balancing current IB,iis injected nor extracted from the cells.
,1 ,2 ... ,n 1 ,n, , 0
B B B B B i
V =V = =V − =V I = (4)
When a voltage unbalance occurs, the cell with the lowest voltage VB,W, for now on Weak cell, receives energy from the
higher voltage cells VB,S, henceforth Strong cells.
, , , , , ,
, 0 receive energy
, 0 give energy
B W B i B W
B S B W B S
V V I
V V I
< >
> < (8)
During the ideal current modelling, the balancing current
IB,iof each single series connected cell will be defined under a
voltage unbalanced condition, with one Weak cell and (n-1) Strong cells.
The maximum Dcriwill be defined respect to the Weak cell
voltage VB,W and the Strong cell voltages VB,S. All cells that are
not considered Weak are considered Strong cells.
The battery pack voltage VPACK is defined as the sum of
each single cell voltage VB,i, or the sum of the Weak cell voltage VB, W with the Strong cell voltages VB,S.
1 , , ,
1 1
n n
PACK B i B W B Si
i i
V V V V
−
= =
=
∑
= +∑
(9)During a complete switching period the generalized equations that determine the mean AV and the root mean square values of the switching variables are expressed by
1
2 2
1
2 2
1 2
1
1 2
2 2
1
...
...
T i n
T i n
i n
RMS n
AV AV AV
RM
AV A
S i RMS RMS R n
V i
M
i
S n
X X D X D X D X D
X X D X D X D X D
=
=
=
=
= + + +
= + + +
∑
∑
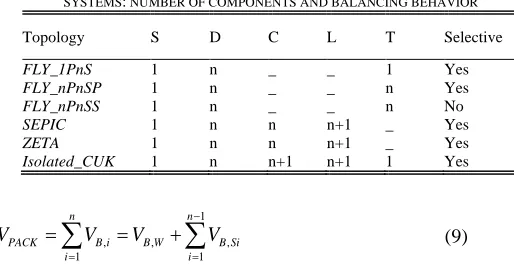
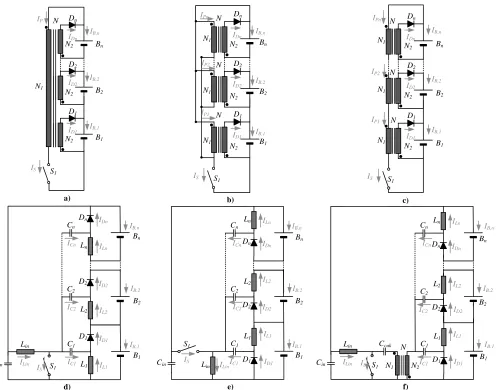
(10)The topologies under study are 3 flyback based topologies and 3 buck-boost. The main parameters of these topologies regarding number of components and balancing behaviorare presented in Table I.
FLY_1PnS
The FLY_1PnS is a flyback converter of 1 primary and
nsecondaries wounded in the same magnetic core. The main advantage is that a single core is used to balance all the cells. The main disadvantages are that is not modular and deviations occur due to differences between windings. Good transformer design, by coaxial windings [47] or the use of commercial multiwinding transformers is necessary to avoid deviation between windings. The energy is inserted during TON to the primary inductor L and
after that the Weak cell secondary is polarized, inserting all the energy to the Weak cell during TOFF1. TOFF2 guarantees de DCM.
The Strong cells only give energy during the TON time because TABLE I
CHARACTERISTICS OF THE MAIN SINGLE SWITCH ACTIVE BALANCING SYSTEMS: NUMBER OF COMPONENTS AND BALANCING BEHAVIOR
Topology S D C L T Selective
FLY_1PnS 1 n _ _ 1 Yes
FLY_nPnSP 1 n _ _ n Yes
FLY_nPnSS 1 n _ _ n No
SEPIC 1 n n n+1 _ Yes
ZETA 1 n n n+1 _ Yes
Isolated_CUK 1 n n+1 n+1 1 Yes
, ,
B W cri
PACK B W
NV D
V NV
= +
2 ,
,
1 2
PACK s PACK
B W
B W
V D T V
I
L V
= −
2 ,S
2
PACK s
B
V D T
I
L = − PACK
V L
PACK pk
V
I DTs
L
=
ip
iB,W
pk
I
−
iB,S
, 2
B W
V N L
TON TOFF1
TS
TOFF2
pk
[image:2.612.316.573.80.218.2] [image:2.612.364.577.555.741.2]their secondaries are not polarized during TOFF1.
During Appendix the main current waveforms of the battery cells will be presented under different unbalancing effects.
FLY_nPnSP
The FLY_nPnSP is a flyback based design with n magnetic cores connected in parallel in the primary. The secondary of the n
magnetics core is connected to each series connected cell. The main advantages are the modularity of the design and the high current capability, although it has high power losses due to high current necessity to magnetize all transformers.The current waveforms could be analyzed under different unbalancing situations inAppendix.
During TONall the magnetizing inductances L are charged
with the battery pack voltage VPACKinducing a big current
through all the series connected cells. During TOFF1 the voltage
of the Weak cell is reflected in the primary by the transformer ratio N, so all the energy stored in all the magnetizing inductors is released to the Weak cell.
The Strong cells inject energy to the circuit during TON
decreasing their total energy. During TOFF1 there is not energy
a) b) c)
[image:3.612.53.549.55.445.2]d) e) f)
Fig. 3. Main single switch active balancing topologies schematics. a) Flyback with 1 primary and nsecondaries with single core FLY_1PnS b) Flyback with n
primaries and nsecondaries with the primaries connected in parallel FLY_nPnSP. c) Flyback with n primaries and nsecondaries with primaries connected in series FLY_nPnSS. d) The multistackedSepic topology SEPIC. e) The multistacked Zeta topology ZETA. f) The multistackedCuk topology in the isolated
configurationIsolated_CUK.
Dn
Bn
D2
B2
D1
B1
S1
IB,n
IB,2
IB,1
IS
IDn
ID1
ID2
IP N
N1
N2
N2
N2
Dn
IB,n
D2
IB,2
D1
IB,1
S1
IS
IDn
ID1
ID2
IPn
IP1
IP2
N N N
N2
N2
N2
N1
N1
N1
Bn
B2
B1
Dn
Bn
D2
B2
D1
B1
S1
IB,n
IB,2
IB,1
IS
IDn
ID1
ID2
IPn
IP2
IP1
N
N
N
N2
N1
N2
N1
N2
N1
S1
IB,1
IS
C1
L1
D1
IL1
ID1
IC1
C2
L2
D2
IL2
ID2
IC2
IB,n
Cn
Ln
Dn
ILn
IDn
ICn
IB,2
Cin
Lin
ILin
B2
B1
Bn
S1 IB,1
IS
IB,n
Cn
Ln
Dn
ILn
IDn
ICn
IB,2
Cin
C1
L1 IL1
D1 ID1
C2
L2 IL2
D2 ID2
Lin ILin
IC2
IC1
Bn
B2
B1
S1
IB,1
IS
IB,n
Cn
Ln
Dn
ILn
IDn
ICn
IB,2
Cin
Lin
ILin
Ccuk
N1 N2
N
Bn
B2
B1
C1
L1 IL1
D1 ID1
IC1
C2
L2 IL2
D2 ID2
IC2
, ,
B W cri
PACK B W
NV D
V NV
=
+ (11)
2 ,
,
1 2
PACK s PACK
B W
B W
V D T n V I
L V
= −
(12)
2 ,S
2
PACK s
B
V D T n I
L
= − (13)
Fig. 2. FLY_nPnSPmain balancing current waveforms and equations. PACK
V L
PACK pk
V
I DTs
L
=
ipn
iB,W
pk I n
−
iB,S
, 2
B W
V n
N L
−
TON TOFF1
TS
TOFF2
PACK
nV L
pk
[image:3.612.39.288.513.709.2]insertion to the Strong cells, so they only suffer energy decrease during TON balancing the total series connected system.
FLY_nPnSS
The flyback converterFLY_nPnSS is a series connection of
n magnetic cores. The transformers are serialized and all magnetized by the same current from the battery pack. The main advantage is the modularity, but the most important drawback is the non-selective behavior.
The magnetizing inductors L of each transformer are charged during TON. During TOFF1, the energy introduced to each
transformer, is inserted back to each cell with a variable TOFF1
time depending on each cell Voltage VB,i.
The Weak cell will have the biggest TOFF1 time so it will receive
the biggest amount of charge, performing the balancing procedure. In the other hand, the biggest voltage cell or the strong cell, will have the smallest TOFF1, receiving less energy
than the energy supplies by itself.
Although each cell will have its TOFF1 time, the critical duty
cycle Dcri must be guaranteed for the Weak cell voltage VB,W. SEPIC
The multistacked based Sepic converter SEPIC is a Sepic converter topology with n outputs stacked in series. The analysis of the balancing current IB,iis not obvious so the different
waveforms for different balancing situations will be presented in Appendix. The balancing current shape is dependent on the situation of each cell in the series connected string. The current ripple of the current is always bigger in the bottom connected cell.
For the analysis of the mean balancing current IB,i, is easier
to analyze the circuit in a steady state situation. The capacitor charge balance gives ICi=0, and IDi=ILi. The only diode that
conducts is the Weak cell diode so ID,S=0. Finally using
Kirchhoff’s current law we can determine that the balancing current IB,iis
,i ,
B D i Lin
I =I −I
(19)
During TON all the inductors Li and Lin are charged, but
during TOFF1 only the diode of the Weak is polarized inserting all
the energy to the Weak cell.
The main advantages are the transformer free solution and an easy modularity. The disadvantage is the different instantaneous current through the different series connected cells.
ZETA
The ZETA is also a multistacked based buck-boost topology. It has the same advantages and disadvantages of the
SEPIC converter. The instantaneous currents are also different depending on the cell position of the series connected stack. The balancing current ripple is bigger in the top connected cell. The instantaneous currents can also be found in Appendix. Another disadvantage is also the high side switch of the topology.
The balancing current is defined as the SEPIC converter in (22), and the analysis of the current in steady state is equal. During TONL,i and Lin are charged and during TOFF1 the Weak
, ,
B W cri
PACK B W
V D V V = + (20)
(
)
2 , , 1 2PACK s n in PACK
B W
n in B W
V D T L nL V
I
L L V
+
= −
(21)
(
)
2 ,
2
PACK s n in
B S
n in
V D T L nL I
L L +
[image:4.612.290.558.67.274.2]= − (22)
Fig. 6.ZETAmain balancing current waveforms and equations.
iLin
iLn
iDn
TONTOFF1
TS TOFF2 PACK n V L PACK in V L , B W n V L − iLW iLS , ,
B W B W
n in
V n V
L L − − iD,W iDS=0 , B W in V L − , , B W cri PACK B W NV D V NV n = + (14) 2 , , 1 2
PACK s PACK
B i
B i
V D T V
I
nL nV
= −
(15)
Fig. 4.FLY_nPnSSmain balancing current waveforms and equations. PACK V nL Pack pk V I DTs nL = ipn iB,W iB,i , 2 B W V N L −
TON TOFF1
TS TOFF2 pack V nL − , 2 B i V N L − TOFF1n pk NI , , B W cri
PACK B W
V D V V = + (16)
(
)
2 , , 1 2PACK s n in PACK
B W
n in B W
V D T L nL V
I
L L V
+
= −
(17)
(
)
2 ,
2
PACK s n in
B S
n in
V D T L nL I
L L +
[image:4.612.40.292.74.268.2]= − (18)
Fig. 5.SEPICmain balancing current waveforms and equations.
iLin
iLn
iDn
TONTOFF1
TS TOFF2 PACK n V L PACK in V L , B W n V L − iLW iLS , ,
B W B W
n in
V n V
[image:4.612.317.575.506.717.2]cell diode is only polarized for IB,W.
Isolated_CUK
The Isolated_CUK topology is a multistacked topology based on the Cuk converter in its isolated configuration to reverse the polarity.
The balancing current IB,iis calculated in the steady state
situation with (22). The instantaneous currents for different unbalancing situations are presented in Appendix. The current ripple is bigger in the bottom connected cell, however the current ripple in the Isolated_CUK is smaller than in the SEPIC and
ZETA buck-boost topologies.
The biggest advantage of the Isolated_CUK is the modularity and the degree of freedom given by the transformer ratio N, to determine Dcri.The disadvantages are the requirement
of extra components as the transformer and the split capacitor
Ccuk.
During TON the inductors are charged and during TOFF1 the
inductors are discharged to the Weak cell. Power losses and efficiency modelling
Active balancing systems have higher efficiency than passive systems; they transfer charge between cells instead of burning the energy in a power resistor. However the efficiency of these systems is not 100% and a piece of the energy transfer of the ideal modelling is wasted in power losses.
Due to this power loss the energy transfer is reduced, and has to be taken into account. Due to DCM operation of the single switch balancing systems the efficiency modelling is harder than in CCM because
CCM
DCM
AV RMS AV RMS
I I
I I
≈ →
≠ → (26)
And each component RMS current should be calculated to correctly determine the power losses and efficiency. The efficiency and power losses are dependent on the working point and the parameters of the converter.
The working point are the series connected cell voltagesVB,ior Weak and Strong cell voltages, the number of cells n, the dutycycle ratio Dand the switching period Ts.
The parameters of the converter are the value of each passive component (L,C, N...) and the parasitic (RL,ESR,RDSON,VD,RD…). The parasitics are only used for the
efficiency and power loss calculations.
Under an unbalancing situation, the ideal balancing power of the cells P,B,Iis given by the ideal modelling currents of
Section II by
, , ,
B i B i B i
P =V I (27)
The total balancing power is defined by the sum of the module of each balancing power.
, , 1
n
B T B i
i
P P
=
=
∑
(28)The power losses of the converter PLoss,Tare calculated with
the RMS and AV currents of each component. Switching losses are neglected due to low impact in DCM mode.
The real balancing powerP*B,Tmanaged by the balancing
system, is then smaller than the ideal balancing power. *
, , ,
B T B T Loss T
P =P −P (29)
The efficiency η analysis is not obvious because a balancing system is not a typical input-output system. The cells act as both input and output sources, so the efficiency will be analyzed respect to the maximum ideal power as
*
, , ,
, ,
100 100
B T B T Loss T
B T B T
P P P
unbalanced
P P
η= ⋅ = − ⋅
(30)
The power losses PLoss,T are mainly due to the high
balancing current redirected to the weak cell I*B,W. To recalculate
the real balancing currents I*B,i the power PLoss,T is only
subtracted to the balancing power of the Weak cell, so
IDEAL MODELLING Section II
VB,i VB,W VB,S
WORKING POINT
PARAMETERS
D Ts
POWER LOSSES AND EFFICIENCY
Section III
IAV
,
IRMS
L
,C
,
N
...
L
,C
,
N
...
Parasitics
IB,i
I*B,i
P* B,i
PLoss,T η n
D Ts n VB,i VB,W VB,S
PB,i
Fig. 8 Current balancing modelling strategy, with an ideal power loss modelling and an adjustment based on efficiency and power losses calculation.
, ,
B W cri
PACK B W
NV D
V NV
=
+ (23)
2
2
, 2
,
1 2
in
PACK s n
PACK B W
B W n in
nL
V D T L
V N I
V N L L
+
= −
(24)
2
2
, 2
2
in
PACK s n
B S
n in
nL V D T L
N I
N L L
+
= − (25)
Fig. 7Isolated_CUKmain balancing current waveforms and equations.
iLin
iLn
iDn
TONTOFF1
TS
TOFF2
PACK n
V NL
PACK in
V L
,
B W n
V L
−
iLW
iLS
, ,
B W B W
n in
V n V
L L
− −
iD,W
iDS=0
,
B W in
NV L
[image:5.612.317.559.58.258.2]* , ,W
, , , *
,
, , , *
, ,
,
affect
Loss T B
B W B W Loss T B W
B W
B S B S
B S B S
B S
P I
V I P
I
V
V I
I I
V →
− =
= =
(31)
For the non-selective case of the FLY_nPnSS the power losses are distributed to all the cells. The lowest voltage cell has bigger power losses that the Strong cells. The power losses
PLoss,Tare distributed inversely to the voltage of the cells as
_ *
, ,
, , 1 , ,
* ,
,i
FLY nPnSS
Loss T B i
n
Loss T B j j j i B i B i
PACK B i
B
P I redistributed to all cells
P V
V I
V I
V
= ≠
→
− =
∑
(32)
For a balanced situation the equations are different because the ideal balancing power PB,i=0, because there is not balancing
current in a balanced situation (4).
However in the real situation there is a small balancing power to compensate the power losses of the converter.
The real balancing power of the balancing system P*B,Tis
only used to compensate the power losses, so the efficiency of the converter is 0 because it does not transfer any energy. The efficiency equation is different for balanced and unbalanced situation.
, *
, , *
, , *
,
0
100 0 B T
B T Loss T
B T Loss T
B T
P
P P balanced
P P
P
η
=
≈
−
= ⋅ ≈
(33)
Experimental results
To evaluate the ideal modelling and the power loss and efficiency models presented in Section II and Section III the 6 balancing systems under study have been designed to evaluate mod elling equations.
The balancing converters are designed for a 4S1P 6.5 Ah LiFePO4 battery pack, so the series connected cell umber is n=4. The maximum cell voltage of LiFePO4 cells is 3.65 V and the minimum cell voltage is 2 V. The converter is designed to inject to the Weak cell a fixed balancing current IB,Wunder the biggest
unbalancing situation, with the Weak cell voltageVB,W at 2V and
the rest 3 Strong cells VB,Sat maximum 3.65 V. The battery pack
voltage for that unbalancing situation is defined by (6) to VPACK=
12.95 V.
The switching frequency Fs has been defined to 100 kHz, so
the switching period Ts is 10 µs. The Weak cell balancing current IB,W was defined as 400 mA, except for the FLY_4P4SS which
was defined as 100 mA. The parameters to meet these
characteristics are defined in Table II. The differences between the designed converter and the real prototypes respect to ideal current modelling are presented.
Forthe flyback topologies when defined as Lnin Table IIis
referred to the magnetizing inductance L. For the magnetic components WürthElektronik devices are used. The transformers are 1:1 relation WE-DD series Power Chokes. The inductors are WE-PD3 SMD Shielded Power Inductors.
The capacitors for the charge transfer of the buck boost topologies are Kemet SMD MLCCs withCn= 10µF. The
high capacitance value is defined to guarantee a constant voltage during the whole switching period in the capacitor.
1. Table II
2. Design and Ideal Prototype parameters for a working point of one Weak cell VB,W=2 V and 3 Strong cells VB,S=3.65 V for 4S1P
battery pack n=4 switching period Ts=10 µs
3. Design 4. 5. Prototype
Topology 6. IB,W
[mA]
7. D 8. []
9. Ln
[µH] 10. Lin[µH]
11. N 12. []
13. 14. IB,W
[mA ]
15. D 16. []
17. Ln
[µH]18. Lin[µH]
19. N 20. []
FLY_1P4S 400 0.134 16 _ 1 500 0.13 12 _ 1
FLY_4P4SP 400 0.134 63 _ 1 600 0.13 40 _ 1
FLY_4P4SS 100 0.382 15 _ 1 144 0.38 10 _ 1
SEPIC 400 0.134 66 427 _ 365 0.13 68 470 _
ZETA 400 0.134 66 427 _ 365 0.13 68 470 _
Isolated_CUK 400 0.134 66 427 1 365 0.13 68 470 1
[image:6.612.34.577.446.577.2]a) b) c)
Fig. 9 Balancing system connection for a 4S1P configuration. a) Real battery test configuration. b) Simulated test bench configuration. C) Flow chart for power and efficiency measurements with direct power supply measurement.
Balancing system
I*
B,i
P.S Rsupply
IPS,i I*B,i
P.S Rsupply
VPS,i
P.S Rsupply
P.S Rsupply Balancing system With balancing
system Without balancing
system
IPS1,i
VPS1,i
Switch on balancing system
IPS2,i
VPS2,i
Calculate P
Loss
,
P
* B
,i
,I
* B
,i
,
η
1
The isolated_CUK converter isolation is made by a WE-DD 47 µH magnetizing inductor 1:1 transformer and the capacitor split CCUK =10 µF.
The diodes Dn are low voltage drop Vishay SL13-E3/61T –
Schottky rectifiers. Schottky diodes reduce power losses in low voltage applications.
The low RDSON “Power Trench” FDS6682 N-Channel
Mosfet of Fairchild Semiconductor have been used as the single switch for the 6 different topologies.
The duty cycle D is fixed. The DCM is guaranteed for all the operating points because the critical duty cycle Dcri is
calculated for the biggest unbalancing situation.
To switch the power converter in an open loop configuration a GW INSTEK AFG-2005Arbitary Function Generator has been used. This function Generator gives the versatility of full duty cycle control, 0.01 to 0.99, for a 100 kHz base frequency.
To prove the balancing behavior of the single switch balancing systems an experimental test bench has been designed. The experimental test bench consists of one power supply and a parallel connected resistorRsupply simulating a single battery cell.
The parallel connection of the power supply and the power resistor permits to simulate the two quadrant behavior of a single battery cell. The power supply gives energy when simulating a
Strong cell and the resistor absorbs current when current is injected to the Weak cell. The power capability of theRsupply has
to be high enough to absorb all the energy delivered by the balancing system.
To simulate the 4 series connected single cells 2 high performance HamegHM7042-5 power supplies are used. Each power supply has 2 independent voltage outputs where a 3.3 Ω high power Rsupply is connected in parallel. After that the
simulated battery cells are connected in series to simulate a 4S1P battery pack.
The Hameg HM7042-5 permits to read directly the currentIPS with 1 mA resolution and the voltageVPS with 10 mV
resolution. The good resolution permits to obtain accurate power measurements directly from the power supply.
To measure the main parameters of the converter the flow chart of Fig. 9 c) is presented which is divided in two steps First step (step 1) measures the current IPS1,iand the power PPS1,iof each power supply with the resistors connected, the
balancing system connected, but the balancing system switched off. During step 1 the power supply will only power the resistors. During step 2 the balancing system is switched on. The voltageVPS2,i and the current IPS2,iof each power supply is
measured. The power supplies continue to injecting the same power to the resistors, but the power losses of the converter are also supplied. The balancing system should give current to the less voltage resistor, decreasing the current contribution from the less voltage power supply, and increasing the current contributed from the high voltage power supplies.
During step 1 and step 2 the current fed to the resistor is equal because the voltage does not change. The change in the supply current is due to the balancing process of the balancing system. During step 1 I*B,i=0, so the real balancing current I*B,icould be easily measured by the difference between the
supply current in step 1 and the supply current in step 2. *
, 1, 2,
B i PS i PS i
I =I −I (34)
The balancing power P*B,i is then defined by the balancing
current and the power supply voltage, the total balancing power
P*B,T is defined in the same way as in(28).
4
* * * * *
, , , , , , , 1
B i B i B i PS i B i B T B i
i
P V I V I P P
=
= = =
∑
(35)During step 1 the only power consumption are the Rsupply
resistors. When the active balancing converter is connected we have the Rsupply losses and the total power loss of the converter PLoss,T. The power ofstep 2 minus the power of step 1 are the
converter total power losses PLossT
4 4
, 2, 2, 1, 1,
1 1
Loss T PS i PS i PS i PS i
i i
P V I V I
= =
=
∑
−∑
(36)The efficiency of the balancing system η is them calculated as
* , *
,
B T
B T Loss
P
P P
η=
+ (37)
Behavior under unbalancing situation
The first experimental step is to verify the correct behavior of the 6 single switch unbalancing systems under unbalancing situation. For that issue the test bench will be configured under two different unbalancing situations.
The first unbalancing situation will be a small unbalance between cells. The Weak cell simulated Power Supply will be established at VB,W=3.1 V and the Strong cell voltages to VB,S=3.2 V.
The second unbalancing situation will be a big unbalance. The Weak cell voltage is VB,W=2 V and the strong cell voltages
will be established to the maximum cell voltages of the LiFePO4 cells VB,S=3.65 V.
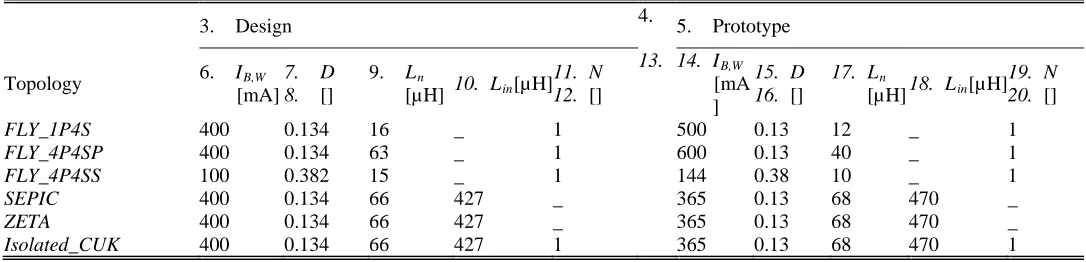
Fig. 10presents the balancing currents under different situation with the ideal design values under dashed lines (--) and
a)
b)
Fig. 10.Weak cell balancing current IB,W and Strong cell
balancing current I*B,S under an unbalancing situation. Dashed
(--) ideal balancing currents IB,i and filled-circle(o) real balancing
currents I*B,i a) Small unbalance VB,W=3.1 V VB,S=3.2 V b) Big unbalance: VB,W=2 V and VB,S=3.65.
-0.1 0 0.4
I B,i
[
A]
FLY 1P4S FLY 4P4SP FLY 4P4SS SEPIC ZETA I l t d CUK
IB,W
I B,S
-0.2 0 0.6
I B,i
[
A]
FLY_1P4S FLY_4P4SP FLY_4P4SS SEPIC ZETA Isolated_CUK
I B,W
[image:7.612.37.286.452.671.2]the real application currents in filled circles (o). The ideal balancing current is bigger than the real balancing current. During small unbalance and big unbalance the Weak cell balancing current IB,Wis always higher than the Strong cell
balancing currentIB,S. A natural balancing process occurs
between Strong cells and the Weak cell.
The non-selectiveFLY_4P4SS converter gives the smallest difference between the Weak cell balancing current and the strong cell current. This topology will not be suitable when big balancing power is required to balance the cells in a short period of time.
The primary parallel connected FLY_4P4SP gives big balancing current under big unbalancing situations Fig. 10 b)., however in small unbalancing conditions Fig. 10 a), the high power losses reduce the balancing power of the converter.
Behavior under balanced situation
During balanced situation the power losses and the balancing power are nearly equal as presented in (30).
The balanced situation is generated with VB,i= 3.65 V to
generate the maximum power losses.
Fig. 11presents the difference between the real balancing power P*B,Tand the total power lossesPLoss,T. It is demonstrated
that the balancing power only exchanges power to meet the power losses requirement.
Regarding to (33) is clearly seen that the efficiency η is nearly 0. Little differences appear in the FLY_4P4SP and the
Isolated_CUK due to non-idealities, but they have not big impact.
Model and experimental comparison
Experimental results and model equations are going to be compared under an unbalancing situation. Main parameters and results are resumed in Table III.
The unbalancing is performed between a Weak cell voltage
VB,W=2 V and the strong cell voltages VB,S=3.65 V.
First the power losses Ploss,Tand the total balancing power PB,Twill be compared between the ideal modelling, the modelling
with the power losses taken into account and the real experimental results.
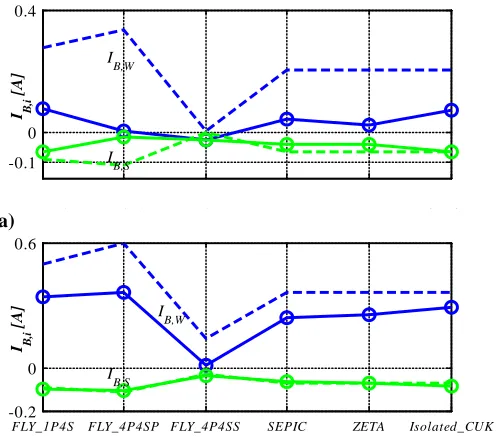
Fig. 15 presents the comparison between the ideal balancing design (Bar nº1), the parasitic modelled design (Bar nº2) and the real experimental results (Bar nº3). The red part of the bar are the power losses Ploss,Tand the blue part is the total balancing power PB,T.
The ideal balancing model represented in the first Bar (Bar nº1) injects the maximum energy to the system, without any power loss.
The power losses model presented in section III and represented in Fig. 12 by Bar nº2, give the new balancing power
P*B,Twhen the power losses of the converter are taken into
account.
Bar nº3 of Fig. 12 give the power measurements made by the direct measurements of the power supply.
Good accuracy between real results and power losses is expected, knowing that power losses measurement in low power devices and high switching frequency devices is a difficult job.
The efficiency ηdecreases respected to the 100 % ideal efficiency. A good approach between experimental and modelled is obtained thanks to the RMS calculations of DCM currents.
[image:8.612.321.564.61.160.2]For the selective balancing systems is kept around 75 %Fig. 13. Fig. 11. Total real balancing power P*B,Tand power losses PLoss,T
under a balanced situation with VB,i=3.65V. Maximum power
losses occur at maximum cell voltage. Efficiency ηis calculated under balanced situation equation presented in (33).
Fig. 12. Total balancing power PB,Tand power losses PLoss,T
comparison for each balancing system. Bar nº1 ideal balancing model. Bar nº2 power losses model. Bar nº3 real experimental results. Red bar: Power losses PLoss,T and blue Bar total
balancing power PB,T
Fig. 13. Ideal balancing efficiency ηideal, modelled efficiency ηmodel and the real experimental efficiency ηreal, for all the 6
different balancing systems under a big unbalance situation
VB,W=2 V and VB,S=3.65 V.
Fig. 14. Ideal Weak balancing current IB,Win dashed blue.
Modelld real Weak balancing current I*B,Wfilled circle green.
Real experimental Weak balancing current I*B,Wfilled red
circle.
0 0.15 0.3 0.45
P
[
W]
0 5 10 15
η
[
%]
P* B,T
P Loss,T
η
FLY_1P4S FLY_4P4SP FLY_4P4SS SEPIC ZETA Isolated_CUK
0 1 2 3
P
[W
]
n
º1 nº2 nº3
FLY_1P4S FLY_4P4SP FLY_4P4SS SEPIC ZETA Isolated_CUK
50 75 100 110
η
[
%]
FLY_1P4S FLY_4P4SP FLY_4P4SS SEPIC ZETA Isolated_CUK
η
ideal
η
model
η
real
0 0.1 0.5 0.6
I B,W
[
A]
FLY_1P4S FLY_4P4SP FLY_4P4SS SEPIC ZETA Isolated_CUK
I B,W
I*B,Wreal
[image:8.612.42.284.61.160.2] [image:8.612.41.280.571.669.2] [image:8.612.329.569.582.680.2]The biggest the unbalancing is, the higher the efficiency reached by the balancing system.
The non-selective balancing systemFLY_4P4SS has the lowest efficiency nearly 50% because produces high power losses due to the current flow to all the series connected cells. The efficiency is low even if the balancing current of the system is the lowest. With the power losses modelling and the efficiency calculation a new estimation of the real balancing current I*B,i could be made.
The power losses are subtracted to the Weak cell (31) except for the non-selective FLY_4P4SS converter that are redistributed inversely proportional to the voltage as presented in (32).
The balancing current is reduced due to the power losses of the converter Fig. 14. The modelled Weak cell balancing current
I*B,Wmodel permits to evaluate the real balancing current, with
good accuracy.
II. CONCLUSIONS
During this present work main single switch active balancing topologies have been analyzed, modelled and tested. Single switch active balancing systems present high simplicity due to a unique active device is used. They also have the natural behavior to balance series connected cells with an open loop control strategy. For that issue, DCM mode must be guaranteed during all the working points.
During Section II the ideal balancing behavior and equations are presented for the 6 most representative singe switch balancing systems. The ideal modelling is focused on the energy transfer between the Strong cells and the Weak cell of a series connected energy storage system. The maximum critical duty cycle equation Dcri is defined, and the balancing currents of
the Weak cell IB,Wand the strong cells IB,Sare defined. The Ideal
modelling equations give the main parameters for the design of a single switch active balancing system because the energy transfer between the Weak cells and the Strong cells is defined.
Section III presents the power loss modelling of the single switch balancing systems. The power losses PLoss,Tof the
converters are taken into account to measure the power reduction of the converter. Due to DCM operation the RMS and AV currents of all the components should be modelled to correctly estimate the power losses PLoss,T. This approach gives a most
accurate model of the balancing currents I*B,iand the converter
balancing power P*B,T.
For the experimental results presented in Section IV the 6 different balancing systems have been designed and constructed to compare different behaviors under unbalanced and balanced situations. A power supply based test bench has been designed to simulate series connected cells unbalances and measure the power losses PLoss,Tand balancing power P*B,Tindirectly by the
power supply measurements. Duringunbalancing situation it has been seen that the Weak cell balancing current I*B,Wis always
bigger that the Strong cells balancing current I*B,S. During
balanced situation it has been demonstrated that the balancing power of the system only contributes energy to compensate the power losses of the system. No energy is exchanged between the cells. Ideal, modelled and experimental results are compared to evaluate the accuracy of the modelling and main conclusions are obtained.
The balancing system efficiency η for a big unbalance case is kept above 75%. It is a high efficiency for systems which manage only 2 Watts of balancing power.
The non-selective FLY_4P4SS is the lowest efficiency system, and is not selective, decreasing the balancing speed of the system. This topology is the worst located for future balancing system designs.
Between the selective topologies, the efficiencies are similar and the behavior is similar. The FLY_4P4SP with the primaries in parallel has the worst behavior when a small balance is produced, due to higher power losses.
TheIsolated_CUK will be a good balancing system candidate when high numbers of cells are connected in series. When high number of cells are connected in series the Dcri could
be very small, and the degree of freedom of the transformer ratio gives flexibility in the value of the duty cycle. This also happens in the different flyback topologies.
Futurework
Future work will be held by testing the balancing systems in real battery pack tests. The main results of the energy increase and voltage balancing effect will be presented in future publications.
21. Table III
22. Ideal, modelled and real data comparison. Total balancing power PB,T, Total power losses PLoss,T, efficiency η and
balancing current of the Weak cell IB,W. Working point unbalanced VB,W=2 V and VB,S=3.65 V.
23. PB,T [W] 24.25. PLoss,T[W] 26.27. η [%] 28.29. IB,W[A] 30. Ide
al
31. Mo del
32. Rea l 33.
34. Ide al
35. Mo del
36. Rea l 37.
38. Ide al
39. Mo del
40. Rea l 41.
42. Ide al
43. Mo del
44. Rea l FLY_1P4S 1.997 1.672 1.708 0 0.325 0.328 100 83.71 83.88 0.499 0.337 0.345
FLY_4P4SP 2.198 1.809 1.991 0 0.388 0.535 100 82.33 78.82 0.599 0.305 0.364
FLY_4P4SS 0.578 0.324 0.366 0 0.254 0.29 100 56.05 55.78 0.145 0.037 0.02
SEPIC 1.461 1.175 1.163 0 0.286 0.195 100 80.43 85.64 0.365 0.222 0.242
ZETA 1.461 1.175 1.256 0 0.286 0.245 100 80.43 83.81 0.365 0.222 0.254
Isolated_CU
Appendix
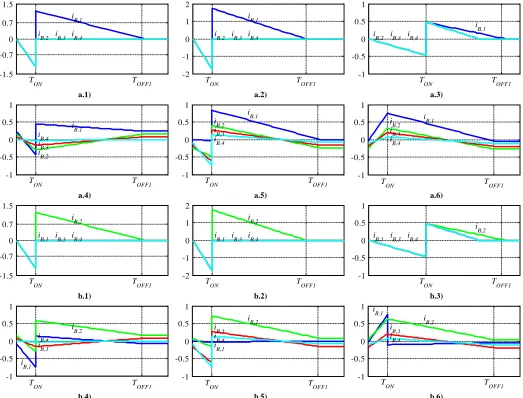
The Appendix presents main single switch topologies current waveforms for two different unbalancing situations for a 4S1P battery back. The unbalancing effect will be analyzed by inserting a weak cell in the bottom cell or first cell (Scenario 1) or in the second cell (Scenario 2).
During Appendix it will be presented that is independent that the Weak cell is in the bottom or in the top part of the series connected cells.
The characteristics balancing currents presented in Fig. 15are presented with the prototype parameters presented in Table II. The DCM operation is guaranteed for both unbalancing scenarios presented in Table IV. This case is guaranteed because
D=0.13, the critical duty cycle for a balancing situation of VB,W=
2 V and VB,S=3.65 V.
Non-selective behavior of the FLY_4P4SS balancing system is clearly observed. During TOFF1 period the balancing current
flows to all the cells, not only to the Weak cell.
The FLY_1P4S and the FLY_4P4SP are selective topologies as could be seen in Fig. 15. It is also presented the higher peak current managed by the FLY_4P4SP due to the parallel operation of the balancing system.
The buck- boost based topologies have different behavior
regarding current ripple depending the situation of the cell in the series connected string.
The SEPIC topology has bigger current ripple in the bottom cell (cell 1), the ZETA configuration in the top cell (cell 4) and the Isolated_CUK in the bottom cell (cell 1). Even the current ripple is different the mean current introduced to all the strong cells is equal.
The Weak cell mean current is always bigger than the
Strong cells mean current.
The TOFF1 period depends directly in the Weak cell voltage,
except for the non-selective FLY_4P4SS, were the biggest TOFF1
period is the Weak cell voltage current but the other cells have different TOFF1 periods depending on their voltages.
45. Table IV
46. Different unbalancing scenarios For single switch balancing system current analysis
Scenario 47. VB,1 48. VB,2 49. VB,3 50. VB,4
1 2 3 3 3
2 3 2 3 3
a.1) a.2) a.3)
a.4) a.5) a.6)
b.1) b.2) b.3)
b.4) b.5) b.6)
Fig. 15. Single switch balancing current waveforms. Vertical Axis: Balancing currents IB,i [A]. Letter index: a) Scenario1, b) Scenario 2. Number index: 1)
FLY_1P4S 2) FLY_4P4SP 3) FLY_4P4SS 4) SEPIC 5) ZETA, 6) Isolated_CUK.
-1.5 -0.7 0 0.7 1.5
TON TOFF1
iB,1
i
B,2 iB,3 iB,4
-2 -1 0 1 2
TON TOFF1
iB,1
i
B,2 iB,3 iB,4
-1 -0.5 0 0.5 1
TON TOFF1 i
B,1 i
B,2 iB,3 iB,4
-1 -0.5 0 0.5 1
TON TOFF1
i B,1 i
B,4 i
B,3 i
B,2
-1 -0.5 0 0.5 1
TON TOFF1
i B,1 i
B,2 i
B,3 i
B,4
-1 -0.5 0 0.5 1
T
ON TOFF1
i B,1 i
B,2 i
B,3 i
B,4
-1.5 -0.7 0 0.7 1.5
T
ON TOFF1
i B,2
i
B,1 iB,3 iB,4
-2 -1 0 1 2
T
ON TOFF1
i B,2
i
B,1 iB,3 iB,4
-1 -0.5 0 0.5 1
T
ON TOFF1
i B,2 i
B,1 iB,3 iB,4
-1 -0.5 0 0.5 1
T
ON TOFF1
i B,2 i
B,4 i
B,3
i B,1
-1 -0.5 0 0.5 1
T
ON TOFF1
i B,2
iB,4 i
B,1 i
B,3
-1 -0.5 0 0.5 1
T
ON TOFF1
i B,2 i
B,3 iB,4 i
[image:10.612.35.558.327.725.2]REFERENCES
[1] E. Comission, “Energy 2020 - A strategy for competitive, sustainable and secure energy,” Brussels, 2010. .
[2] EVE, “Basque country energy strategy 2020 (E2020),” p. 236, 2012. [3] S. Gill, I. Kockar, and G. W. Ault, “Dynamic Optimal Power Flow for
Active Distribution Networks,” Power Systems, IEEE Transactions on, vol. 29, no. 1. pp. 121–131, 2014.
[4] C. Abbey and G. Joos, “Supercapacitor Energy Storage for Wind Energy Applications,” Industry Applications, IEEE Transactions on, vol. 43, no. 3. pp. 769–776, 2007.
[5] K. Agbossou, M. Kolhe, J. Hamelin, and T. K. Bose, “Performance of a stand-alone renewable energy system based on energy storage as hydrogen,” Energy Conversion, IEEE Transactions on, vol. 19, no. 3. pp. 633–640, 2004.
[6] J. P. Barton and D. G. Infield, “Energy storage and its use with intermittent renewable energy,” Energy Conversion, IEEE Transactions on, vol. 19, no. 2. pp. 441–448, 2004.
[7] B. S. Borowy and Z. M. Salameh, “Methodology for optimally sizing the combination of a battery bank and PV array in a wind/PV hybrid system,” Energy Conversion, IEEE Transactions on, vol. 11, no. 2. pp. 367–375, 1996.
[8] J. M. Carrasco, L. G. Franquelo, J. T. Bialasiewicz, E. Galvan, R. C. P. Guisado, M. A. M. Prats, J. I. Leon, and N. Moreno-Alfonso, “Power-Electronic Systems for the Grid Integration of Renewable Energy Sources: A Survey,” Industrial Electronics, IEEE Transactions on, vol. 53, no. 4. pp. 1002–1016, 2006.
[9] B. Hartmann and A. Dan, “Methodologies for Storage Size Determination for the Integration of Wind Power,” Sustainable Energy, IEEE Transactions on, vol. 5, no. 1. pp. 182–189, 2014.
[10] N. Mendis, K. M. Muttaqi, and S. Perera, “Management of Battery-Supercapacitor Hybrid Energy Storage and Synchronous Condenser for Isolated Operation of PMSG Based Variable-Speed Wind Turbine Generating Systems,” Smart Grid, IEEE Transactions on, vol. 5, no. 2. pp. 944–953, 2014.
[11] K. Strunz, E. Abbasi, and D. N. Huu, “DC Microgrid for Wind and Solar Power Integration,” Emerging and Selected Topics in Power Electronics, IEEE Journal of, vol. 2, no. 1. pp. 115–126, 2014.
[12] C. X. Wu, C. Y. Chung, F. S. Wen, and D. Y. Du, “Reliability/Cost Evaluation With PEV and Wind Generation System,” Sustainable Energy, IEEE Transactions on, vol. 5, no. 1. pp. 273–281, 2014.
[13] F. Diaz-Gonzalez, F. D. Bianchi, A. Sumper, and O. Gomis-Bellmunt, “Control of a Flywheel Energy Storage System for Power Smoothing in Wind Power Plants,” Energy Conversion, IEEE Transactions on, vol. 29, no. 1. pp. 204–214, 2014.
[14] S. Teleke, M. E. Baran, A. Q. Huang, S. Bhattacharya, and L. Anderson, “Control Strategies for Battery Energy Storage for Wind Farm Dispatching,” Energy Conversion, IEEE Transactions on, vol. 24, no. 3. pp. 725–732, 2009.
[15] G. Xu, L. Xu, D. J. Morrow, and D. Chen, “Coordinated DC Voltage Control of Wind Turbine With Embedded Energy Storage System,” Energy Conversion, IEEE Transactions on, vol. 27, no. 4. pp. 1036–1045, 2012. [16] A. F. Burke, “Batteries and Ultracapacitors for Electric, Hybrid, and Fuel
Cell Vehicles,” Proceedings of the IEEE, vol. 95, no. 4. pp. 806–820, 2007. [17] A. Khaligh and Z. Li, “Battery, Ultracapacitor, Fuel Cell, and Hybrid
Energy Storage Systems for Electric, Hybrid Electric, Fuel Cell, and Plug-In Hybrid Electric Vehicles: State of the Art,” Vehicular Technology, IEEE Transactions on, vol. 59, no. 6. pp. 2806–2814, 2010.
[18] O. Briat, J.-M. Vinassa, W. Lajnef, S. Azzopardi, and E. Woirgard, “Principle, design and experimental validation of a flywheel-battery hybrid source for heavy-duty electric vehicles,” Electric Power Applications, IET, vol. 1, no. 5. pp. 665–674, 2007.
[19] E. Schaltz, A. Khaligh, and P. O. Rasmussen, “Influence of Battery/Ultracapacitor Energy-Storage Sizing on Battery Lifetime in a Fuel Cell Hybrid Electric Vehicle,” Vehicular Technology, IEEE Transactions on, vol. 58, no. 8. pp. 3882–3891, 2009.
[20] E. Tara, S. Shahidinejad, S. Filizadeh, and E. Bibeau, “Battery Storage Sizing in a Retrofitted Plug-in Hybrid Electric Vehicle,” Vehicular Technology, IEEE Transactions on, vol. 59, no. 6. pp. 2786–2794, 2010.
[21] H. Yoo, S.-K. Sul, Y. Park, and J. Jeong, “System Integration and Power-Flow Management for a Series Hybrid Electric Vehicle Using Supercapacitors and Batteries,” Industry Applications, IEEE Transactions on, vol. 44, no. 1. pp. 108–114, 2008.
[22] C.-S. Moo, K. S. Ng, and Y.-C. Hsieh, “Parallel Operation of Battery Power Modules,” Energy Conversion, IEEE Transactions on, vol. 23, no. 2. pp. 701–707, 2008.
[23] C.-S. Moo, K.-S. Ng, and J.-S. Hu, “Operation of battery power modules with series output,” Industrial Technology, 2009. ICIT 2009. IEEE International Conference on. pp. 1–6, 2009.
[24] T. Kim, W. Qiao, and L. Qu, “A series-connected self-reconfigurable multicell battery capable of safe and effective charging/discharging and balancing operations,” Applied Power Electronics Conference and Exposition (APEC), 2012 Twenty-Seventh Annual IEEE. pp. 2259–2264, 2012.
[25] F. Jin and K. G. Shin, “Pack Sizing and Reconfiguration for Management of Large-Scale Batteries,” Cyber-Physical Systems (ICCPS), 2012 IEEE/ACM Third International Conference on. pp. 138–147, 2012.
[26] T. Kim, W. Qiao, and L. Qu, “Power Electronics-Enabled Self-X Multicell Batteries: A Design toward Smart Batteries,” Power Electronics, IEEE Transactions on, vol. PP, no. 99. p. 1, 2012.
[27] H. Qian, J. Zhang, J.-S. Lai, and W. Yu, “A High-Efficiency Grid-Tie Battery Energy Storage System,” Power Electronics, IEEE Transactions on, vol. 26, no. 3. pp. 886–896, 2011.
[28] J. R. Belt, C. D. Ho, T. J. Miller, M. A. Habib, and T. Q. Duong, “The effect of temperature on capacity and power in cycled lithium ion batteries,” J. Power Sources, vol. 142, no. 1–2, pp. 354–360, Mar. 2005.
[29] S. Santhanagopalan and R. E. White, “Quantifying Cell-to-Cell Variations in Lithium Ion Batteries,” Int. J. Electrochem., vol. 2012, pp. 1–10, 2012. [30] M. Uno and K. Tanaka, “Influence of High-Frequency Charge-Discharge
Cycling Induced by Cell Voltage Equalizers on the Life Performance of Lithium-Ion Cells,” Vehicular Technology, IEEE Transactions on, vol. 60, no. 4. pp. 1505–1515, 2011.
[31] I. Aizpuru, U. Iraola, J. M. Canales, E. Unamuno, and I. Gil, “Battery pack tests to detect unbalancing effects in series connected Li-ion cells,” Clean Electrical Power (ICCEP), 2013 International Conference on. pp. 99–106, 2013.
[32] C. Martinez, “Cell Balancing Maximizes The Capacity Of Multi-Cell Li-Ion Battery Packs,” Intersil. Inc.
[33] Y. Barsukov and T. Instruments, “Battery Cell Balancing : What to Balance and How.”
[34] W. C. Lee, D. Drury, and P. Mellor, “Comparison of passive cell balancing and active cell balancing for automotive batteries,” Vehicle Power and Propulsion Conference (VPPC), 2011 IEEE. pp. 1–7, 2011.
[35] B. Lindemark, “Individual cell voltage equalizers (ICE) for reliable battery performance,” Telecommunications Energy Conference, 1991. INTELEC ’91., 13th International. pp. 196–201, 1991.
[36] S. Moore, “A review of cell equalization methods for lithium ion and lithium polymer battery systems,” 2001.
[37] C.-H. Kim, M. Kim, J.-H. Kim, and G.-W. Moon, “Modularized charge equalizer with intelligent switch block for lithium-ion batteries in an HEV,” Telecommunications Energy Conference, 2009. INTELEC 2009. 31st International. pp. 1–6, 2009.
[38] C.-H. Kim, M.-Y. Kim, Y.-D. Kim, and G.-W. Moon, “A modularized charge equalizer using battery monitoring IC for series connected Li-Ion battery strings in an electric vehicle,” Power Electronics and ECCE Asia (ICPE & ECCE), 2011 IEEE 8th International Conference on. pp. 304–309, 2011.
[39] C.-H. Kim, M.-Y. Kim, H.-S. Park, and G.-W. Moon, “A Modularized Two-Stage Charge Equalizer With Cell Selection Switches for Series-Connected Lithium-Ion Battery String in an HEV,” Power Electronics, IEEE Transactions on, vol. 27, no. 8. pp. 3764–3774, 2012.
[40] C. Kim, H. Park, G. Moon, and A. C. Description, “A Modularized Two-Stage Charge Equalization Converter for Series Connected Lithium-Ion Battery Strings in an HEV,” pp. 992–997, 2008.
[42] H.-S. Kim, K.-B. Park, S.-H. Park, G.-W. Moon, and M.-J. Youn, “A new two-switch flyback battery equalizer with low voltage stress on the switches,” Energy Conversion Congress and Exposition, 2009. ECCE 2009. IEEE. pp. 511–516, 2009.
[43] H.-S. Park, C.-H. Kim, K.-B. Park, G.-W. Moon, and J.-H. Lee, “Design of a Charge Equalizer Based on Battery Modularization,” Vehicular Technology, IEEE Transactions on, vol. 58, no. 7. pp. 3216–3223, 2009. [44] J. Ewanchuk, D. Yague, and J. Salmon, “A modular balancing bridge for
series connected Li-ion batteries,” Energy Conversion Congress and Exposition (ECCE), 2011 IEEE. pp. 2908–2915, 2011.
[45] M. Uno and K. Tanaka, “Single-Switch Cell Voltage Equalizer Using Multistacked Buck-Boost Converters Operating in Discontinuous Conduction Mode for Series-Connected Energy Storage Cells,” Vehicular Technology, IEEE Transactions on, vol. 60, no. 8. pp. 3635–3645, 2011. [46] M. Uno and K. Tanaka, “Single-Switch Multi-Output Charger Using
Voltage Multiplier for Series-Connected Lithium-Ion Battery/Supercapacitor Equalization,” Industrial Electronics, IEEE Transactions on, vol. PP, no. 99. p. 1, 2012.
[47] N. H. Kutkut, H. L. N. Wiegman, D. M. Divan, and D. W. Novotny, “Design considerations for charge equalization of an electric vehicle battery system,” IEEE Trans. Ind. Appl., vol. 35, no. 1, pp. 28–35, 1999
AUTHORS
First AuthorDr. Iosu Aizpuru. Computing and Electronics
department, University of Mondragon, Arrasate- Mondragon, Spain
Second AuthorDr.UnaiIraola. Computing and Electronics
department, University of Mondragon, Arrasate- Mondragon, Spain
Third Author Eng. Jose María Canales. Computing and
Electronics department, University of Mondragon, Arrasate- Mondragon, Spain
Forth AuthorDr.Ander Goikoetxea. Computing and Electronics
department, University of Mondragon, Arrasate- Mondragon, Spain
Fifth Author PhD student. Erik Garayalde Computing and