231
Chapter 31
Mitigation of N
2O and CH
4emissions from Corn Field using Urea Granulated with
Nitrification Inhibitors and Zeolite
Oslan Jumadi1,a, Indra Pramana1, Andi Takdir Makkulawu2, R. Neni Iriany2, Yusminah Hala1, Hartono1, St. Fatmah Hiola1, Kazuyuki Inubushi3
1
Department of Biology, Faculty of Mathematics and Natural Sciences, State University of Makassar, Jl Daeng. Tata Raya, Makassar, Indonesia 2
Indonesian Cereals Research Institute (ICERI). Jl. Dr. Ratulangi, Maros, Indonesia 3
Graduate School of Horticulture, Chiba University. Matsudo, Chiba 271-8510. Japan a
Abstract. Agriculture accounted considerably to the greenhouse gases emission such as N2O and CH4. The aim of study is assessing reduction of N2O and CH4emissions from corn field fertilized with urea granulated nitrification inhibitor namely dicyandiamide (DCD) and neem (N) and zeolite as slow release media. The results show that nitrification inhibitors and zeolite is reducing both N2O and CH4emissions from corn field fertilized. We observed that the application of urea (U) with dicyandiamide (UD), U with zeolite (UZ), U with neem (UN), U with
zeolite+neem (UZN), and U with zeolite+ DCD decreased the N2O emissions by 86.73%, 59.65%, 16.38%, 66.85%, and 81.94%, respectively. Therefore, larger reduction of N2O emission in corn field was applied by UD. However, applying UD in field seems enhance CH4emission 0.95 kg CH4-C ha
-1
season-1compared to other treatments. The observations should be further being tested to an integrated abatement of agricultural nitrogen as well as carbon losses.
Keywords: Cornfield, Emission of N2O and CH4,Mitigation, Nitrification inhibitor
I.
Introduction
Urea (CO(NH2)2 has been widely used by farmers as a major source of nitrogen to support corn production. The use of urea fertilizer in agriculture in order to increase the quantity and quality of agricultural food production turned out to have an impact on ozone layer depletion due to enhance the Greenhouse Gas emissions particularly N2O gas (IPCC. 2007).
Plants require nitrogen as a constituent element of proteins, nucleic acids and other important organic molecules. Plants absorb nitrogen in the form of ammonium (NH4
+
) and nitrate (NO3
-). Ammonium cation form are bounded by the negatively charged of soil particles, therefore that are relatively stable in the soil. Conversely, in the form of
-NO3 anion is more mobile and is not retained by soil particles so easily swept away by runoff or missing gas
vaporized in the form of N2O, NO and N2 through nitrification and denitrification processes and thus potentially become as greenhouse gases, (Firestone and Davidson, 1989)
232
Greenhouse gases capable of absorbing solar radiation in the atmosphere, causing the temperature at the surface of the earth becomes warmer. However, various human activities, particularly agriculture sector as well as industrial processes and transport, causing GHG emitted into the atmosphere continue to rise. As a result, there was a change in the composition of greenhouse gases in the atmosphere. Then this causes the radiation reflected back by the earth's surface into space constrained, causing the accumulation of heat in the atmosphere (Mosier and Kroeze, 2000).Emissions in agricultural land is determined by the denitrification process in anaerobic soil conditions and nitrification in aerobic soil conditions. The process of release of nitrous oxide from the soil into the air which is influenced by diffusion processes in the soil and the soil's capacity to consume N2O, which is determined by several factors, among others, production footprint in the soil, soil texture and soil water content (Jumadi et al,
2005; 2008). Denitrification is the final step in nutrient cycling of nitrogen in anaerobic atmosphere wherein the fixed nitrogen is returned to the atmosphere in the form of N2O (Di and Cameron, 2006).
Reduction of greenhouse gas emissions resulting from the provision of urea fertilizer on crops can be done by adding a slow-release materials such as zeolites and nitrification inhibitors (neem and DCD) on urea fertilizer used (Majumdar et al, 2001;2004). Neem as a natural nitrification inhibitor and DCD as synthesis nitrification inhibitors. Neem seeds contain secondary metabolites such as polyphenols or certain unsaturated fats that can act as inhibitors of nitrification and can improve the efficiency of urea fertilizer (Malla et al, 2010). However, the urea granulated with nitrification inhibitor and control slow release has not been use in Indonesia to reduce emissions of greenhouse gases and rate nitrification.
II. Materials and Methods
This study was conducted over 6 months beginning in July 2014 until February 2015 in Balitsereal Indonesian Cereals Research Institute (ICERI), Maros (4°59'11.3"S 119°34'34"E). This study consisted of seven treatments namely control (K), urea (U), urea zeolite (UZ), neem urea (UN), urea dicyandiamide (UD), neem zeolite urea (UZN), and urea zeolite dicyandiamide (UZD) with three replicates. Granulating of fertilizer were made using inclined pan granulator.
Fertilization was done in split time, 100 kg N/ ha for the first fertilization and 100 kg N/ha for the second fertilization. The first fertilization is done on the 7th day after planting the seed and fertilizer second is 29 days after planting the seed.
N2O and CH4 emission rate was measured using chamber closed method (Jumadi et al, 2008) Basic chamber put into the ground as deep as 2-5 cm around the corn crop. The temperature inside the chamber is measured using a thermometer. Gas sampling is done at minute 0 and 20 every 4 days during corn planting season. Gas retrieval performed at 8:00 to 11:00 a.m. Gas samples were taken around 30 ml and then immediately transferred into the vacuum vial. The concentration of N2O was determined by gas chromatography (Shimadzu, GC 14B) equipped with eletctron capture detector (ECD), while the concentration of CH4 with flame ionization detector (FID). The rate of N2O and CH4 were calculated from the change in concentration of N2O and CH4over time. The cumulative rate of N2O and CH4 per season from the field were obtained by integration of N2O or CH4 fluxes during the cropping season. The EF = Emission Factor was calculated using the following equation.
EF (%) = (TF-TUF)/ N x100
233
g m C
-4
H C as G i is m
4 3
-2
-1
C
H4
fl
u
x
C
H4
-C
m
g
m
h
N2
O
fl
ux
N2
O
-N
m
g
m
-2
h
-1
L
aju
E
Percentage loss of N2O produced from fields with nitrification inhibitors or nitrification inhibitor and zeolite combination was calculated using the following equation.
N2O Reduction (%)=(A-C)/ (A-B) x100
Where A is the cumulative emissions of N2O in the urea plot, B is the cumulative emissions of N2O in the control plot, and C is the cumulative emissions of N2O in the plot nitrification inhibitor (UZ, UN, UD, UZN, UZD).
NH+and NO-concentrations were determined by weighing 10 grams of soil then put in clean plastic sample bottle
and extracted with 50 ml of 2M KCl solution. Amounts of NH4 +
and NO3
-were determined by the nitroprusside (Anderson et al. 1989) and Hydrazine reduction (Hayashi et al. 1997) methods, respectively. Standard deviations and means of the data were calculated. Each mean was compared with others using the least significant differences (LSD=0.05) value by SPSS software (Ver.20.0 for windows, SPSS Inc., Chicago, USA).
III. Results and Discussions
[image:3.595.102.517.383.663.2]The emissions of N2O emissions were observed peaked on 44 days after transplanting (DAT) for all treatments where counted as K (0.03), U (0.98), UZ (0.37), UZD (0.15), UZN (0.34), UD (0.08), UN (1.3), then gradually decrease until 84 DAT (Fig.1). While, CH4 gas were emitted on 52 DAT, as K (0.3), UZN (0.01), UZD (0.12), UD (0.37), UN (0.035). Therefore, flux of N2O was highly emitted at urea treatment compare to UZ, UZN, and UN than UD and UZD treatments which might be zeolite acts as a slow-release fertilizer and inhibition of nitrification process.
Fig. 1. Emission gas of N2O, CH4, soil moisture, dan precipitation in a season corn plantation.
234
DCD effective under aerobic conditions, and larger accounts for the results of N2O in the process of denitrification under waterlogged conditions. In addition to aerobic conditions, the concentration of N2O emissions are also influenced by several factors such as soil temperature, soil moisture, soil aeration status, structure, texture, precipitation/ irrigation, pH, organic matter content, soil type, rainfall and soil water content.The highest emission factors generated by the urea due to the absence of nitrification inhibitors in combination with urea to lead nitrification and denitrification to release of N2O into the atmosphere. Emission factor of UN was generated higher than UD, while UZN was higher compared with UZD. Emission factor is a representative value that connects a quantity of pollutants released into the atmosphere from an activity related to the sources of pollutants (Jumadi et al, 2008). These factors are usually expressed as the weight of pollutant divided by a unit weight, volume, distance, or duration of activity which emit pollutants
[image:4.595.44.542.344.476.2]The number of nitrogen escaping into the atmosphere per growing season (July to September 2014) the highest in the plot urea with 4.36 kg N ha-1season-1followed by the UN with 3.64 kg N ha-1season-1, then plot UZ and UZN each 1.76 kg N ha-1season-1and 1.44 kg N ha-1season-1. UZD and UD for each 0.78 kg N ha-1season-1and 0.57 kg N ha-1 season-1. Therefore, Reduction of N2O emissions by addition of UD was highest around 86.7% then UZD, UZN, UZ, and UN as 81.9%, 66.8%, 59.6%, and 16.3 respectively (Table 1). Nitrification inhibition is an effort to minimize N losses through leaching. Malla et al (2005) suggested that in order to reduce N losses and increase efficiency, one of the mechanisms is the use of nitrification inhibitors.
Table 1. The Emission Factor (EF%) and N2O Reduction in a season corn plantation
Treatment Total gas
(Kg N2O-N/ha/season)
EF % Reduction %
K 0,31a
U 4,6d 2,1
UZ 2,0bc 0,8 59,6
UN 3,9cd 1,8 16,3
UD 0,8a 0,2 86,7
UZN 1,7a 0,7 66,8
UZD 1,1a 0,3 81,9
Description : The numbers followes by the same means it isn’t real in the standard ofα= 0,05
The concentration of N2O emissions were influenced by several factors such as soil moisture and soil aeration status, structure, texture, porosity and precipitation, pH, organic matter content, soil type, rainfall and soil moisture content, Increasing concentrations of N2O emissions were affected by soil moisture at 44thday (Fig. 1). N2O gas is produced naturally in soils by microbiological processes, nitrification and denitrification. Nitrification bacteria which is Chemoautotrofik bacteria play a role in the process of nitrification and denitrification that is responsible for the loss of N from crop land (Di and Cameron, 2006)
Nitrification is the oxidation of ammonium to nitrate via intermediate products nitrites, while denitrification is the reduction of nitrate to nitrogen gas and by products such as nitrite also. Nitrification is the ammonium oxidation process to produce nitrate involving two groups of microorganisms, namely ammonium group and nitric oxide oxidation bacteria. Nitrification inhibitors used are neem and dicyandiamide (DCD).
235
68 72 76 80 84 88
K 13,8 6,3b 31,9 7,1a 3,4b 17,3c
U 20,7 13,6a 47,5 12,1a 4,7c 33,5c
UZ 16,9 29,9a 56,4 40,2b 5,5c 21,6ab
UN 16,8 5,1b 64,4 46,5b 1,9a 24,2c
UD 28,3 11,9ab 46,4 6,3a 5,2c 7,00a
UZN 24,4 23,7a 44,8 13,3a 4,6c 12,7ab
UZD 19,4 26,9a 77,8 10,9a 11,6d 12,9ab
3
bacteria, so it can suppress the conversion of ammonium to nitrite or suppress the conversion of nitrite to nitrate, thus resulting N2O emissions are low.
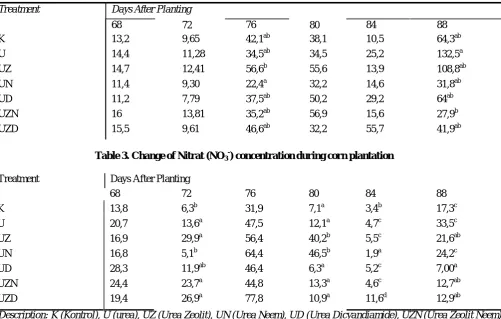
Inhibition of the nitrification process can be determined by doing analysis of ammonium and nitrate. Ammonium and nitrate is an indicator of the occurrence of nitrification in the soil, if nitrate in the soil high and ammonium low that is indicating that nitrification occurs while the ammonium in the soil when the high and low nitrate indicates that the nitrification process is inhibited (Table 2 and 3).
Table 2. Change of Ammonium (NH4 +
) concentration during corn plantation
Treatment Days After Planting
68 72 76 80 84 88
K 13,2 9,65 42,1ab 38,1 10,5 64,3ab
U 14,4 11,28 34,5ab 34,5 25,2 132,5a
UZ 14,7 12,41 56,6b 55,6 13,9 108,8ab
UN 11,4 9,30 22,4a 32,2 14,6 31,8ab
UD 11,2 7,79 37,5ab 50,2 29,2 64ab
UZN 16 13,81 35,2ab 56,9 15,6 27,9b
[image:5.595.59.561.181.500.2]UZD 15,5 9,61 46,6ab 32,2 55,7 41,9ab
Table 3. Change of Nitrat (NO3-) concentration during corn plantation
Treatment Days After Planting
Description: K (Kontrol), U (urea), UZ (Urea Zeolit), UN (Urea Neem), UD (Urea Dicyandiamide), UZN (Urea Zeolit Neem),
Urea Zeolit Dicyandiamide). The numbers followes by the same means it isn’t real in the standard ofα= 0,05
Availability of nitrate in the soil is one of the factors that determine the rate of denitrification. NO - very unstable
on waterlogged soil conditions, which in a few days after the flooding nitrate will be lost as N2O and N2 through denitrification. Denitrification processes generate N2O in anaerobic atmosphere, but it is reported that the process can take place in the presence of O2(Di and Cameron, 2006).
Contrast to N2O, CH4 not only produced through microbial activity but can also be produced from the transport of coal, natural gas, and petroleum. The low concentration of CH4gas emissions produced because of low rainfall on agricultural land. According Conrad and Klose (2006) Methane is produced as the end result of microbial processes through the process of anaerobic decomposition of organic matter by methanogenic archeae. These archeae only active when soil conditions in the stagnant state.
Increasing emissions of CH4 gas on 52 th
236
Comparing urea to control, the emissions of CH4 and N2O highest generated by U fertilizer whereas the control treatment generates the lowest CH4 and N2O (Fig. 1). Then, if the comparison of granulated urea fertilizers with nitrification inhibitor experienced (Neem) and synthesis (Dicyandiamide) The highest gas emissions produced in the emissions of CH4 gas is UD and UZD, while the lowest CH4 emissions generated are UN and UZN. It is inversely proportional to N2O emissions that was generated the highest N2O emissions generated by the UN and UZN, whereas the lowest was UD and UZD Methane (CH4) will only be formed on the surface of the soil is very reductive conditions, stagnant in the long term as well as swamps, ponds, dams, or water basin. Being in areas experiencing flooding and drying alternately (alternate) such as rice cultivation systems, reductive conditions to produce gas (CH4) is relatively difficult to achieve. In addition to anaerobic conditions , other factors that affect the formation of CH4 gas is pH. Soil pH is measured with a range of 5,4 to 6,8. Methanogenic require an environment with optimum acidity slightly different to breed. Low pH can inhibit archeae growth asidogenesis, while a pH below 6.4 can be toxic to methanogenesis. pH range suitable for archeael proliferation while the pH range of 6,6 to7 methanogenesis in general is from at pH 6,4 to 7,2.
Methanogenic archeae use carbon compounds and energy to make the process of methanogenesis, carbon compounds are used eg compound mixture of H2 and CO2, formic, methanol, methylamine, acetate. Methanogens also play an important role against rotation H2in anaerobic environments (Conrad and Klose, 2006).
IV. Conclusions
The urea granulation without nitrification inhibitors (U) significantly increased the emission of N2O. Urea dicyandiamide (UD) has highest reduction among treatments, but that is not significantly different from the urea zeolite dicyandiamide (UZD), urea zeolite neem (UZN), and control (K). This indicates that the UD, UZD, and UZN effective in inhibiting nitrification process, while CH4emission .
References
[1] Akhtar M. 2000. Nematical potential of the neem tree Azardirachta indica (A.Juss). Integ. Pest Manag. Rev. 5: 57–66.
[2] Anderson JM and Ingram JSI.1989. Colometric determination of ammonium. In: Tropical Soil Bio. Fertility. ISSS, CAB International, Wallingford, pp. 42-43.
[3] Conrad, R and M. Klose 2006. Dynamic of the methanogenic archaeal community in anoxic rice soil upon addition of straw. Euro. J. Soil Sci. 57: 476-484.
[4] Di HJ and Cameron KC 2006: Nitrous oxide emissions from two dairy pasture soils as affected by different rates of a fine particle suspension nitrification inhibitor, dicyandiamide. Biol. Fertil. Soils, 42, 472–480. [5] Firestone, MK, and EA Davidson. 1989, Microbiological basis of NO and N2O production and
consumption in soil: in Andreae MO, Schimel DS eds. Exchange of Trace Gases between Terrestrial Ecosystems and the Atmosphere. New York: John Wiley & Sons. pp.7–21.
[6] Foster JC. 1995. Soil physical analysis, pp. 105-106. In Alef. K and Nannipieri (ed.), Methods in Applied Soil Microbiology and Biochemistry. Academic Press. London.
[7] German-Bauer MP and Amberger A. 1989. Degradation of the nitrification inhibitor 1-amidino-2-thiourea in soils, and its action in Nitrosomonas pure culture and soil incubation experiments. Fert. Res. 19: 13-19. [8] Grace C, Hart M, Brookes PC. 2006. Laboratory manual of the soil microbial biomass group. Rothamsted
research. United Kingdom.
237
[10] Hayashi A, Sakamoto K, Yoshida T. 1997. A rapid method for determination of nitrate in soil byhydrazine reduction procedure. Jpn J Soil Sci Plant Nutr. 68: 322-326.
[11] IPCC. 2007. Summary for policymakers. In: Climate Change 2007: The physical Science Basis. Contribution of working group I to fourth assessment report of IPCC. Cambridge University Press, Cambridge, UK and New York, USA.
[12] Jumadi O. Hala Y, Inubushi K. 2005. Production and emission of nitrous oxide and responsible microorganisms in upland acid soil in Indonesia. Soil Science and Plant Nutrient. 51 (5): 693-696.
[13] Jumadi O, Hala Y, Muis A, Ali A, Palennari M, Yagi K, Inubushi K. 2008a. Influences of chemical fertilizers and a nitrification inhibitor on greenhouse gas fluxes in a Corn (Zea mays L.) field in Indonesia. Microbes Environ. 23: 29-34.
[14] Jumadi O, Hala Y, Anas I, Ali A, Sakamoto K, Saigusa M, Yagi K and Inubushi K. 2008b. Community structure of ammonia-oxidizing bacteria and their potential to produce nitrous oxide and carbon dioxide in acid tea soils. Geomicrobiology Journal. Vol. 25: p. 381-389.
[15] Jumadi O.2009. Impact of land management practices on greenhouse gases emissions and microbial communities structure. A Doctoral Thesis “Graduate School of Science and Technology” divison of Advance Bioresources Science, Chiba University. Japan.
[16] Jumadi O, Hala Y, Muis A. 2011. Potensi mimba sebagai bahan penghambat nitrifikasi dalam menekan pemakaian pupuk urea serta penurunan gas N2O. Prosiding, Seminar Nasional Sains. FMIPA-IPB, Bogor. [17] Jumadi O, Ali A, Hala Y, Muis A, Yagi, Inubushi K. 2012. Effect of Controlled Water Level on CH4
and N2O Emissions from Rice Fields in Indonesia. Tropical Agriculture and Development. Vol. 56:4. [18] Jumadi O and Inubushi K. 2012. Methane and Nitrous Oxide Production and Community Structure of
Methanogenic Archaea in Paddy Soil of South Sulawesi, Indonesia. Microbiology Indonesia. Vol. 6:3. [19] Majumdar D, Pathak H, Kumar S, Jain MC.2002. Nitrous oxide emission from a sandy loam inceptisol
under irrigated wheat in India as influenced by different nitrification inhibitors. Agri. Ecosys. Environ. 91: 283-293.
[20] Majumdar D, Pandya, Arora A, Dhara S. 2004. Potential use of Karanjin (3-Methoxy Furano-2’,3’,7,8 Flavone). Arch. Agron and Soil Sci. 55: 455–465.
[21] Malla G, Bhatia A, Pathak H, Prasad S, Jain N, Singh J. 2005. Mitigating nitrous oxide and methane emission from soil in rice-wheat system of the Indo-Gangetic plain with nitrification and urease inhibitors. Chemosphere 58: 141-147.
[22] Mosier AR and Kroeze C. 2000. Potential impact on the global atmospheric N2O budget of the increased nitrogen input required to meet future global food demands. Chemosphere-Global Change Sci. 2:465-473.
[23] Prasad R and Power JF 1995. Nitrification inhibitor for agriculture, health and the environment. Adv. Agron 54:233-281.